

Source: https://www.kantarmedia.com/us/thinking-and-resources/blog/promotions-trends-2020-mid-year-catch-up
As part of Kantar’s commitment to providing you with comprehensive insights into brand advertising and promotion activity, we thought it would be useful to look at notable Print and Digital coupon activity for the first half of 2020 including the impact of the ongoing COVID-19 pandemic on promotions.
COVID-19 Impact
In H1 2020, Kantar noted decreases in both Print and Digital promotion activity as brand manufacturers and retailers adjusted their coupon strategies in response to COVID-19.
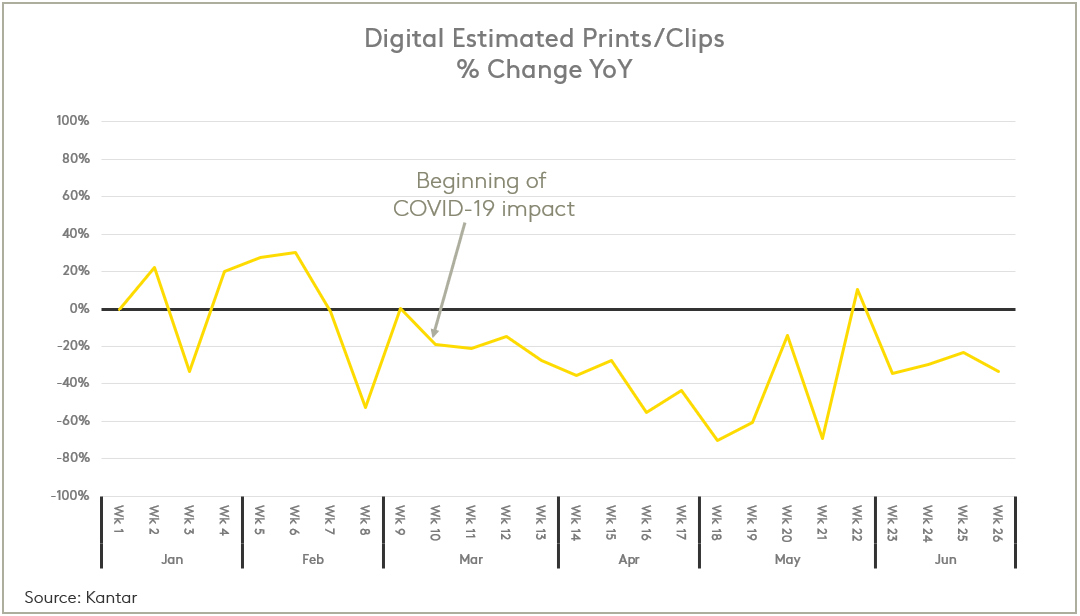
In Digital, we saw a decline in estimated prints/clips beginning in March as well as shorter coupon availability with average days online down 50% to just 9.5 days in March, April and May 2020. Retailer and Network/Affiliate properties saw a year over year reduction in prints/clips as key manufacturers leveraged Brand websites to deliver their offers directly to consumers amidst distribution struggles. Digital Rebates continued to grow in H1 2020 despite the shifting landscape – however, brand manufacturers were no longer offering the higher than average face values seen in previous years.
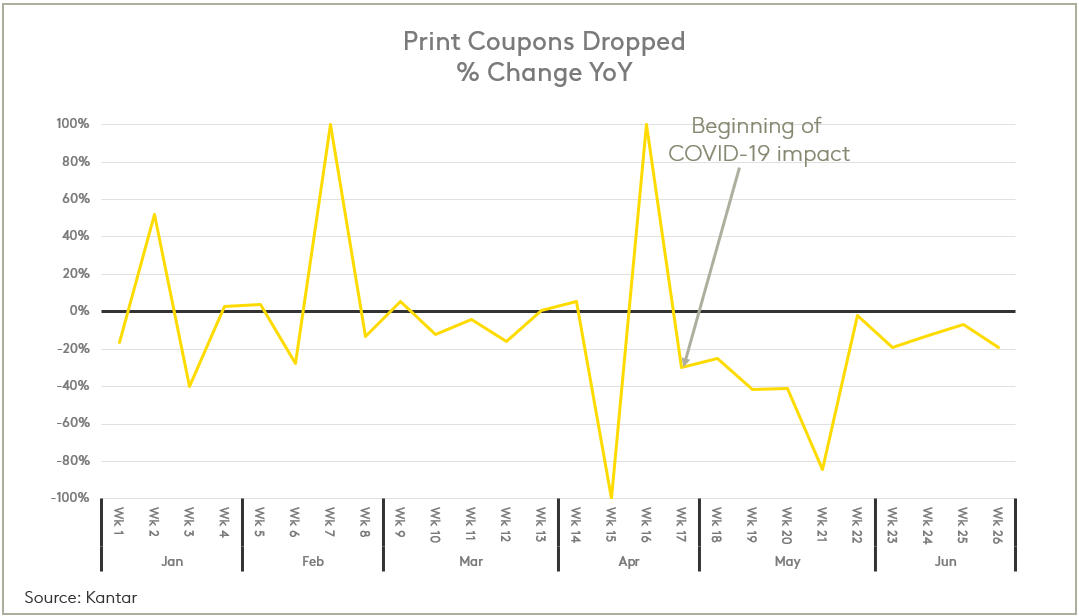
While Print promotion activity also decreased in H1 2020, we did not see uncharacteristic reductions in FSI coupons dropped until late April. The delay in response can largely be attributed to the investment and advanced planning that goes into FSI couponing as well as the stability of Print as a medium, slowing and softening the pandemic response. Although manufacturers have increasingly utilized their FSI creatives to promote social responsibility messages, only one mention of COVID-19 was seen in H1 2020.
The Promotion Landscape
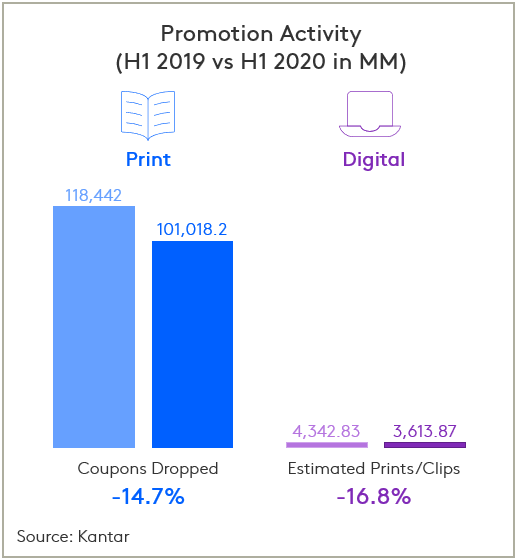
This year, Kantar reports that FSI Print promotion activity (as measured by coupons dropped) fell 14.7% in the first half of 2020.
This decline was driven primarily by Personal Care, Dry Grocery, and Household Products with the most notable downward shifts coming from Snacks and Cosmetics. In addition, 4 out of 5 Food areas saw reductions of more than 25%, further shifting the balance of Print couponing toward Non-Food which now accounts for 79% of FSI coupons dropped. There are, however, still many areas of growth within Print promotion - while Health Care remained flat overall, Vitamins showed the largest growth of any product type (up nearly 22% in H1 2020) and at least 40 different product types saw a year over year increase in coupons dropped.
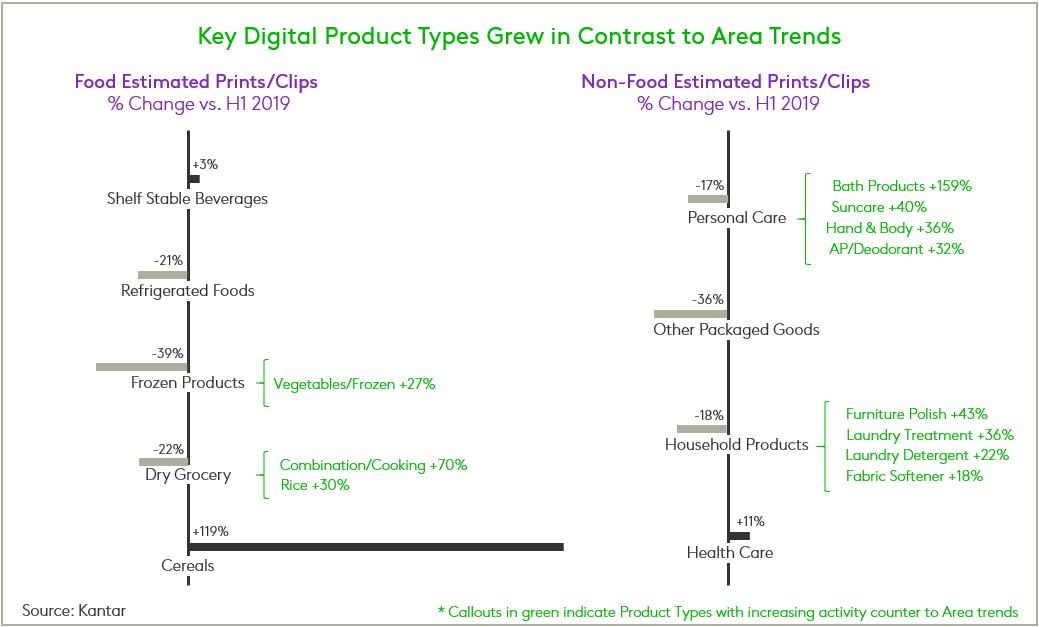
For the first time, Kantar measured a year over year decrease in Digital estimated clips/prints of 16.8%, driven by Dry Grocery, Refrigerated Foods and Personal Care. However, many key product types are still growing counter to trend – while Personal Care saw a 15.8% decline in estimated clips/prints, Digital promotion activity for Bath Products more than doubled in H1 2020. Over 35 product types increased estimated prints/clips crossing 7 of 9 areas.
What’s It Worth?
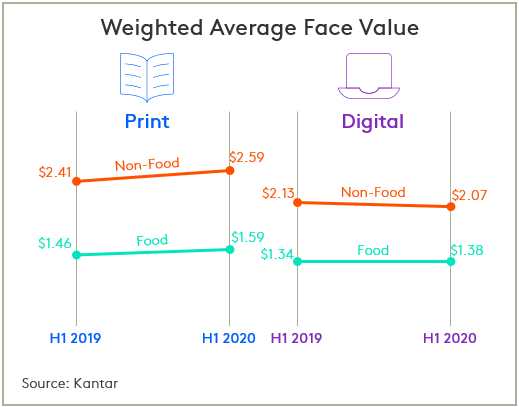
An indicator of continuing 2019 trends is the average face value of the promotions distributed to consumers. In Print and Digital Food and Print Non-Food, Weighted Average Face Values and Weighted Average Unit Values continued to increase.
In H1 2020 Kantar reports that the largest face value increases were in Print where Non-Food manufacturers increased their face values $0.18 to $2.59 on average. Driving this trend was Health Care where Print face values rose $0.09 from $3.11 to $3.20 and unit values rose $0.04 from $3.08 to $3.12. Household Products (+$0.20), Personal Care (+$0.19) and Dry Grocery (+$0.19) saw the largest year over year increases in Print face value.
In Digital, Food face values increased $0.04 to $1.09 and Non-Food face values, while higher overall, decreased $0.10 to $1.82. There were areas of growth in both Food and Non-Food, however, as the biggest incentive increases came from Shelf-Stable Beverages (+$0.28 face value and +$0.20 unit value) and Health Care (+$0.26 face value and +$0.18 unit value).
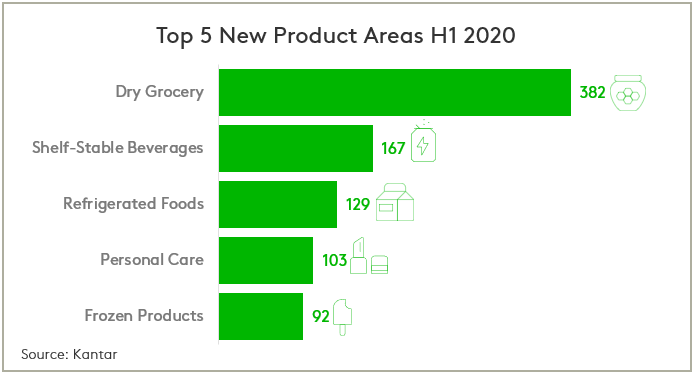
New Product Support
So far in 2020, Kantar has captured nearly 1,100 new products in Print and Digital with Dry Grocery leading all other areas in total number of new products launched by a wide margin. Over 350 of these new Dry Grocery products were first seen in Digital, where manufacturers have increasingly turned to promote their new products. While Food dominates the number of new products in Digital, Health Care was the only area to see a year over year increase – up 13% to 45 new products.
In Print, Kantar measured a decrease in the number of events that manufacturers ran in support of their new products, with an average of 1.3 events per new product in Food (-28%) and 1.7 events per new product in Non-Food (-6%). Cereal had the highest average number of events per new product of any product type at 2.0 events, followed by Health Care and Personal Care both at 1.8 events.
However, in Digital, the average number of events per new product increased to 2.7 events in Non-Food (+35%) and 2.2 events per new product in Food (+10%). Cereal again had the highest average number of events per new product, increasing nearly 154% and supporting new products with an average of 7.1 events. In H1 2020, Health Care (3.4 events) and Household Products (2.9 events) also showed an above average number of events per new product.
To learn more about the data behind this article and what Kantar Media has to offer, visit https://www.kantarmedia.com/us.


Sign up to receive our stories in your inbox.
Data is changing the speed of business. Investors, Corporations, and Governments are buying new, differentiated data to gain visibility make better decisions. Don't fall behind. Let us help.


Sign up to receive our stories in your inbox.
Data is changing the speed of business. Investors, Corporations, and Governments are buying new, differentiated data to gain visibility make better decisions. Don't fall behind. Let us help.