
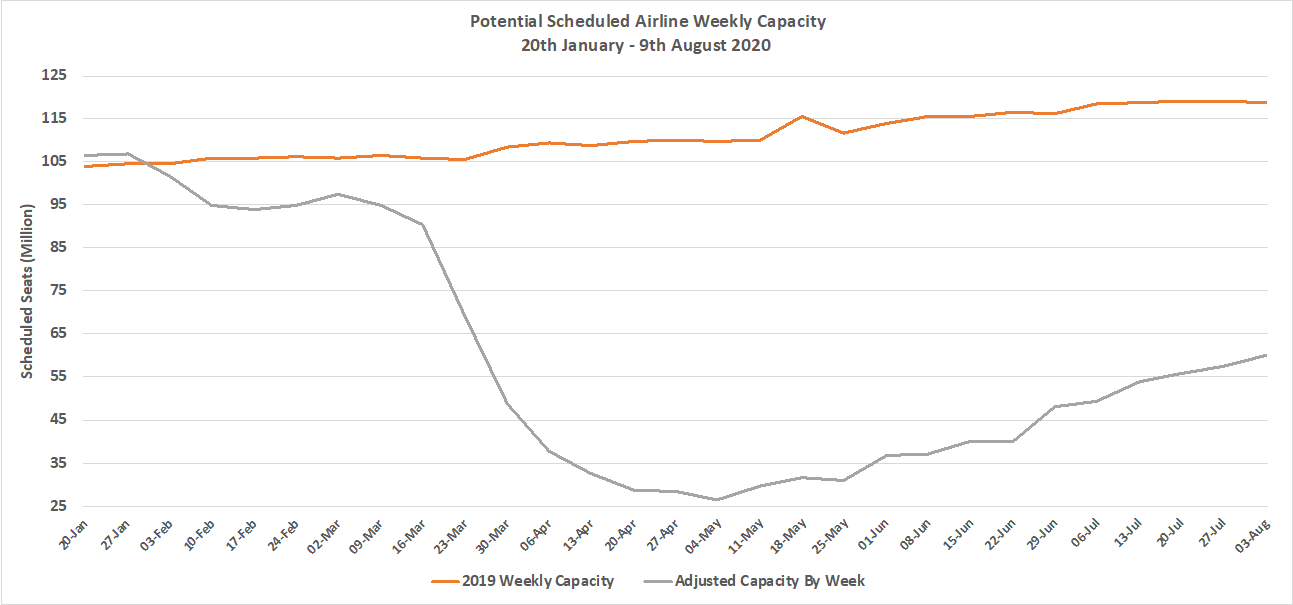
With one of the world’s largest airlines making nearly 800 schedule changes in one day and at the same time having to release over 17,000 dedicated employees, the challenges of running a scheduled airline are not getting easier. Global capacity has crept up to 60 million seats this week; some 4% up on last week and breaking through the halfway point to recovery; well at 50.4% of last year’s capacity it’s a positive statement!
There are undoubtedly some markets where capacity is returning to previous year levels and others where further growth remains out of reach pending lockdowns being eased but with demand continuing to lag the outlook remains worrying from so many angles for both the industry and wider travel sector.
Chart 1 – Scheduled Airline Capacity by Week Compared to Schedules Filed on 20th January 2020 & Previous Year
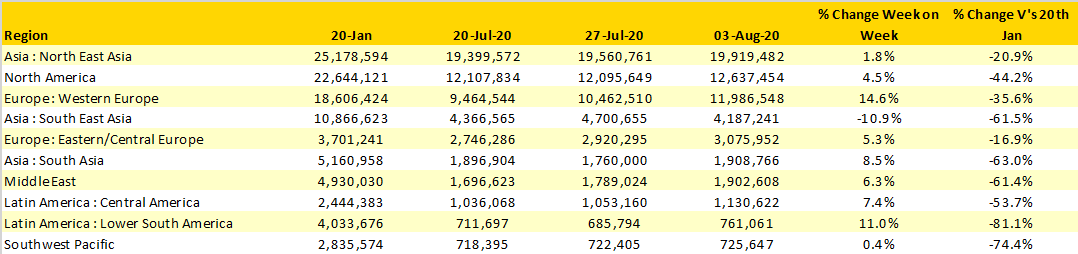
There is increasing evidence of a two speed recovery process across regions with North East Asia, Central/Eastern Europe and Western Europe all with more than 60% of the capacity reported in mid-January when we first started reporting on the Covid-19 event. At the same time regions such as Lower South America continue to see less than 20% of their base capacity whilst Upper South America has less than 13% of its January levels.
Capacity continues to grow in regional markets with Western Europe leading the way in terms of week on week growth with a near 15% increase and some 1.5 million seats added; continuing concern around new lockdowns and quarantines are probably still being considered by airlines and it may be that some reductions in capacity will follow for next week. However, if that level of growth did continue into next week’s data then Western Europe would leapfrog North America into second place.
Only one of the top ten regional markets reported a decline week on week; South East Asia where capacity fell by nearly 11% as some country markets responded to spikes in reported Covid-19 cases and some airlines adjusted capacity in response to current demand levels.
Table 1 - Scheduled Airline Capacity by Region, 20th Jan – 3rd August 2020
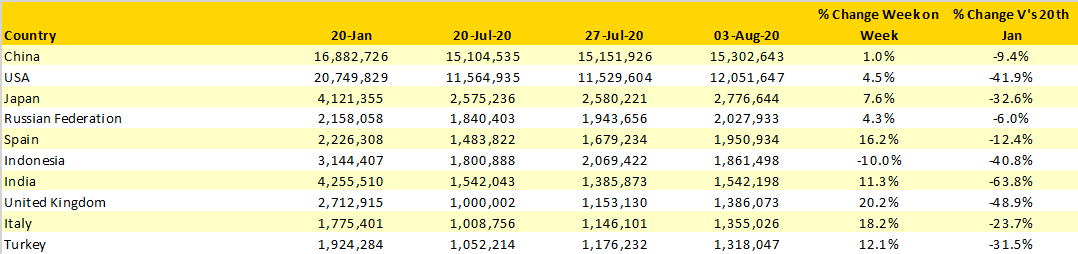
The United Kingdom reported the largest weekly capacity increase amongst the top ten countries with a near 20% increase and some 230,000 additional seats added. Easyjet added a further 115,000 seats to their network of which 20,000 were to Spain (that may now be changing!) and both Greece and France had seen a further 12,000 seats added.
China continues to be the largest country market with over 15 million seats a week and is now at over 90% of the base point in January. Domestic capacity is now at 15.1 million seats a week compared to 14.7 million at the beginning of the year and with 99% of all current Chinese capacity being purely operated on domestic services, the importance of those additional 1.6 million international seats per week is probably more pressing for overseas carriers than locally based airlines.
Table 2 - Scheduled Capacity, , Top 10 Countries Markets
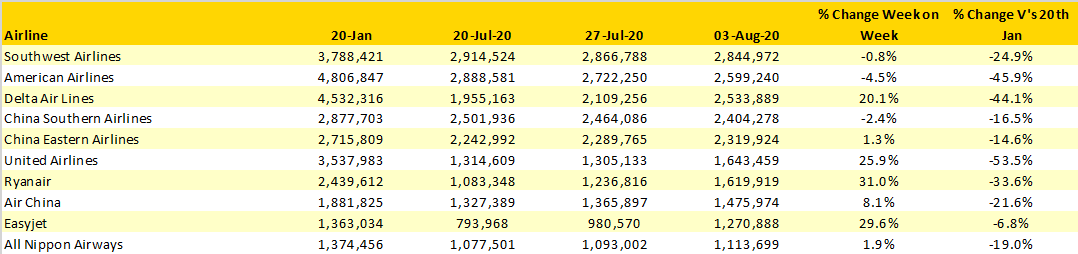
Different approaches to capacity management are clearly taking place across the Big Three US airlines; both Delta Air Lines and United have added back considerable capacity week on week whilst American Airlines have scaled back. It’s fascinating to watch how these three airlines are moving and adjusting capacity and it would be interesting to know how much of those capacity changes are demand related compared to responding to competitive capacity changes.
Amongst the top ten airlines Easyjet are now the closest to their January levels of capacity, just some 7% adrift although January is traditionally one of the lowest months for production for the airline.
Table 3 – Scheduled Capacity - Top 10 Airlines
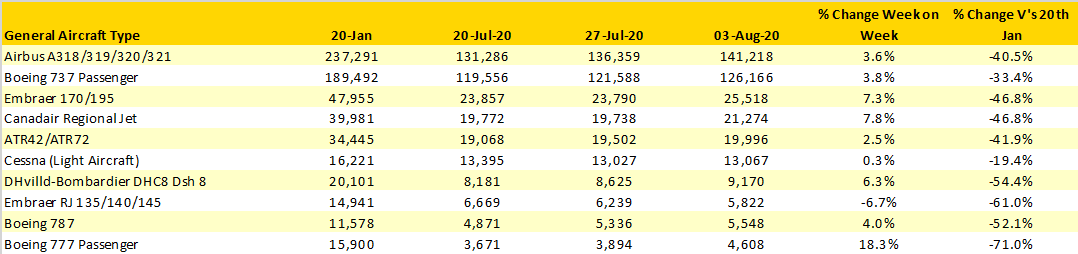
With airlines continuing to announce further early retirements amongst their fleets and the obvious focus on longer haul aircraft types, we’ve taken a quick look at the number of scheduled flights this week by the more popular aircraft types. Not surprisingly the medium range single aisle Airbus and Boeing aircraft dominate and while there are more Airbus scheduled services this week the Boeing 737 continues to recover faster than its major competitor. And on an optimistic note while the B777 is only operating at some 29% of its January levels, scheduled operations have increased by nearly 18% this week. For those interested the A380 is scheduled to operate some 64 flights this week, in mid-January the schedule was for some 2,205; just 3% of January’s planned services.
Table 4 - Scheduled Flights by Generic Aircraft Type
So, as we enter the height of the summer season some 638 scheduled airlines are operating; the same week last year 716 operated and given the market conditions and outlook for the coming months it is likely that many of those will be probably not be operating again in the near future.
For many airlines August is their busiest month at least from a volume perspective; average yields are typically lower than some months as the mix of traffic and particularly business demand is at its lowest point. For many airlines, current capacity levels and lagging demand suggest that cash reserves will not see any noticeable improvement in the next few months and with the winter season approaching faster than any recovery that’s something every airline, airport and tourism CEO will be pondering if they are indeed on the beach!
To learn more about the data behind this article and what OAG has to offer, visit https://www.oag.com/.


Sign up to receive our stories in your inbox.
Data is changing the speed of business. Investors, Corporations, and Governments are buying new, differentiated data to gain visibility make better decisions. Don't fall behind. Let us help.


Sign up to receive our stories in your inbox.
Data is changing the speed of business. Investors, Corporations, and Governments are buying new, differentiated data to gain visibility make better decisions. Don't fall behind. Let us help.