
For the past several months, we’ve been sharing how COVID-19 is affecting foot traffic to a variety of places (part 1 here, part 2 here, part 3 here, part 4 here, part 5 here and part 6 here).
Our biggest observation this week? People are feeling the itch to get back to the real world. As officials begin the process of relaxing some business restrictions, we’re starting to see upticks in foot traffic to various places. This is true across regions, regardless of state-specific policies. For some categories, the last week has produced the most substantial changes since foot traffic bottomed out around the end of March. Most notably:
In the analysis below, we study foot traffic trends at various locations across the country since the outbreak began, through Friday April 24. We share where consumer behavior is going back to normal, where people are still going more than usual, and where people are still going less than usual.
Over the next several weeks, as more states begin testing relaxed restrictions, we are committed to keeping you informed about what consumer and business recovery looks like. Our data scientists will look to answer questions like:
We use indexed foot traffic to demonstrate the relative decline in visits to different types of places, where visits on the first day are 100. We analyze data on a rolling 7-day basis to reduce the effects of foot traffic trends influenced by certain days of the week (for example, bars and clubs experience an uptick on Fridays and Saturdays).
So, to explain this in an example, an 81 index to airports for March 6 indicates that foot traffic between February 29 - March 6 (a 7-day rolling period) is 19% lower than the first 7 days of analysis, February 13 - February 19.
We used February 13 - February 19 as the first 7-day period benchmark for analysis because February 19 is when we last estimated foot traffic to be roughly normal for the categories analyzed. You’ll see us reference this period as “the week ending February 19.”
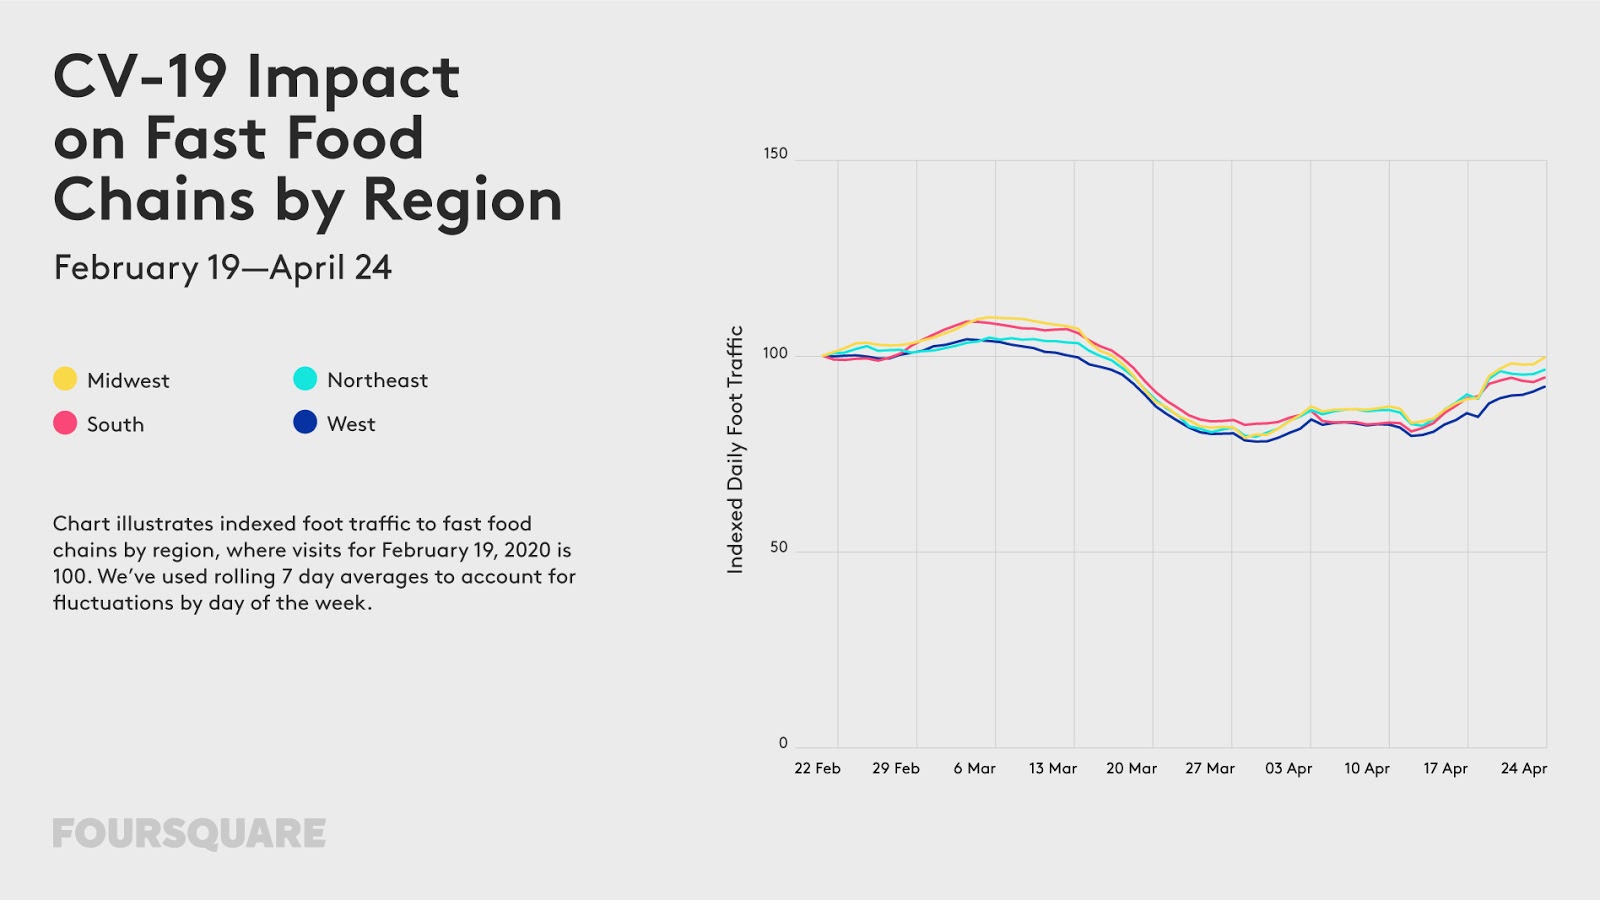
• Fast Food Is On It’s Way Back - Foot traffic to quick service restaurants (QSRs) has risen over the past several weeks, with traffic down only 5% nationally as of April 24. Fast food visits are back to pre-COVID levels in the Midwest, as well as in rural areas across the United States. While fast food visits are still slightly down in the West, South and Northeast, visits are down only 4-8% compared to before the pandemic.
In order to get a deeper understanding of consumer behavior around fast food restaurants since COVID-19, we examined QSR visitation amongst different demographics. Location data shows that men have been quicker to return to fast food restaurants than women, with QSR traffic from men down only 4% as of April 24 (whereas traffic from women was down 8%). While fast food visits have increased across age groups in recent weeks, visits are up most amongst people 35-65 years old, and slightly less amongst people under 34 and people over 65 years old.
Recent fast food fans will keep coming back. According to a survey of consumers in Foursquare’s always-on panel in April 2020, more than one third of fast food visitors said they planned to visit that restaurant again within the next week, and more than 77% planned to return within the next month.
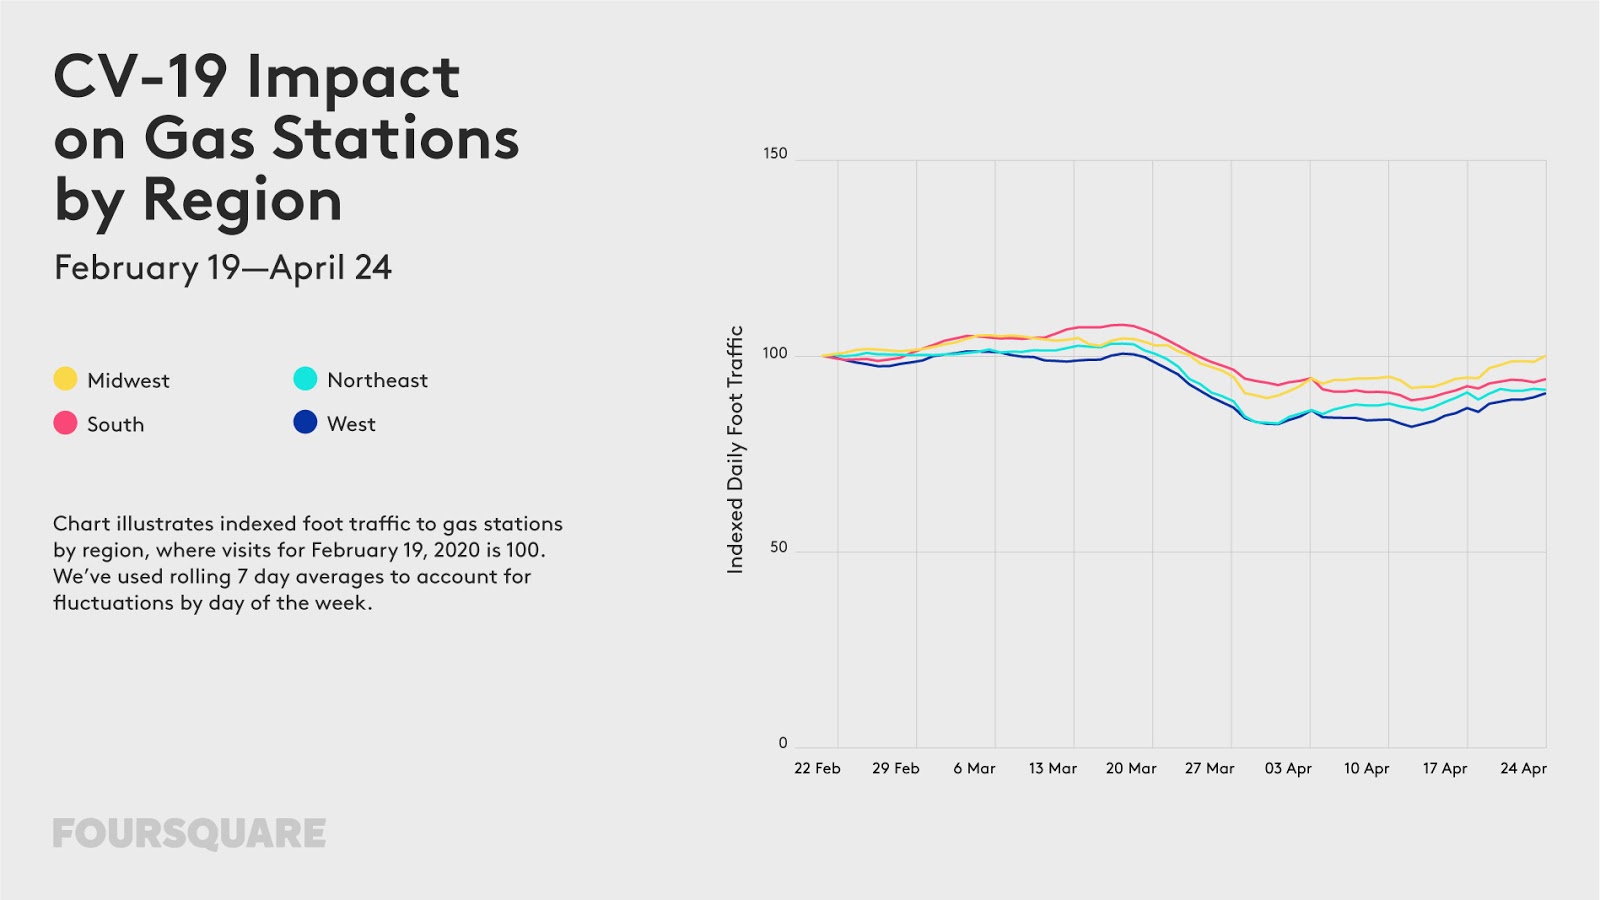
• Hitting The Road Again - Gas station visits have increased slightly since mid-April, down only 6% nationally as of April 24 (versus 8-11% in the weeks prior). Gas station traffic has returned to pre-COVID-19 levels in the Midwest, and in rural areas throughout the country. While gas station visits are still slightly down in other regions and in suburban and urban areas, visits have increased slightly across the board since mid-April.
Men have been the driving force behind the uptick in visits to gas stations. Visits were nearly back to pre-COVID-19 levels amongst men as of April 24 (down only 3%), whereas visits were still down 13% amongst women. Analyzing foot traffic to gas stations by age cohort, we see that gas station visits have risen most amongst consumers 45-64 years old.
Recent gas station visitors will keep coming back. According to a survey of consumers in Foursquare’s always-on panel in April 2020, 54% of gas station visitors said they planned to visit that station again within the next week, and nearly 90% planned to return within the next month.
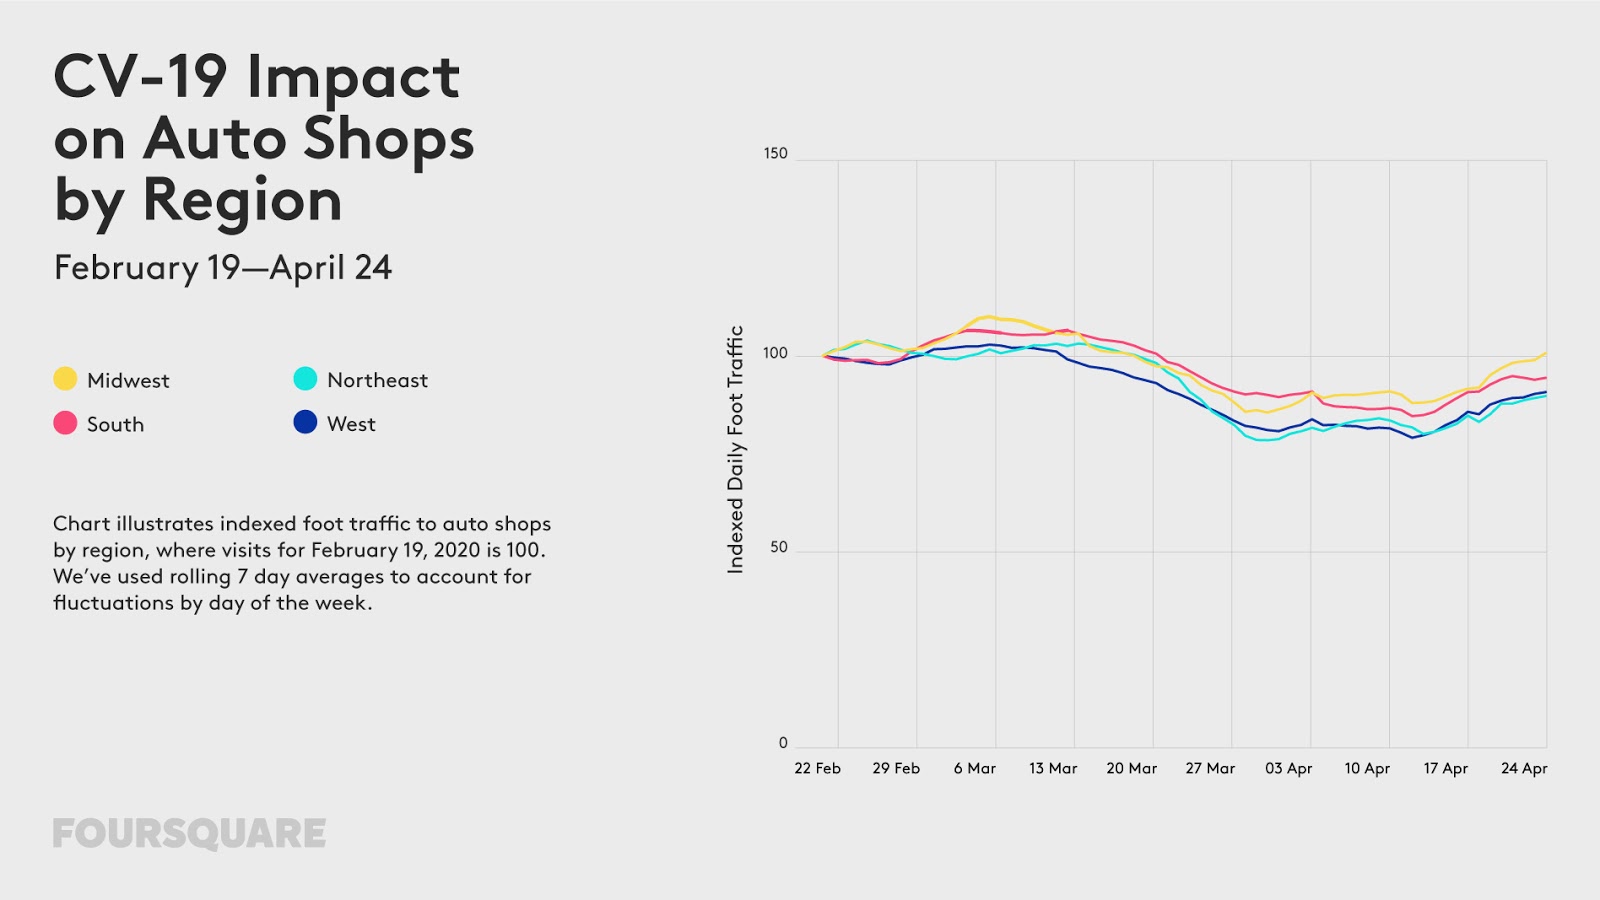
Visits to automotive shops have also steadily increased since mid-April, down only 6% nationally as of April 24 (versus 10-17% in the weeks prior). Auto shop traffic has returned to pre-COVID-19 levels in the Midwest, with smaller upticks in the Northeast and West. Visits are actually slightly up in rural areas (5%), but are still down in urban and suburban areas (down 16% and 12% respectively).
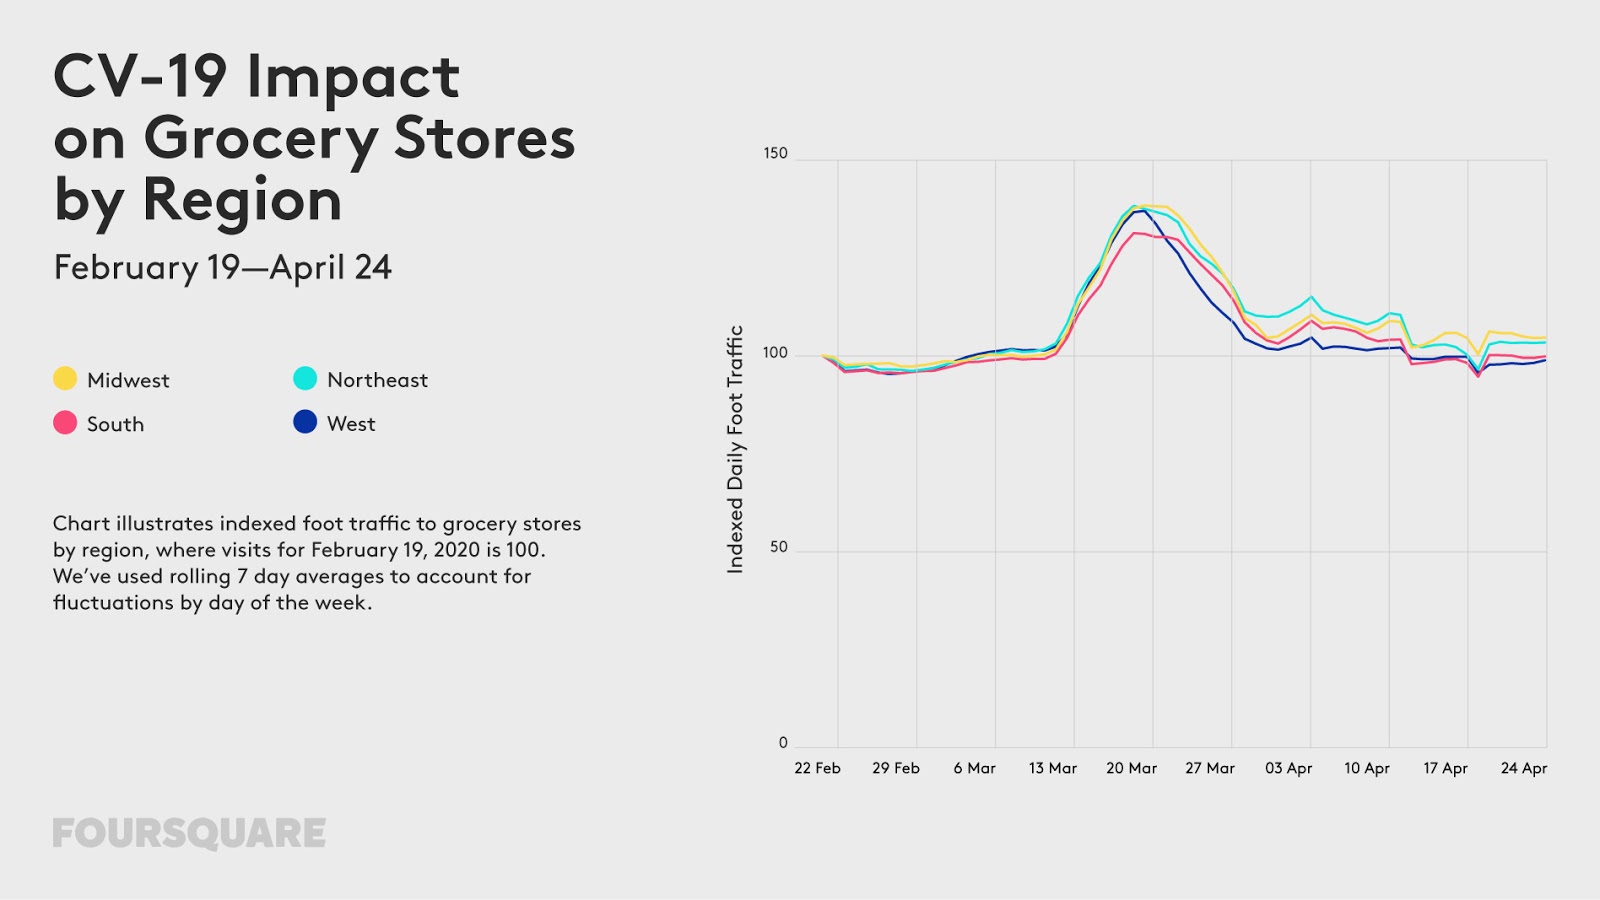
• Stocking Up - Surges in foot traffic to essential businesses where consumers buy food, drinks and household supplies were most prevalent in early to mid-March, when consumers were in panic mode. This surge behavior settled down by around March 23, as social distancing became the norm. In most cases, foot traffic has since returned to roughly normal levels.
For example, foot traffic to grocery stores returned to pre-COVID-19 levels around the week ending April 12. Analyzing by region, we see that grocery store visits are slightly up in the Midwest and Northeast, and roughly normal in the West and South as of April 24. While grocery store traffic is still slightly down in urban areas (down 6%), visits are up 8% in rural areas.
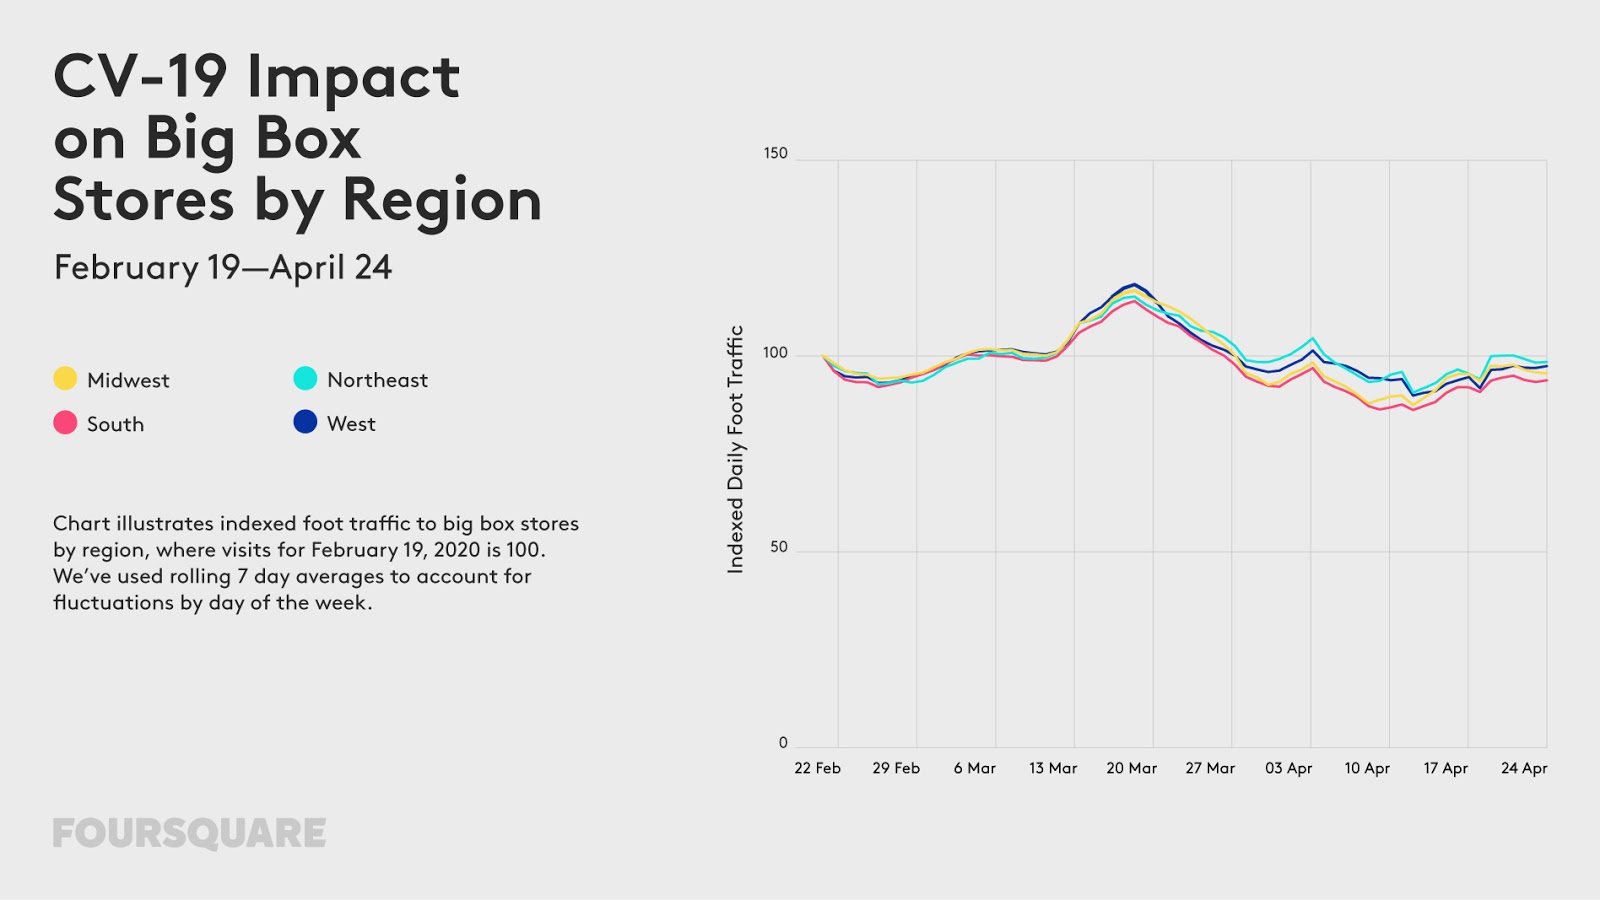
Visits to big box stores like Walmart and Target have increased since mid-April, down only 5% nationally as of the week ending April 24 (versus 7-11% in the weeks prior). Analyzing by region, we see that big box visits are only down 2% in the Northeast, but are still down 6% in the South. Big box visits are down only 3% in rural areas, while still down 8% in urban areas. Examining visitation by age cohort, we see that big box store visits are back to roughly normal amongst consumers 45-64 years old (down only 3-4%).
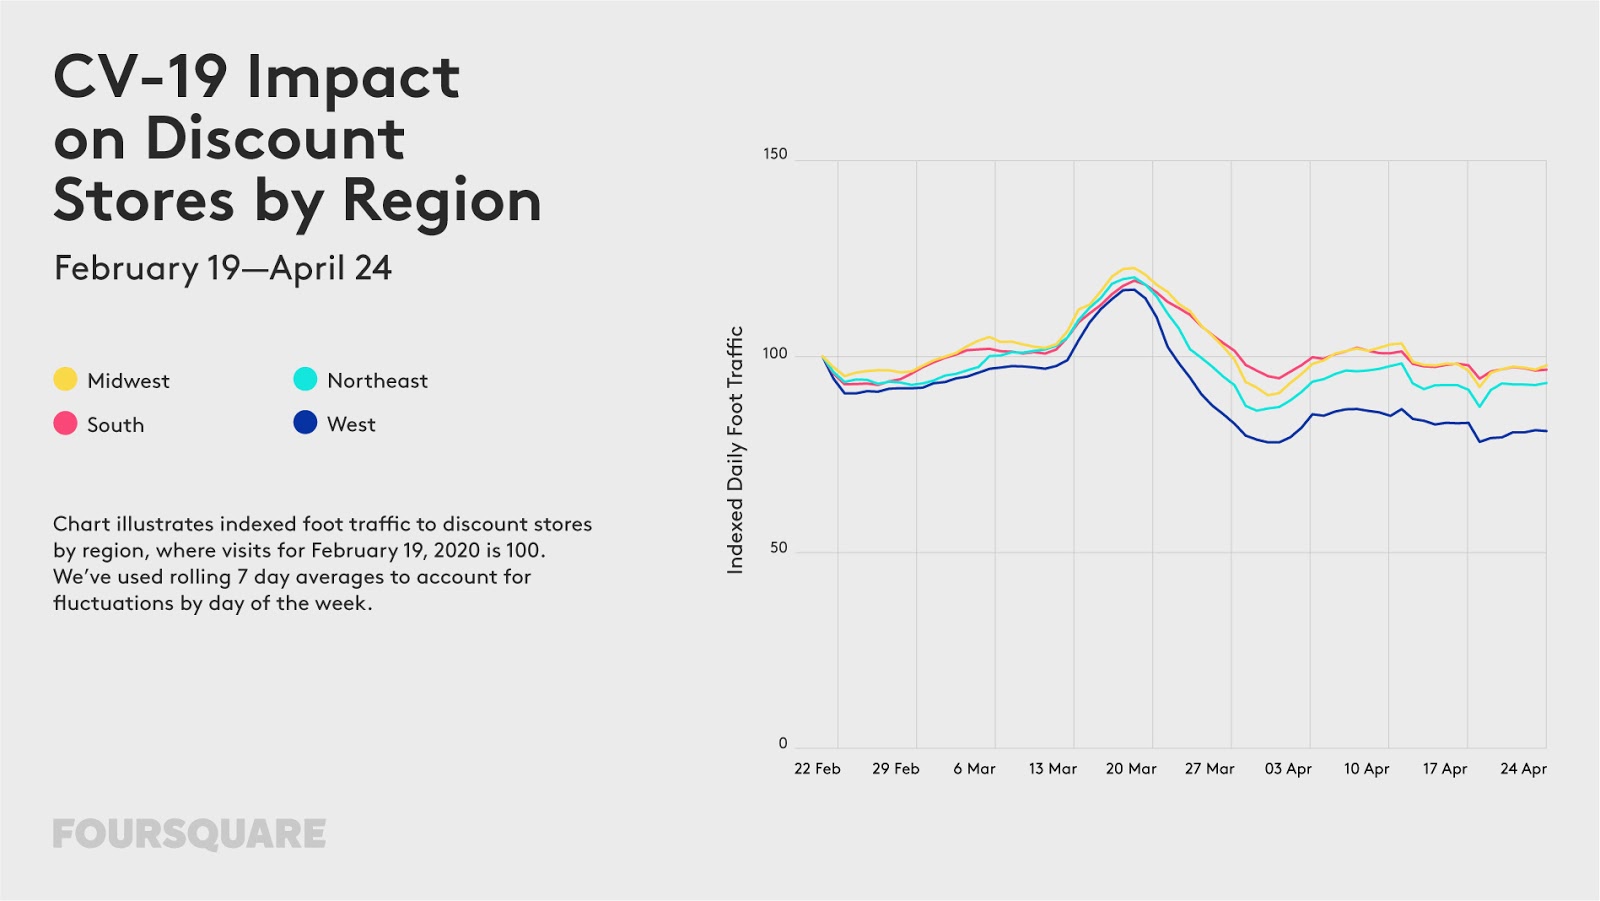
Traffic to discount stores like Dollar General and Dollar Tree has been fairly stable nationally for the past several weeks, down 7% as of April 24. Analyzing by region, we see that visits are down more in the West, while visits have returned to more normal levels in the South and Midwest.
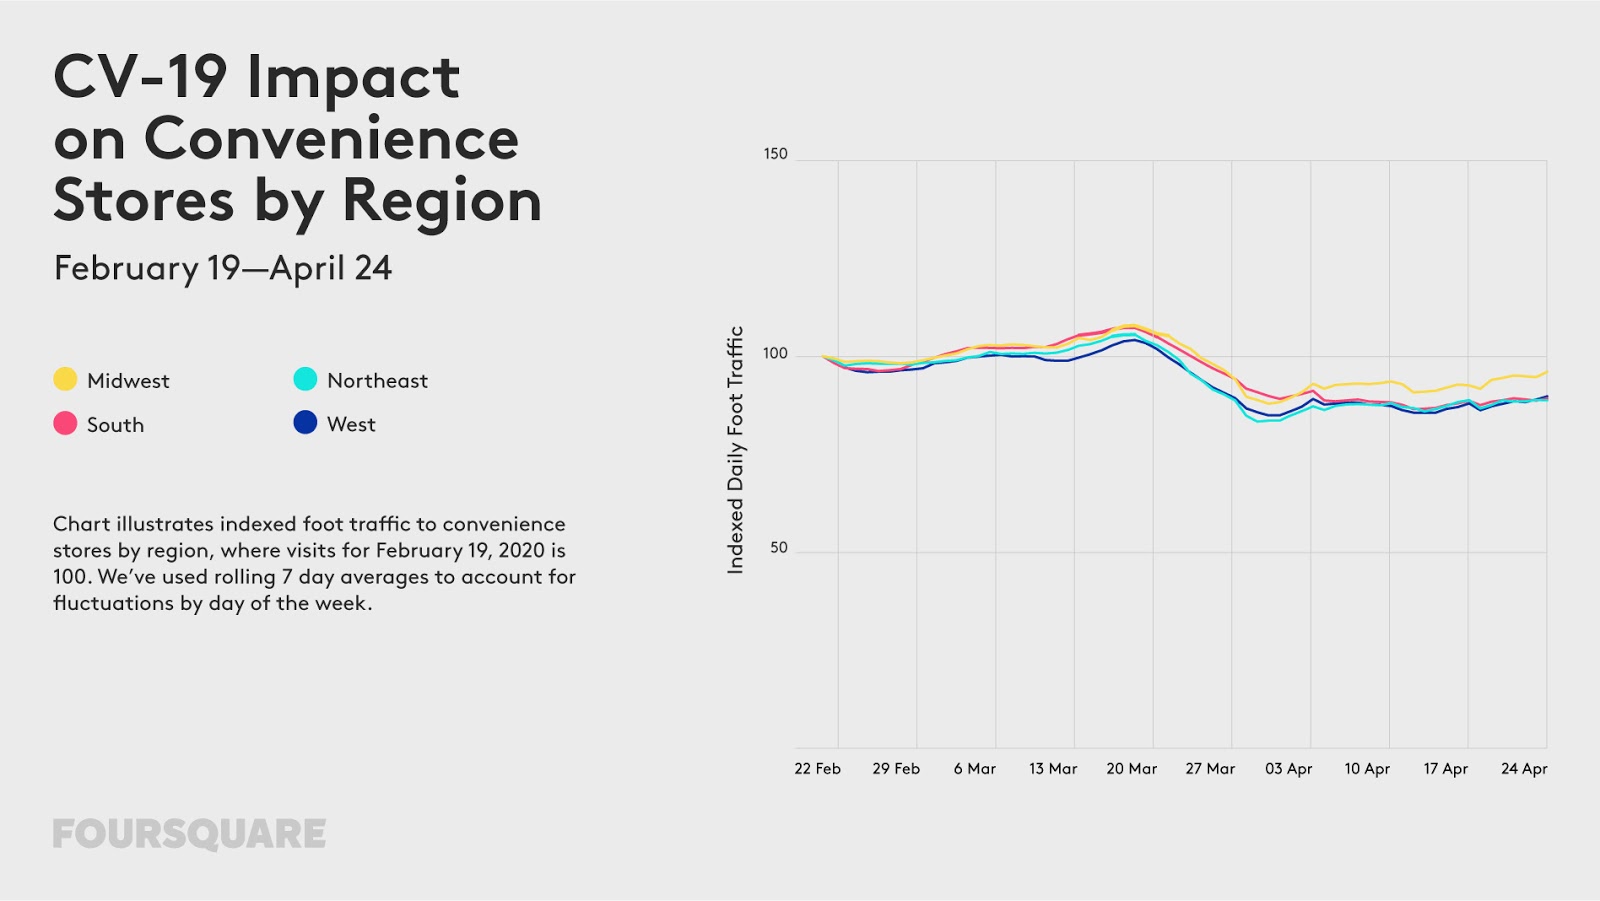
Convenience store visits have increased very slightly since mid-April, down only 10% nationally as of April 24 (versus 12-13% in the weeks prior). People in the Midwest in particular are visiting convenience stores more in recent weeks. Convenience store traffic is back to roughly normal in rural areas (down only 3%), while still down 13-15% in suburban and urban areas. Examining visitation by age cohort, we see that convenience store visits are up most amongst consumers 45-64 years old.
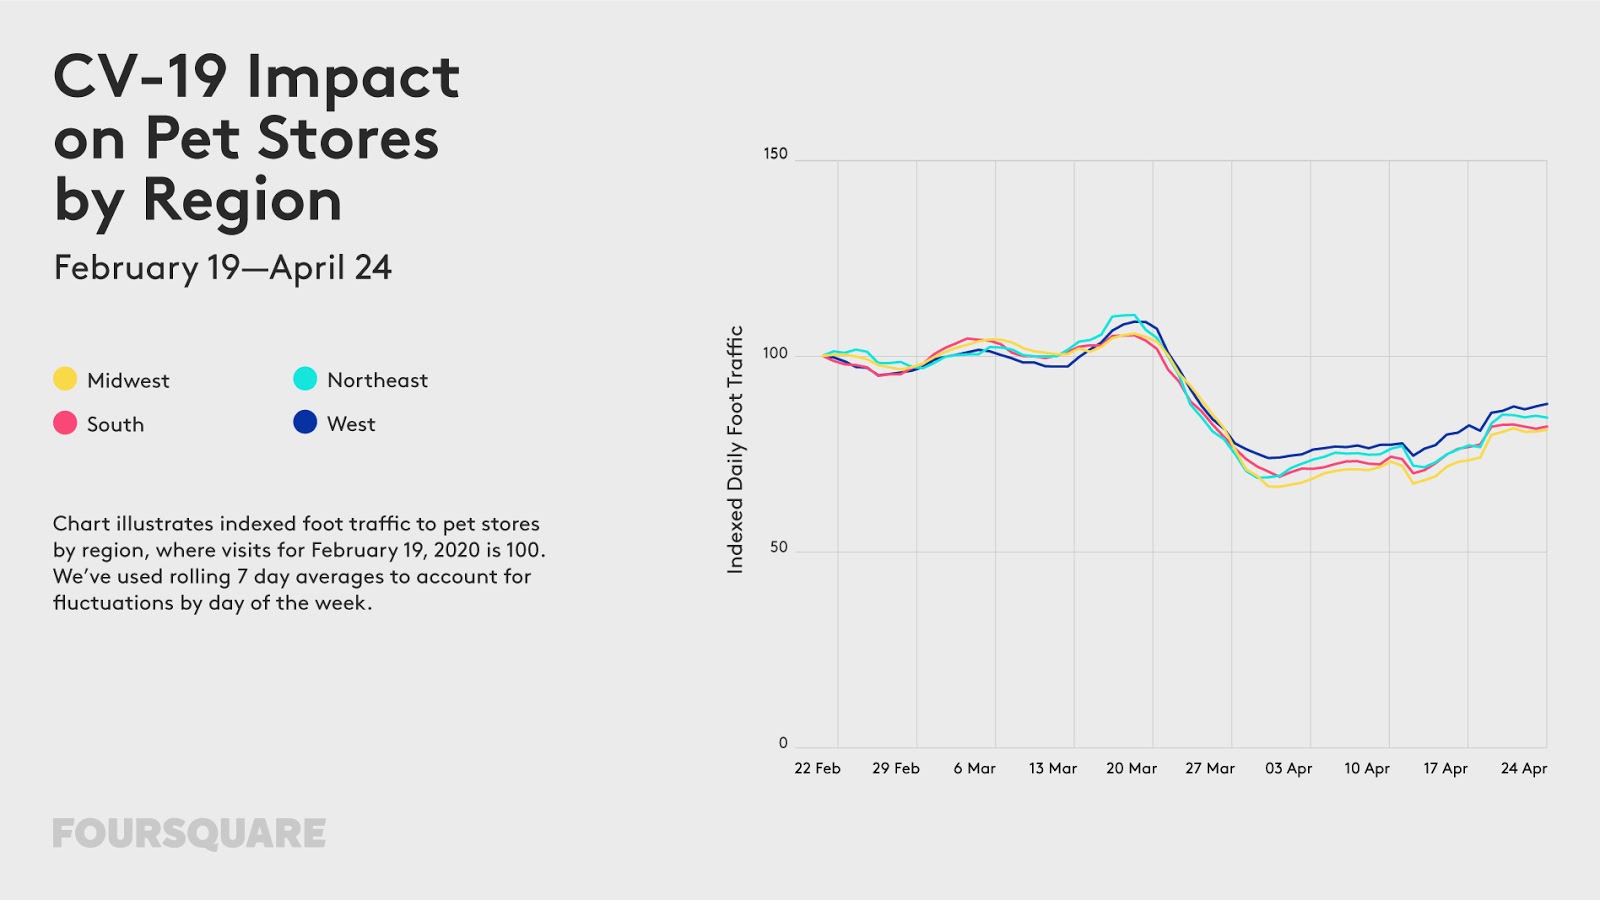
Foot traffic to pet stores like PetSmart and Petco has increased slightly since mid-April, down only 16% nationally as of April 24 (versus 23-29% in the weeks prior). Visits have increased more in the West, and less in the Midwest and South.
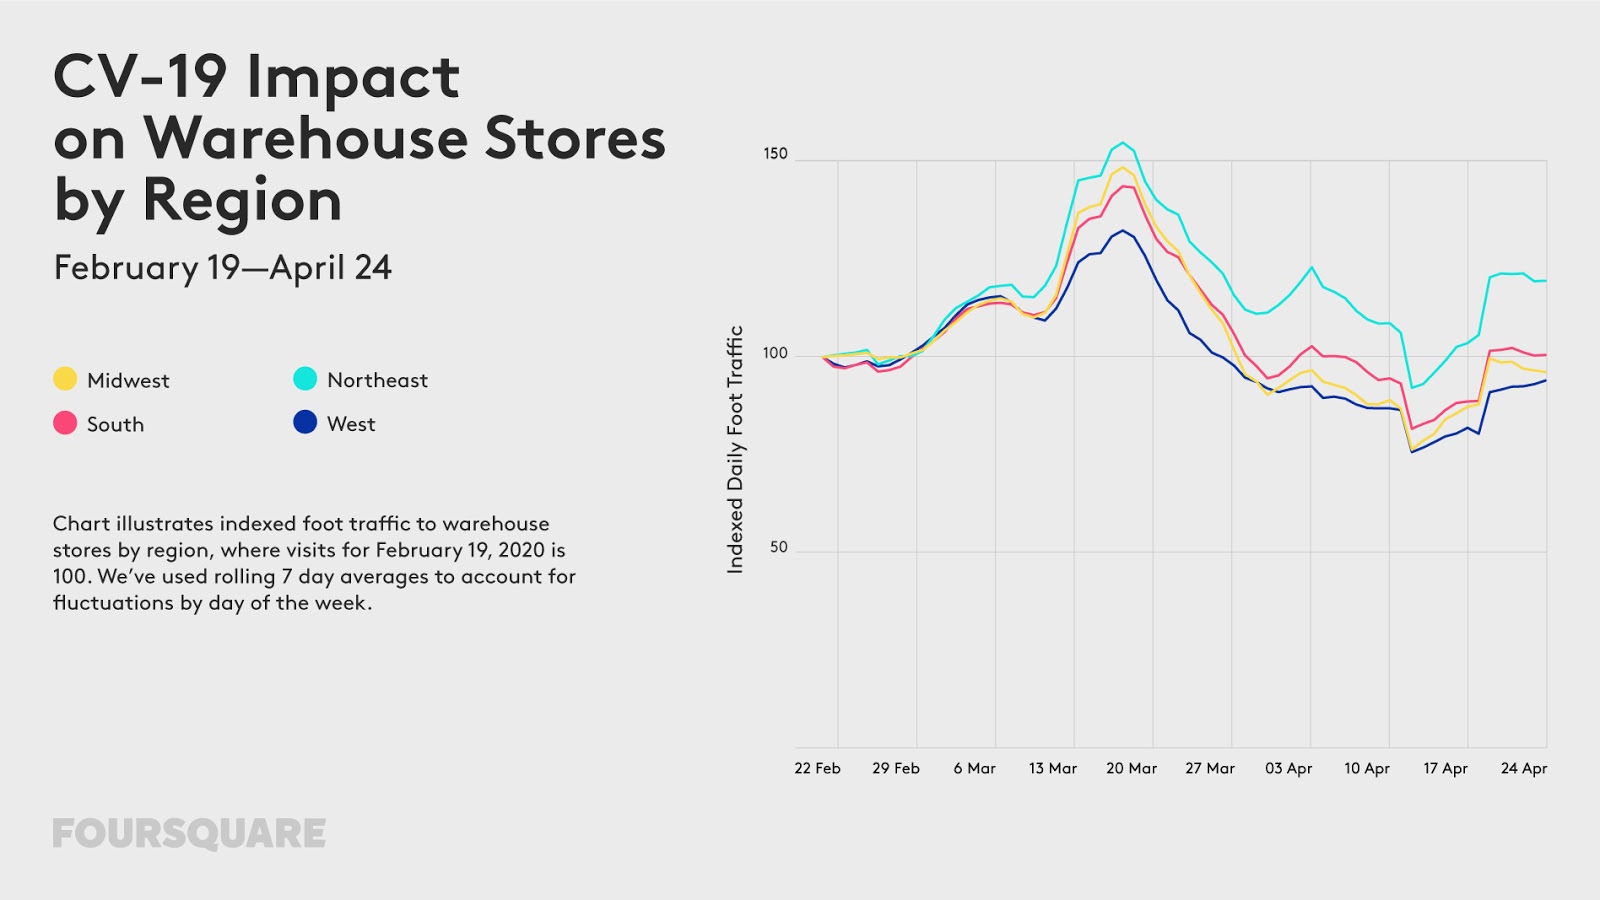
Foot traffic to warehouse stores nationally returned to pre-COVID-levels around April 19. However, when analyzing visitation by region, we see significant fluctuations. As of April 24, visits to warehouse stores are actually up 19% in the Northeast, but roughly normal in other regions.
Visits to certain types of places remain elevated, reflecting consumers’ desire to stay positively engaged during quarantine.
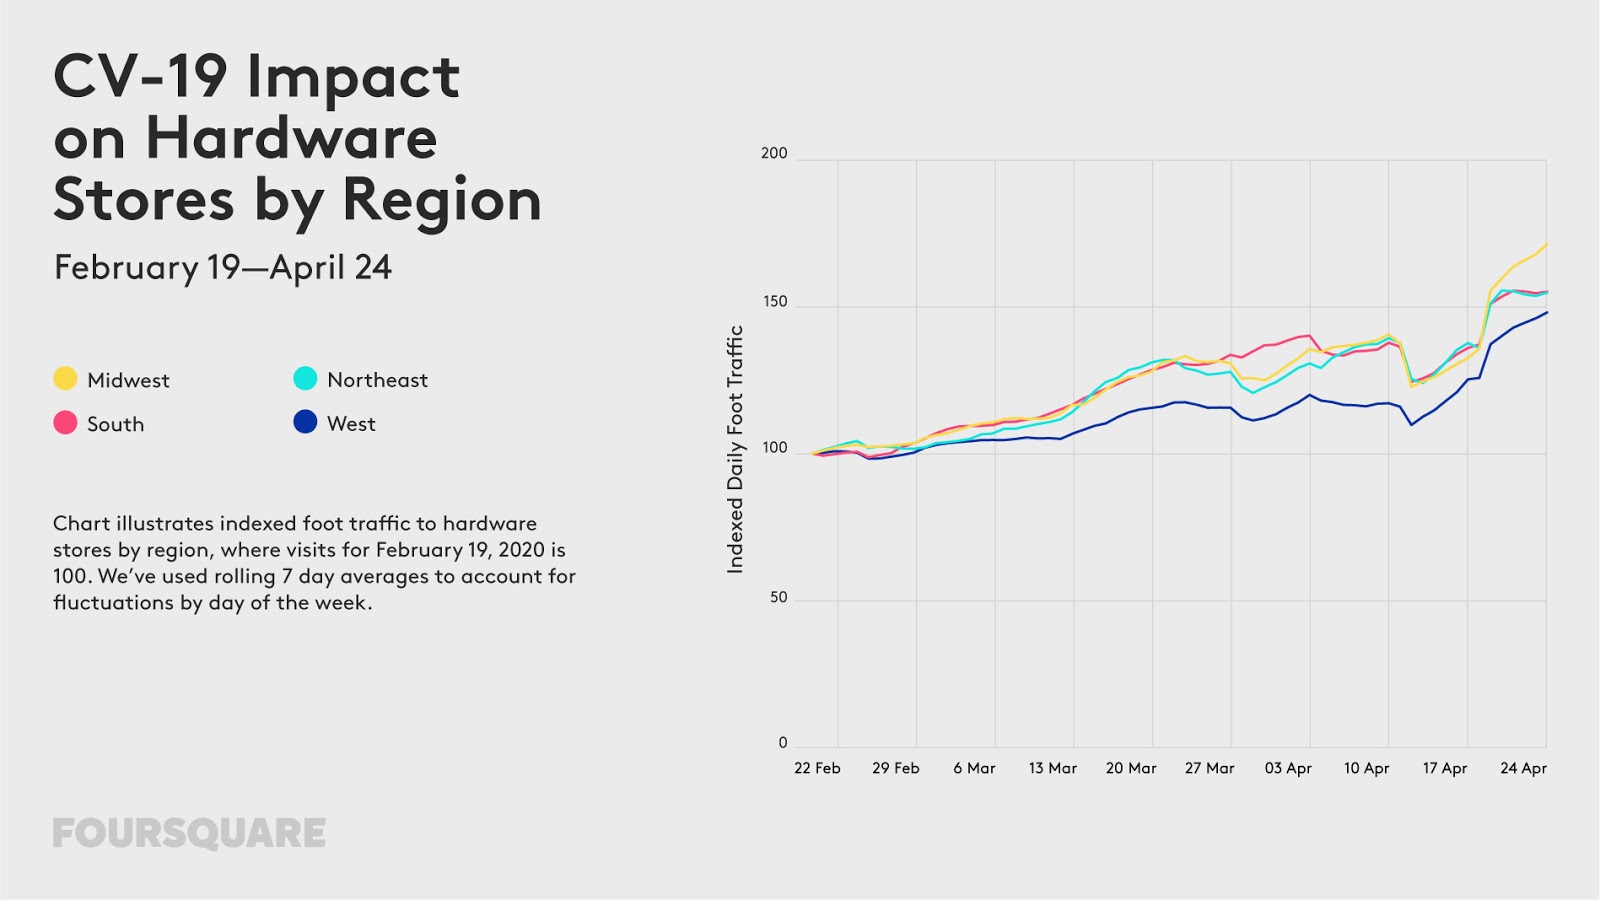
• Fixing Up The House - Foot traffic hardware stores like The Home Depot and Lowe’s have increased significantly in recent weeks, with visits up 56% as of April 24. While traffic is up across regions, hardware store visits are up most in the Midwest (71%) and Northeast (55%). Hardware store visits are up more in rural areas (67%) and less in rural areas (36%). While traffic to hardware stores has increased across age groups, younger people under 34 years old have caused particularly large upticks.
People are devoting their time and energy towards yard work and gardening. According to a survey of consumers in Foursquare’s always-on panel in April 2020, 26-28% of hardware store visitors bought lawn and garden products. They may also be painting the house, with 11-12% of hardware store visitors purchasing paint. Meanwhile, less than 4% of hardware store visitors reported purchasing personal protective equipment at the store.
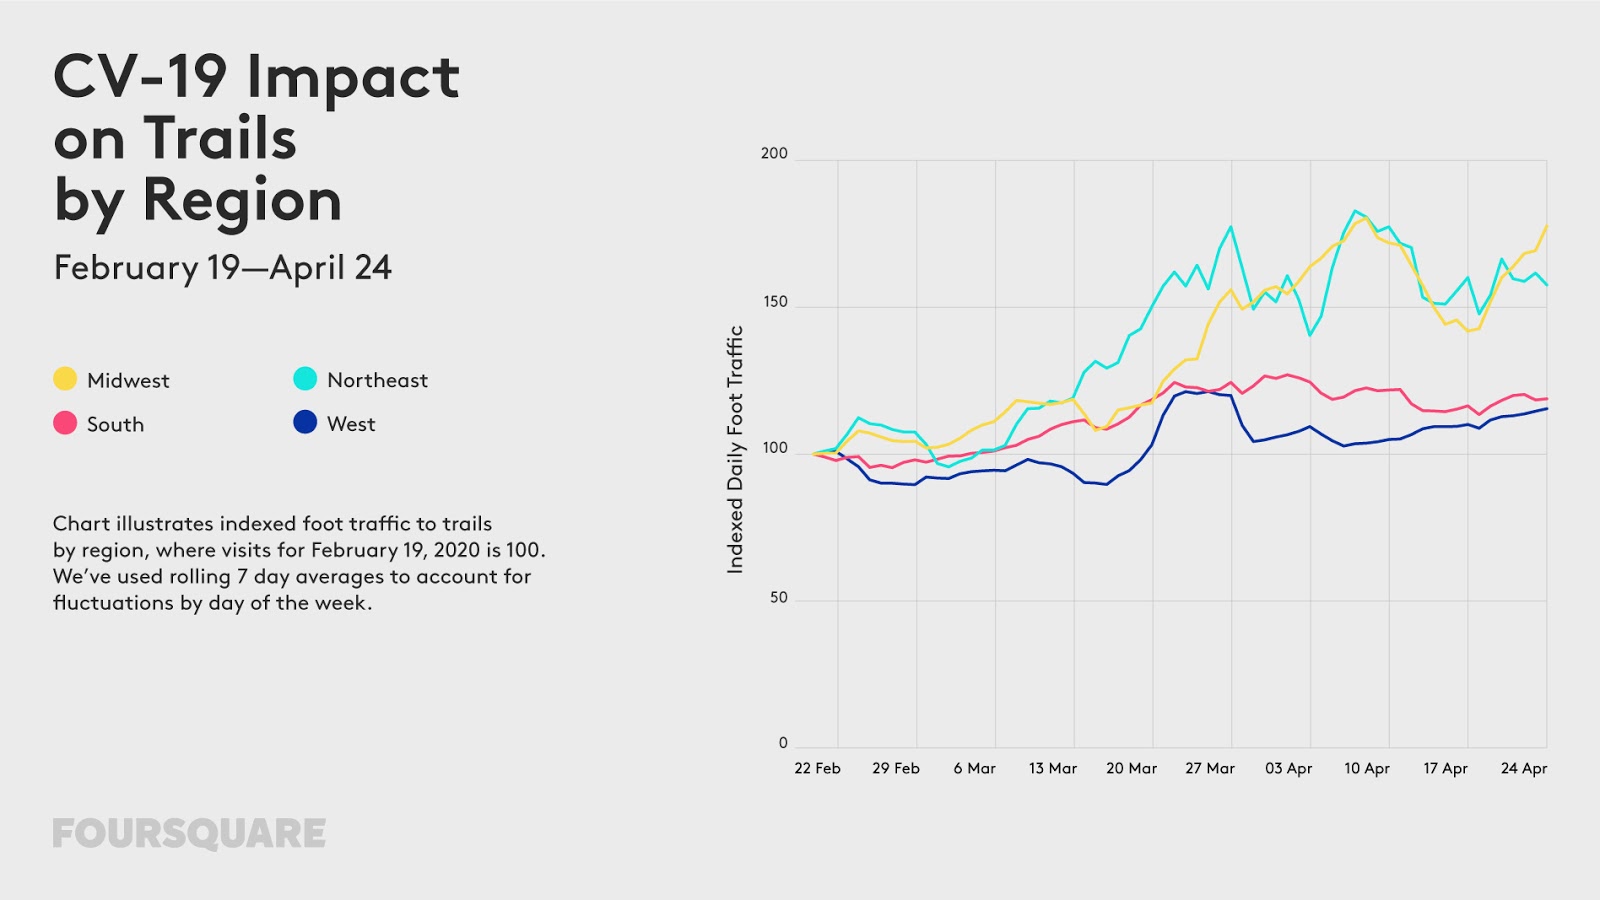
• Enjoying the Outdoors - Visits to hiking trails continue to rise, up 31% nationally from the week ending February 19 the week ending April 24. Trail traffic is up most in the Midwest (+77%) and Northeast (+57%). Although some of this is certainly due to seasonality, the growth in the last two weeks has been particularly notable.
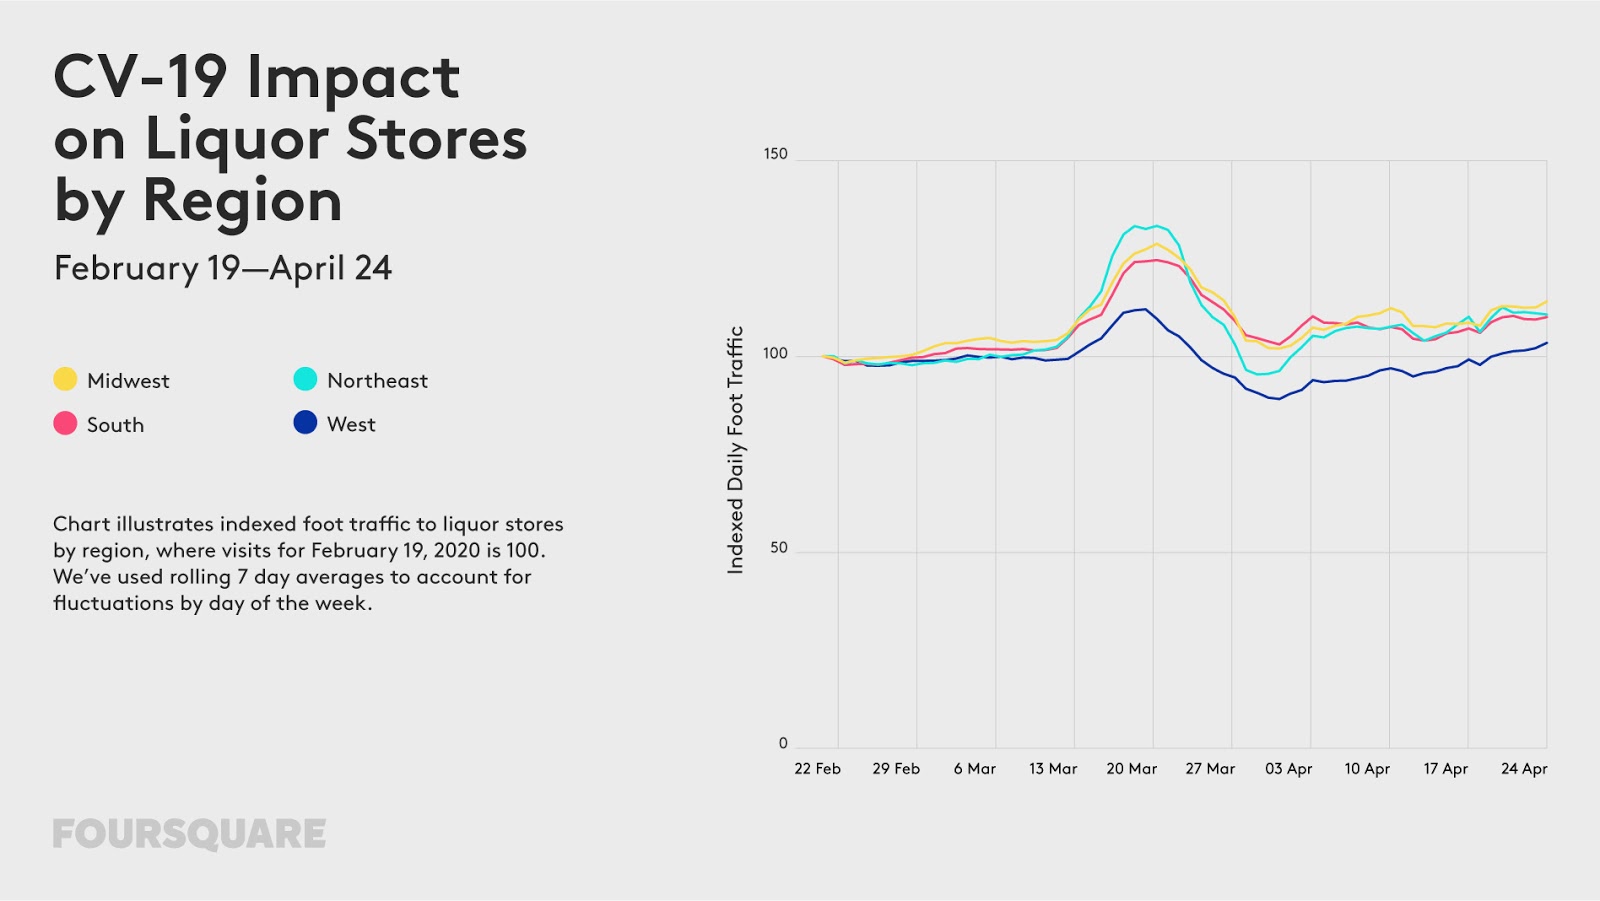
• Drinking at Home - Liquor store traffic remains above pre-COVID-19 levels, up 10% as of April 24. Visits to liquor stores are up less in the West, but even there, visits have risen above roughly normal levels. Liquor store visits are up more in rural areas (16%) and less in urban areas (4%).
Analyzing by demographics, we see that liquor store visits are up more amongst men (13%) than women (3%). Liquor store visits are up across age groups, but have seen the largest relative uptick amongst people 45-54 years old.
What Places Are People Still Visiting Less Than Usual?
Visits to non-essential businesses largely bottomed out around March 28-31 with remarkable synchrony, and have remained flat since.
• Avoiding Restaurants and Bars - Visits to restaurants and bars largely bottomed out around March 28-31. However, traffic has actually started recovering in small amounts in recent days.
For example, visits to casual dining chains have increased very slightly since mid-April, down 70% nationally as of April 24 (versus 72-73% in the weeks prior). Casual dining visits from men in particular have increased recently, with traffic down only 68% as of April 24.
Traffic to bars has also risen very slightly since mid-April, with visits down 54% nationally as of April 24 (versus 57-58% in the weeks prior). Bar visits from men in particular have increased recently, with traffic down only 48% as of April 24.

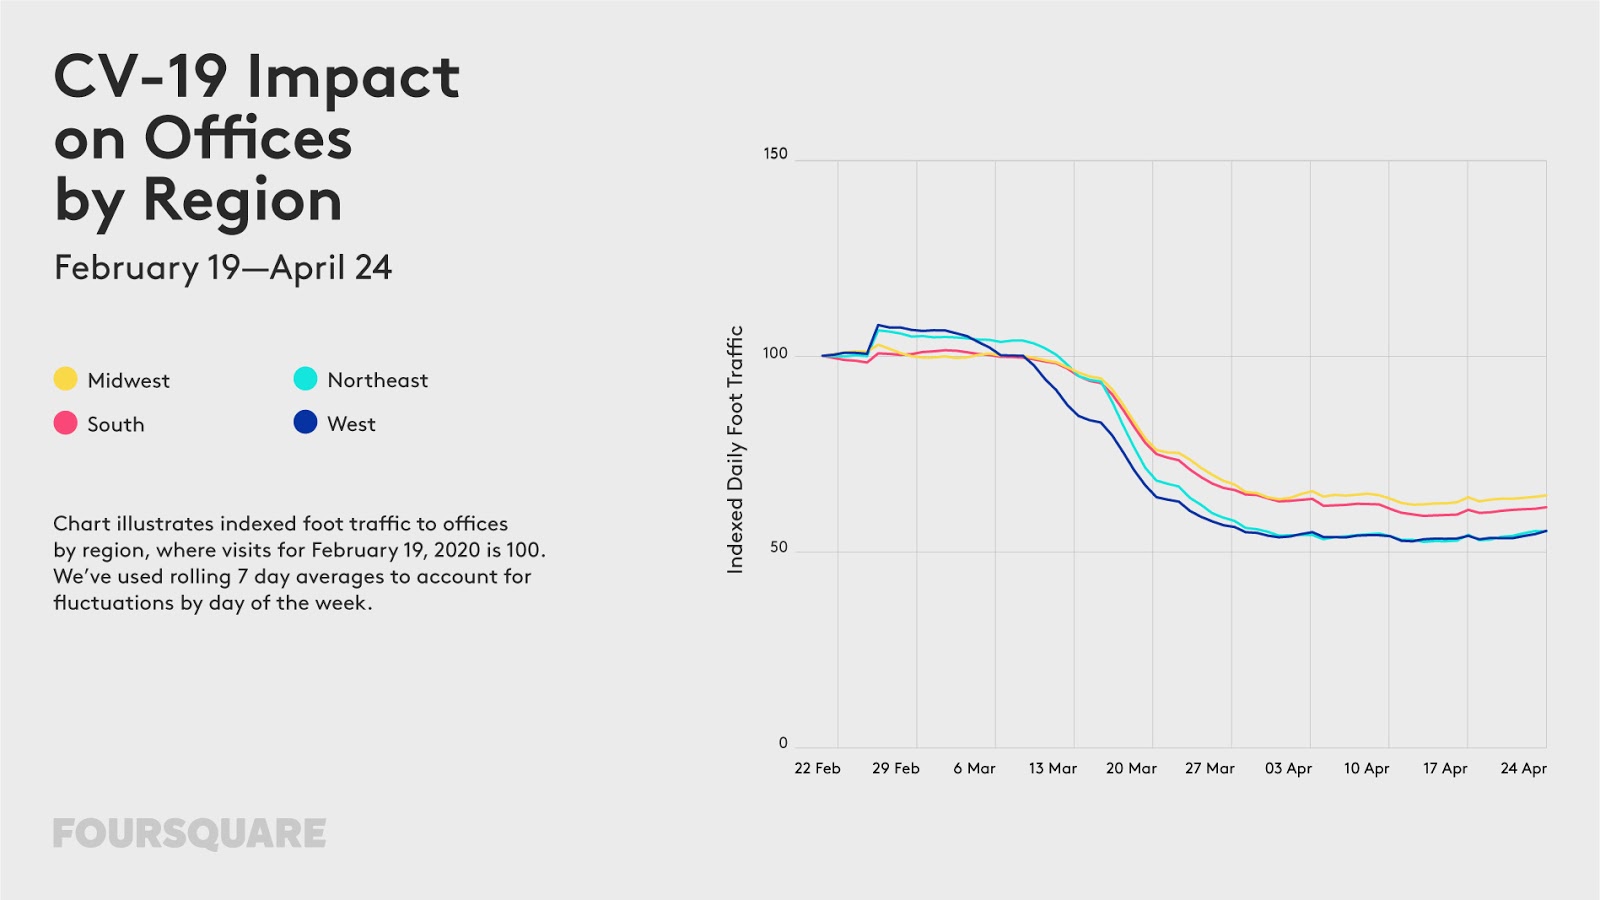
• Working From Home - Visits to offices have remained roughly stable since around April 1, down 40% nationally from the week ending February 19 to the week ending April 24. Office traffic has been down slightly more in the West and Northeast (down 45% in both regions) and relatively less in the South and Midwest (down 39% and 36% respectively).
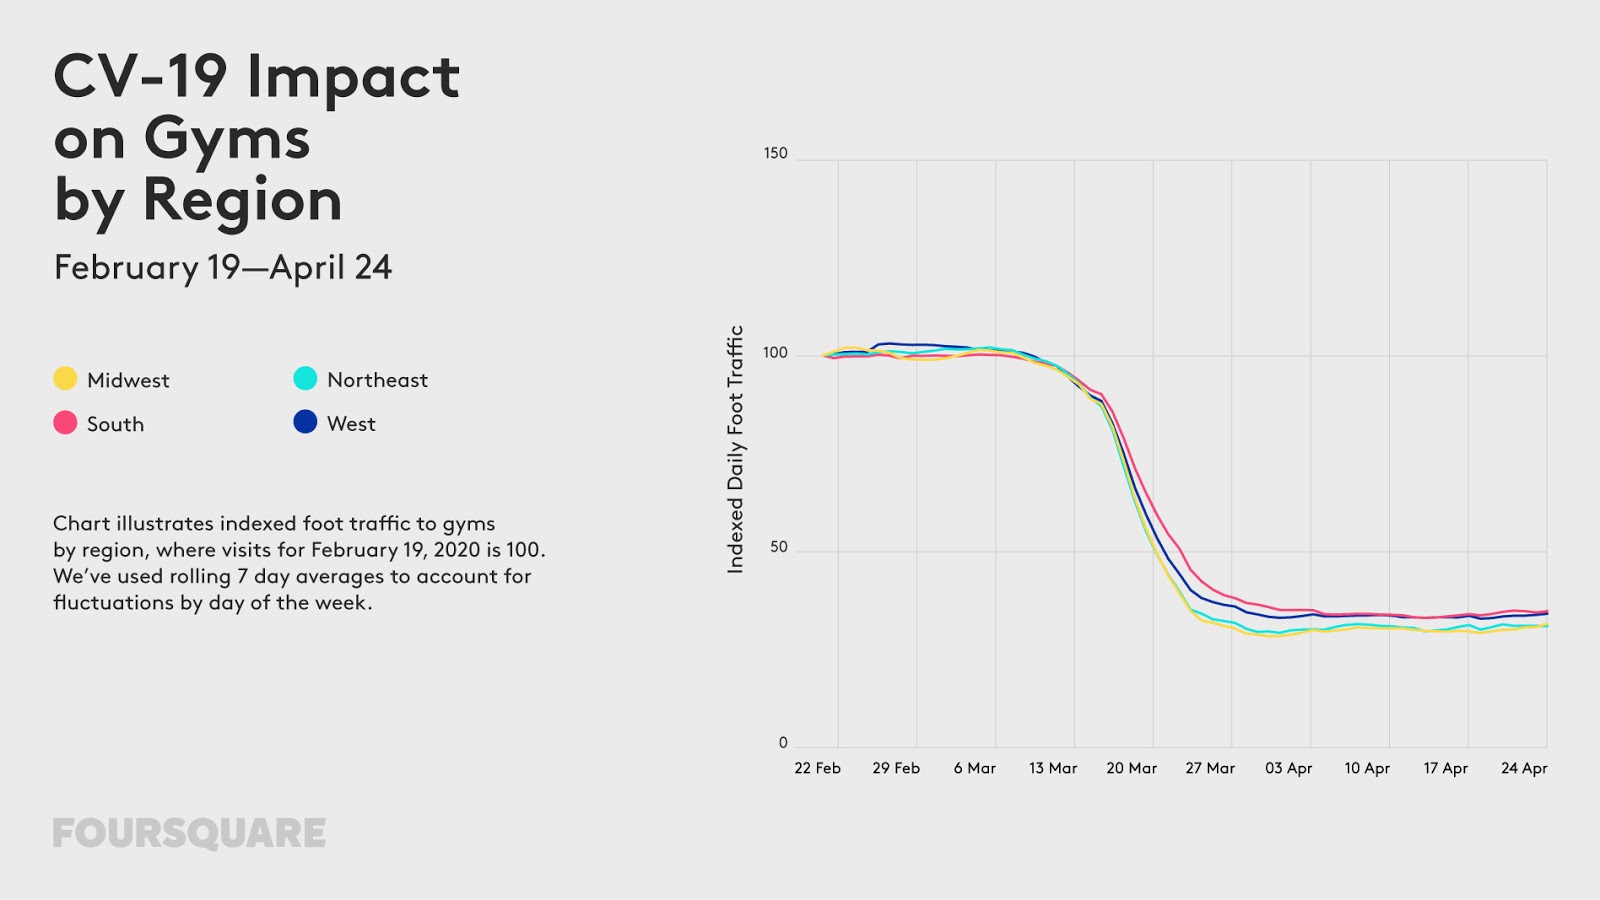
• Finding New Fitness Routines - Foot traffic to gyms has remained consistently low since around April 1, down 65-69% from the week ending February 19.
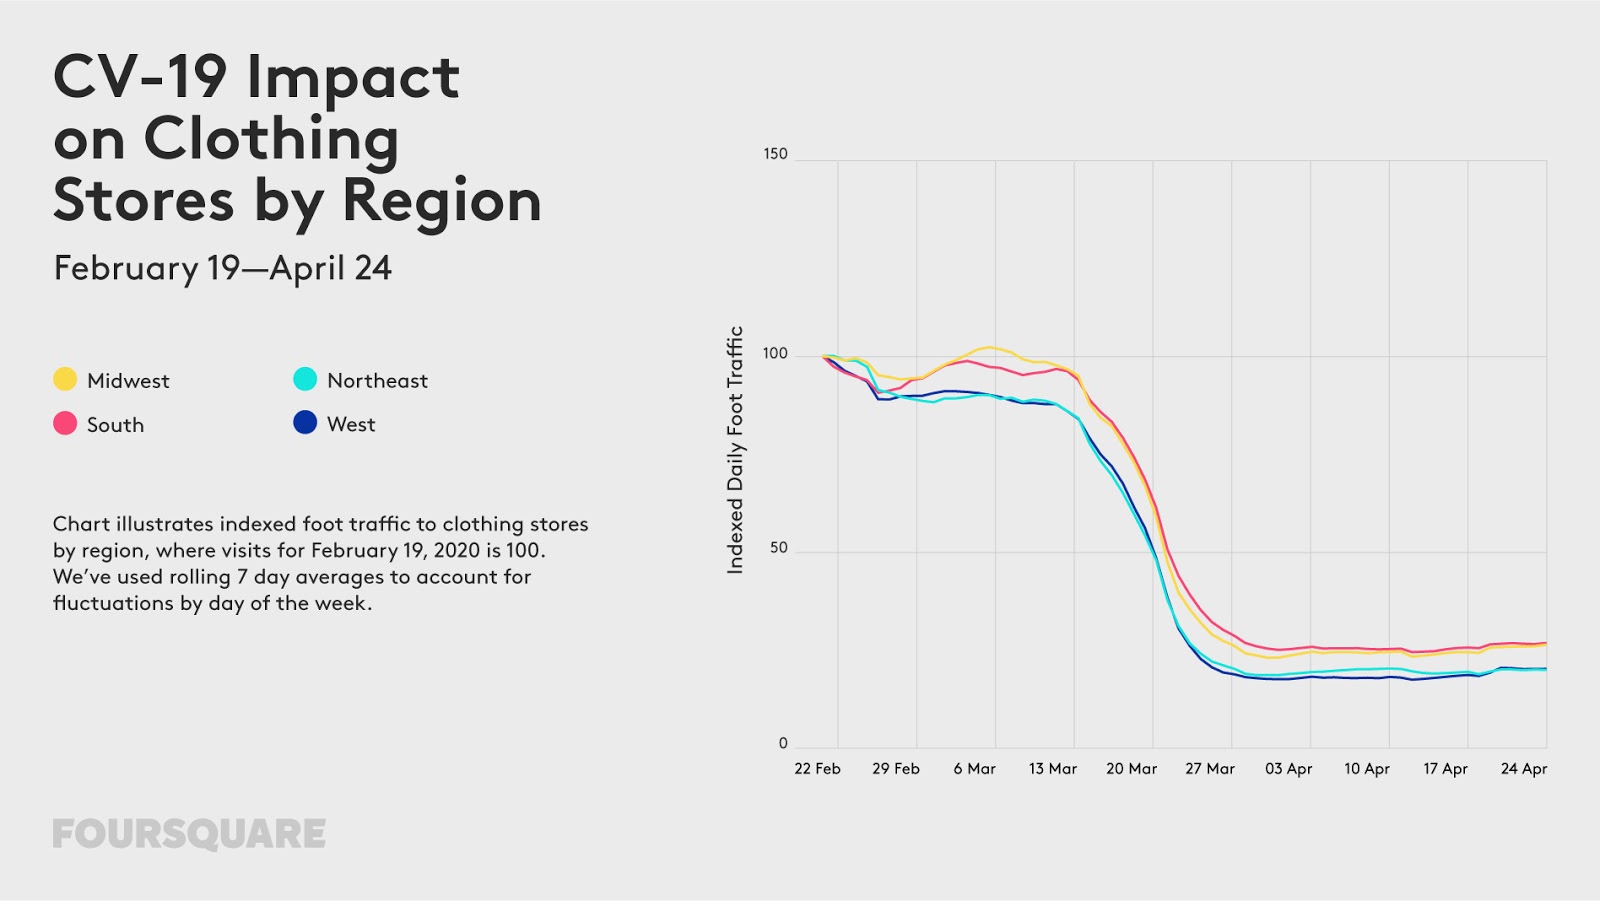
• Shopping Online Rather Than In-Store - Foot traffic to shopping malls has been stable since the last week of March, down 63-65% nationally from the week ending February 19. Visits to clothing stores have increased very slightly since mid-April, down only 72% as of April 24 (versus 74-75% in the weeks prior).
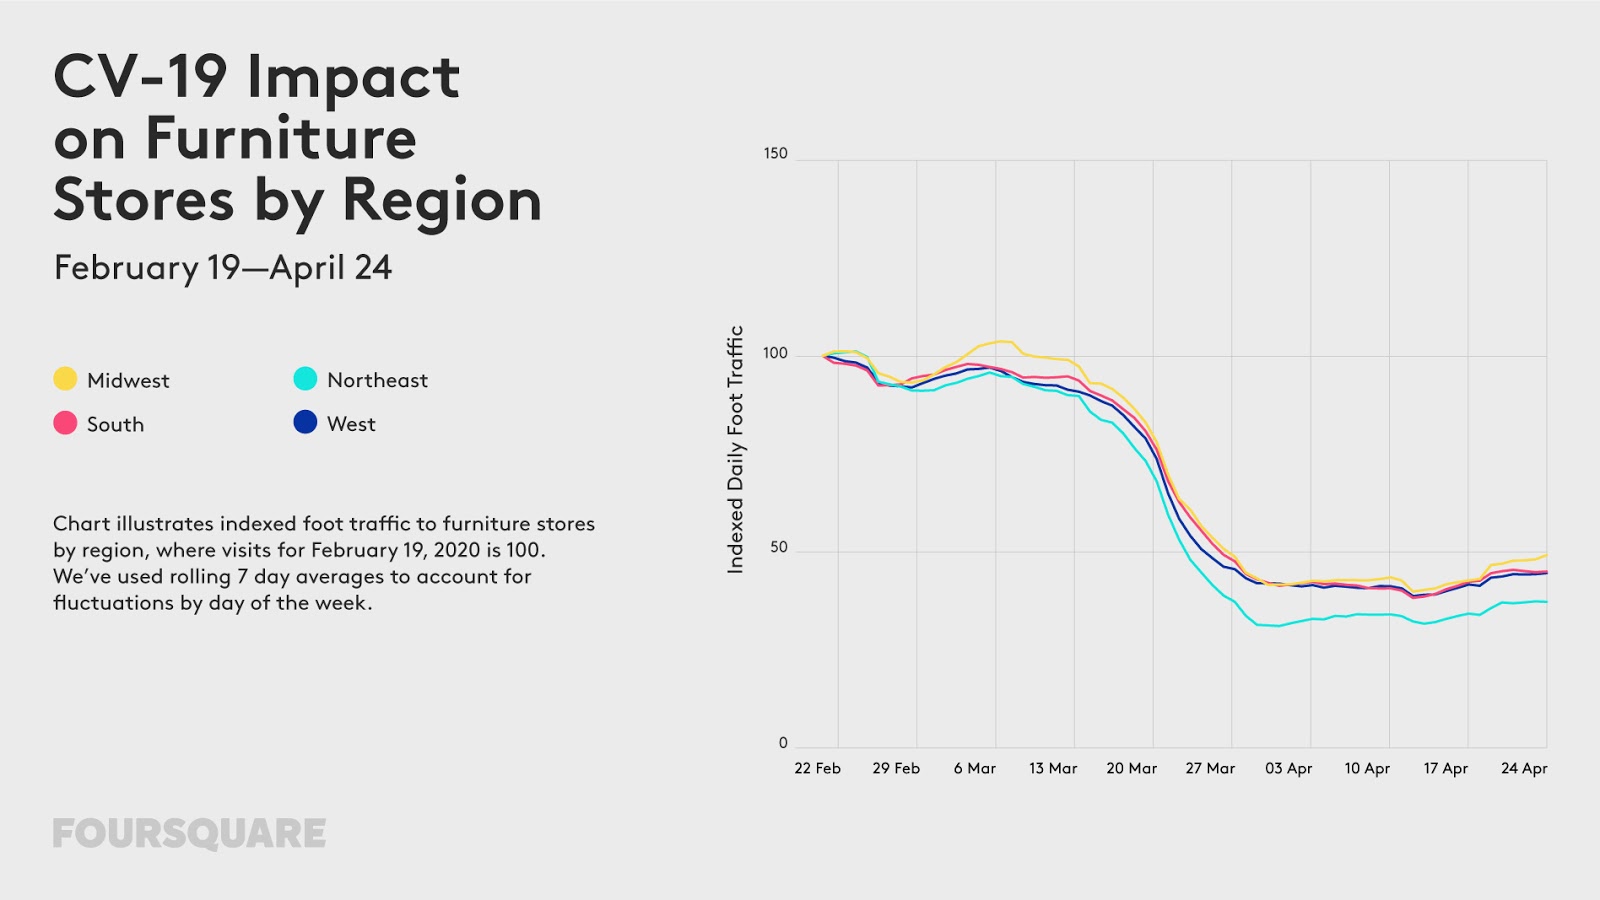
Visits to furniture stores have increased very slightly since mid-April, down only 55% as of April 24 (versus 56-60% in the weeks prior). Furniture store traffic showed increases in the Midwest in particular, with smaller upticks in the Northeast.
• Streaming Movies Instead Of Watching In Theaters - Visits to movie theaters have been consistently low since around April 1, down ~75% nationally from the week ending February 19.

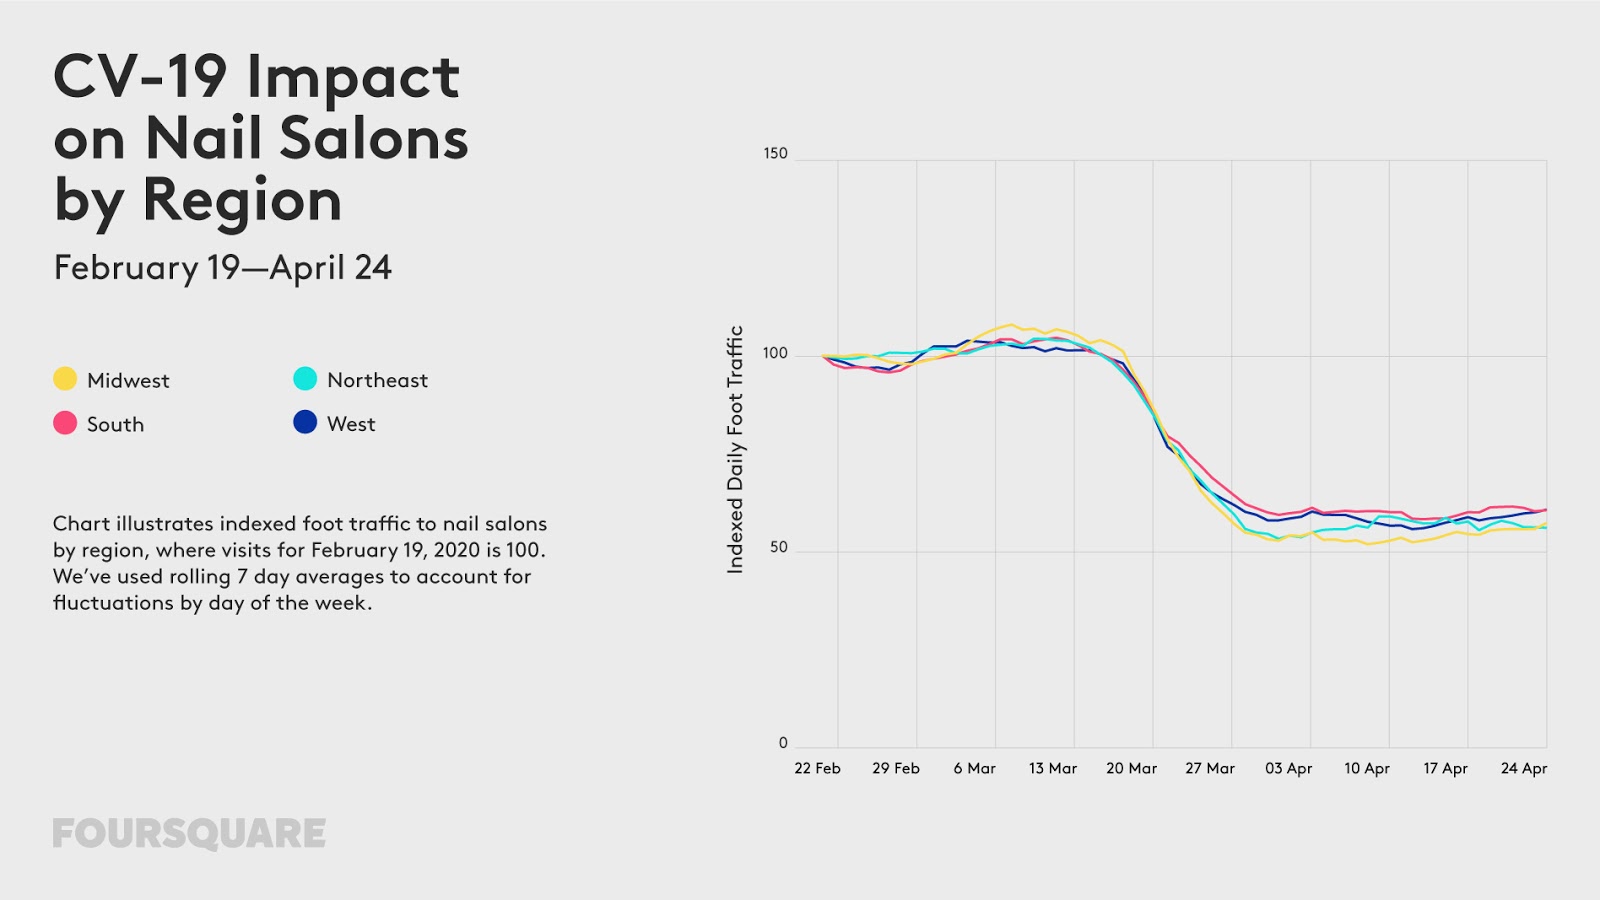
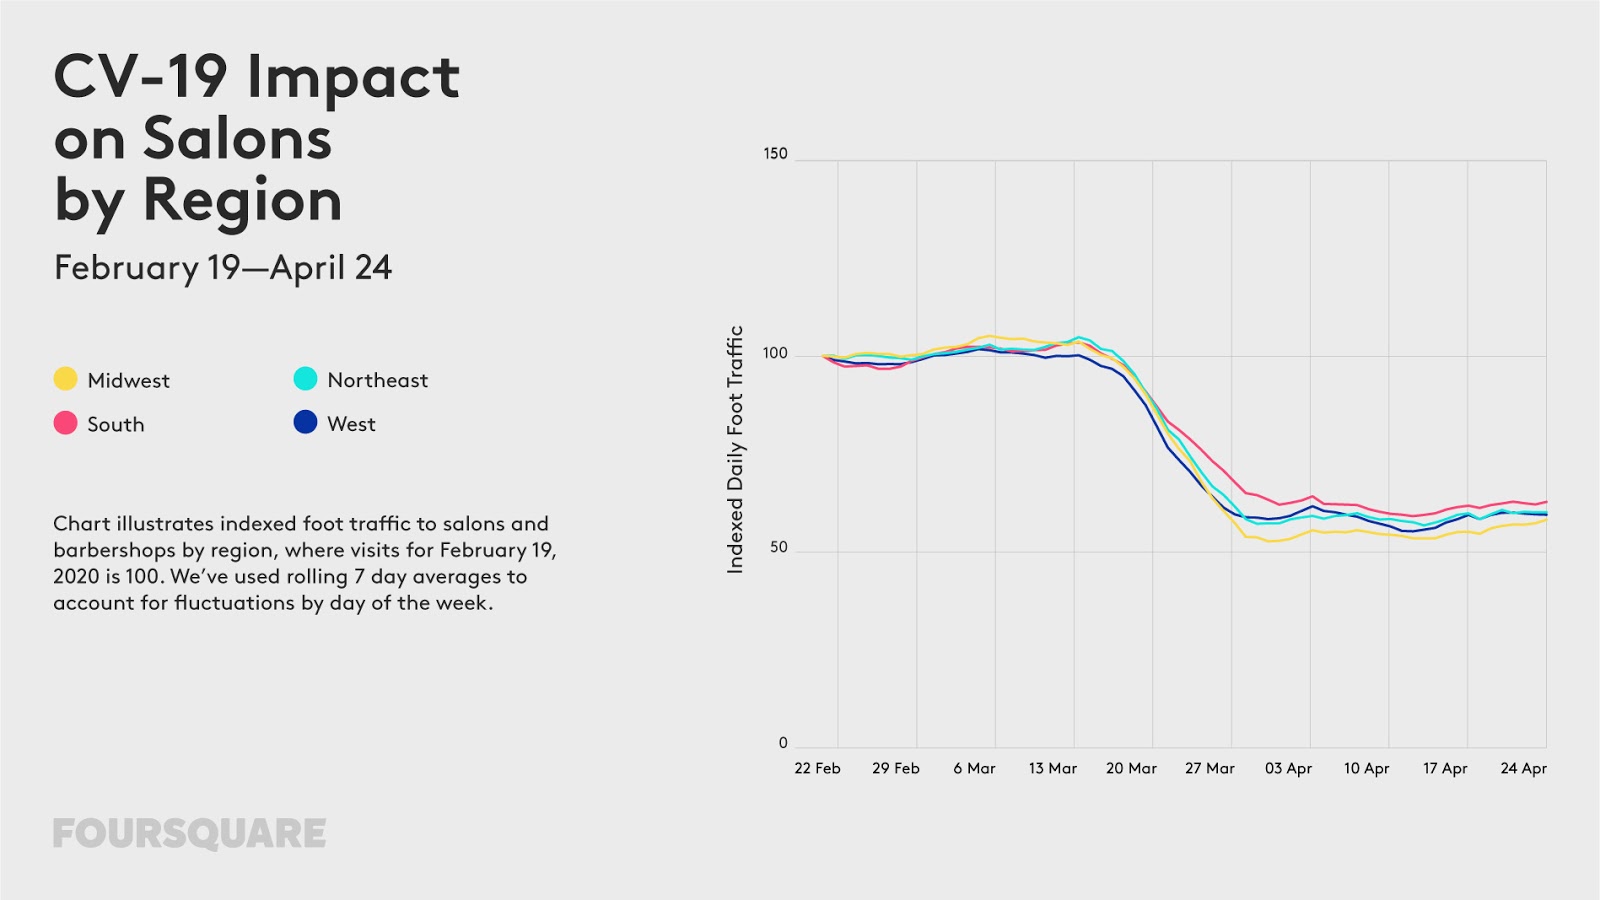
• Skipping Beauty Treatments - Hair salon and nail salon visits have been roughly stable since around April 1, down 38-42% nationally as of the week ending April 24.
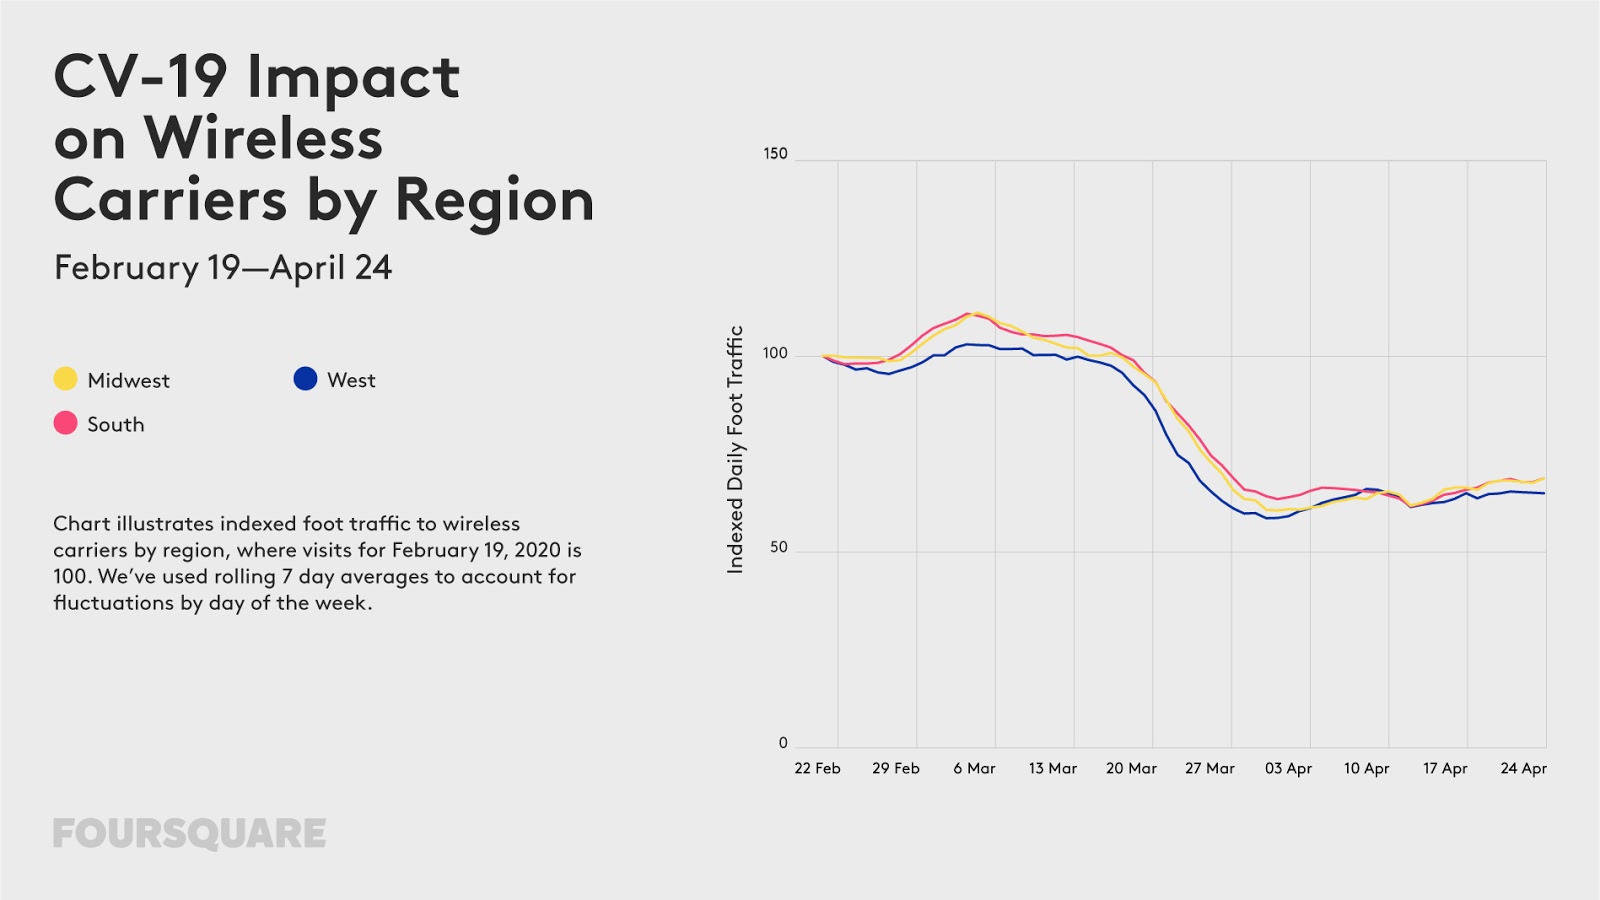
• Delaying Device Upgrades - Visits to wireless carrier stores like AT&T and Verizon have increased very slightly since mid-April, down only 33% nationally as of April (versus 34-39% in the weeks prior).
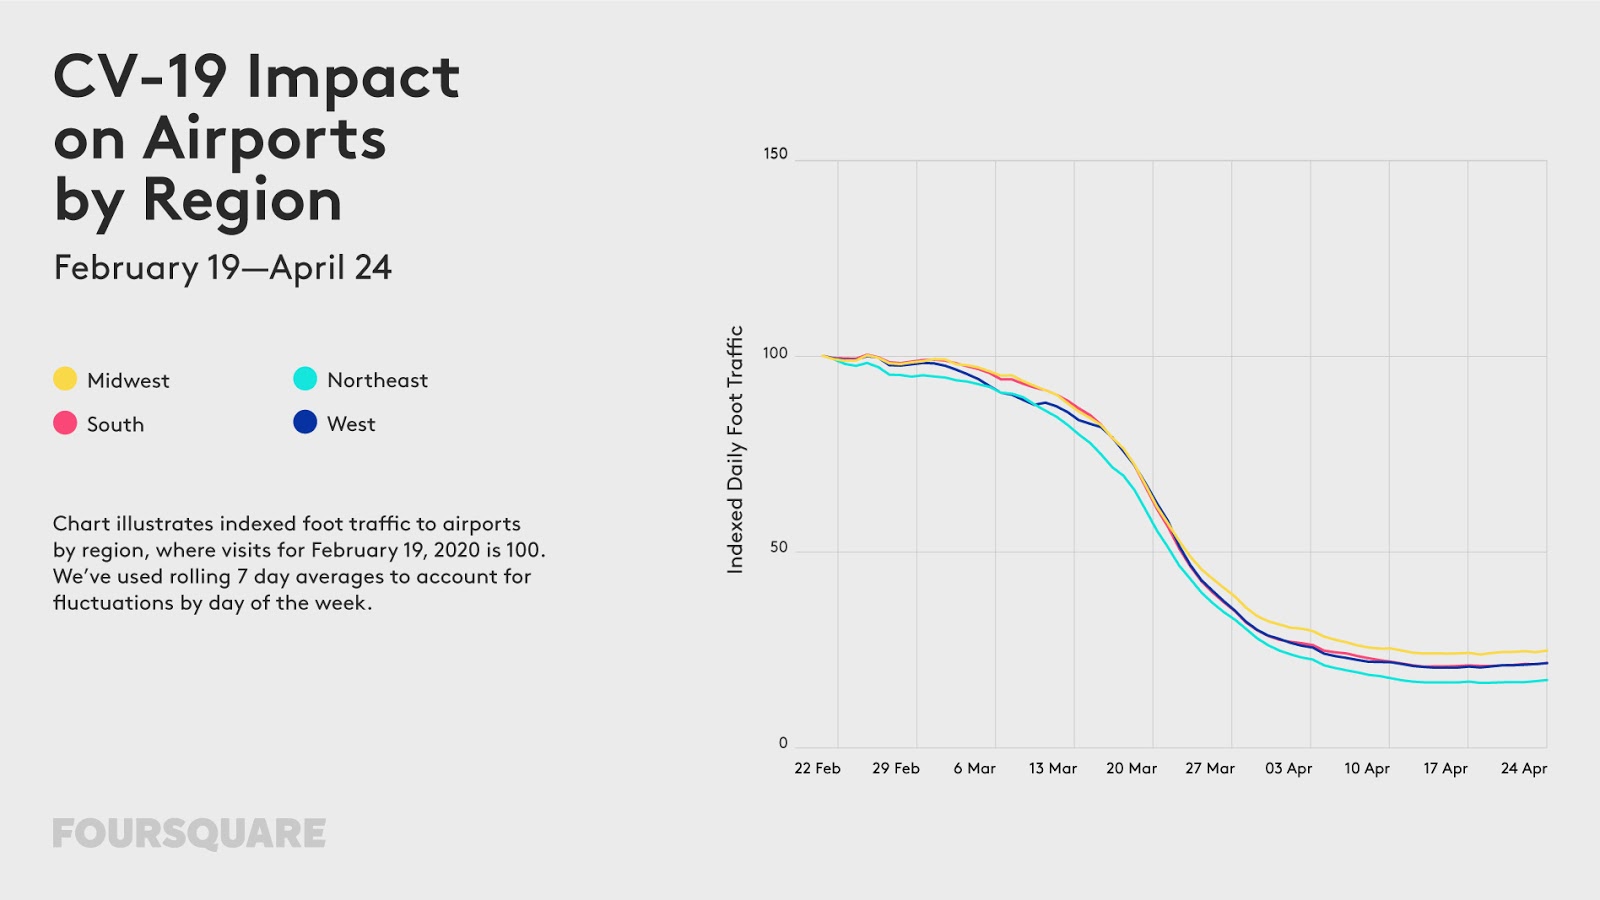
• Avoiding Travel - Visits to airports are still consistently down ~80% nationally since the week ending April 10. Airport visits are down most in the Northeast (-83%) and least in the Midwest (-75%).
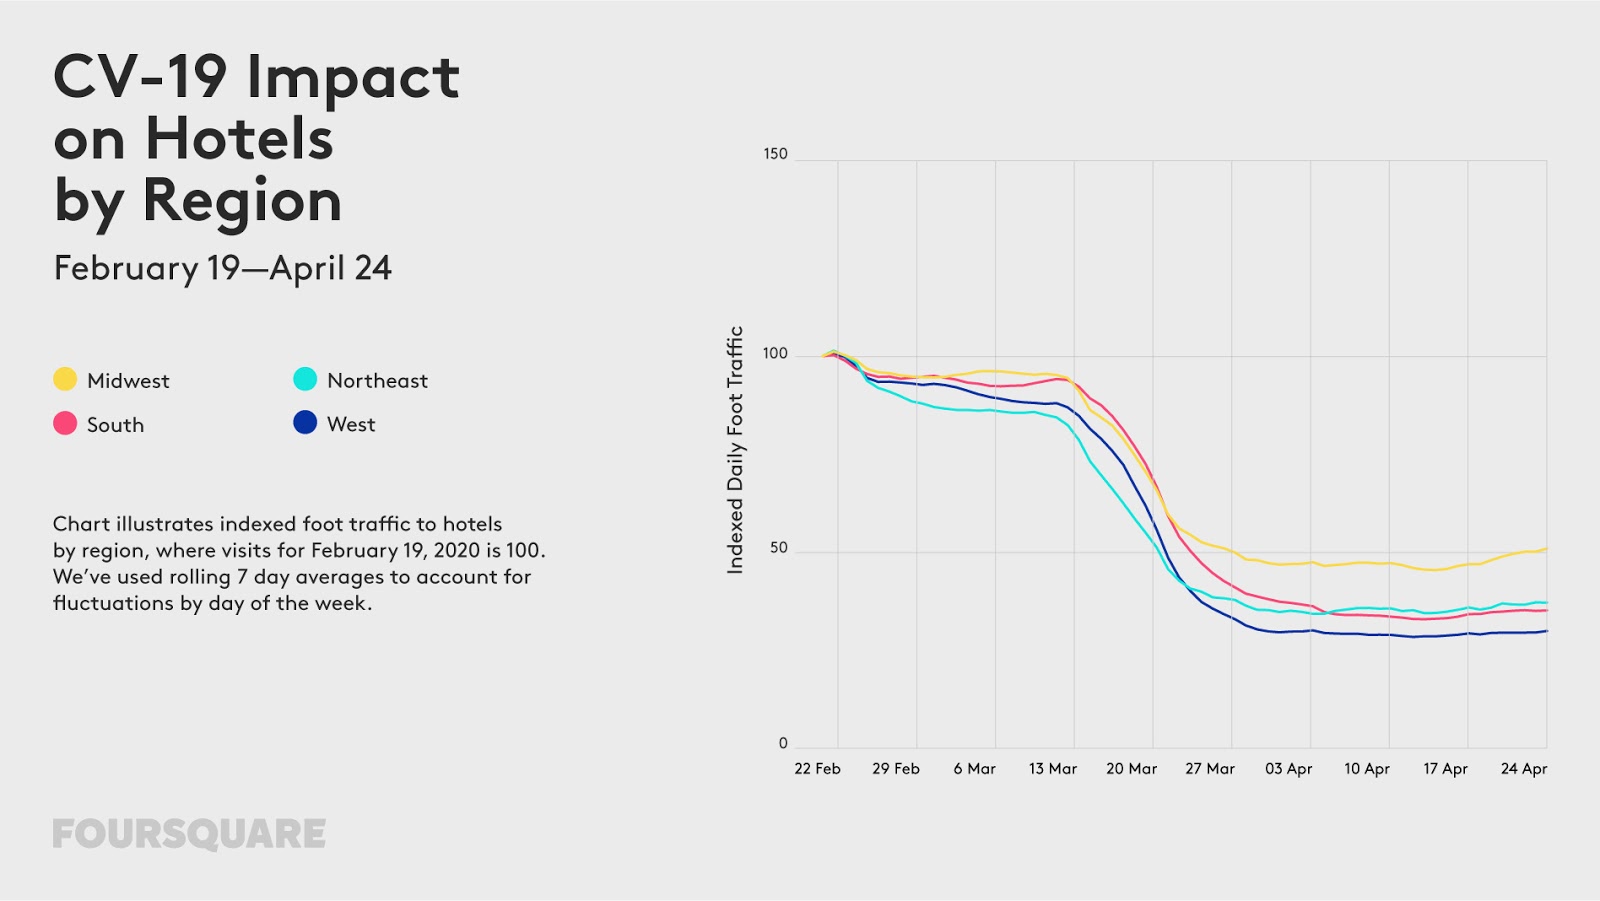
Hotel visits have increased very slightly since mid-April, down only 64% nationally as of April 24 (versus 65-66% in the weeks prior). Interestingly, hotel visits are down significantly less in the Midwest – down only 49%, versus a decline 63-70% in other regions. Hotel visits are also down significantly less in rural areas – down only 51%, versus a 75% decline in urban areas and 71% decline in suburban areas.
-–
Editor’s Note: Foursquare analyzes foot traffic patterns from more than 13 million Americans that make up our always-on panel. All data is either anonymized, pseudonymized or aggregated, and is normalized against U.S. Census data to remove age, gender and geographical bias.
The charts above illustrate indexed foot traffic to various locations. We’ve used rolling 7 day averages to account for fluctuations in foot traffic by day of the week. Visits are projected based on user profile representation relative to census. These projection factors are updating regularly. These updates may cause slight shifts in indexed foot traffic week-to-week.
Casual dining restaurants analyzed include casual dining chains in National Restaurant News’ Top 500 Chains.
Survey data mentioned above is derived from a survey of consumers in Foursquare’s always-on panel, delivered via owned and operated mobile apps (Panel App, Frequent Flyer and Give 2 Charity) from April 15-21 2020.
To learn more about the data behind this article and what Foursquare has to offer, visit https://foursquare.com/.


Sign up to receive our stories in your inbox.
Data is changing the speed of business. Investors, Corporations, and Governments are buying new, differentiated data to gain visibility make better decisions. Don't fall behind. Let us help.


Sign up to receive our stories in your inbox.
Data is changing the speed of business. Investors, Corporations, and Governments are buying new, differentiated data to gain visibility make better decisions. Don't fall behind. Let us help.