April is in the books and as the first full month in which COVID-19 response measures were in effect for much of the country, industry observers have been anxiously awaiting a look at final results for the month. As part of ALN’s ongoing analysis of the impact of COVID-19 on the multifamily industry, today we take a look at price class performance in the month of April.
ALN assigns conventional properties within each market to one of four price classes based on the property’s market percentile rank for average effective rent per square foot. This allows for a more precise comparison of properties across markets.
Before jumping into the price class numbers, some overall nationwide results are useful for context. The headline figure is that national demand fell 77% compared to April of 2019. Net absorption totaled around 8,000 units compared to about 35,000 units last April and around 42,000 units in April of 2018. Softening the blow somewhat was a nearly 40% reduction in new units delivered as a result of construction delays as well as moratoriums in some areas.
After a negligible retraction in average occupancy, the month ended at just below 92%. Average effective rent growth was slightly negative at -0.1% and 17% of conventional properties ended April offering a discount. That marks a slight increase from 14% of properties in April of 2019.
Average occupancy for Class A properties around the country finished April just above 85% after a decline in the period of just over 0.3%. Even so, that is the highest finishing average for April in the last three years. Monthly net absorption fell from about 9,100 units last April to just under 3,500 units this year – a decline of 62%. Monthly average effective rent growth was flat, with the national average for a Class A unit stalled at $2,006. Unlike the other price classes, the change in growth rate was more pronounced between April of 2018 and April of 2019.
Average effective rent gained 1% in 2018 and only 0.4% in 2019. Interestingly, there was not much of an increase in the availability of rent concessions being offered. Just over 17% of properties were offering a discount to open the month, and 18% of properties were offering by the end of the month.
Class B average occupancy ended the month at 91% after a slight loss of 0.1%. As with Class A, this is the highest average to end April within the last three years. Demand receded even more starkly here than in the Class A properties. Less than 1,000 units were absorbed in April after more than 8,500 units were newly rented in each of the previous two Aprils.
This decrease compared to last year amounts to an 89% decline. Rent growth in this group of properties slightly underperformed the top tier, with a loss of 0.1% at the average rather than no change. The average Class B unit ended April renting for $1,563 per month.
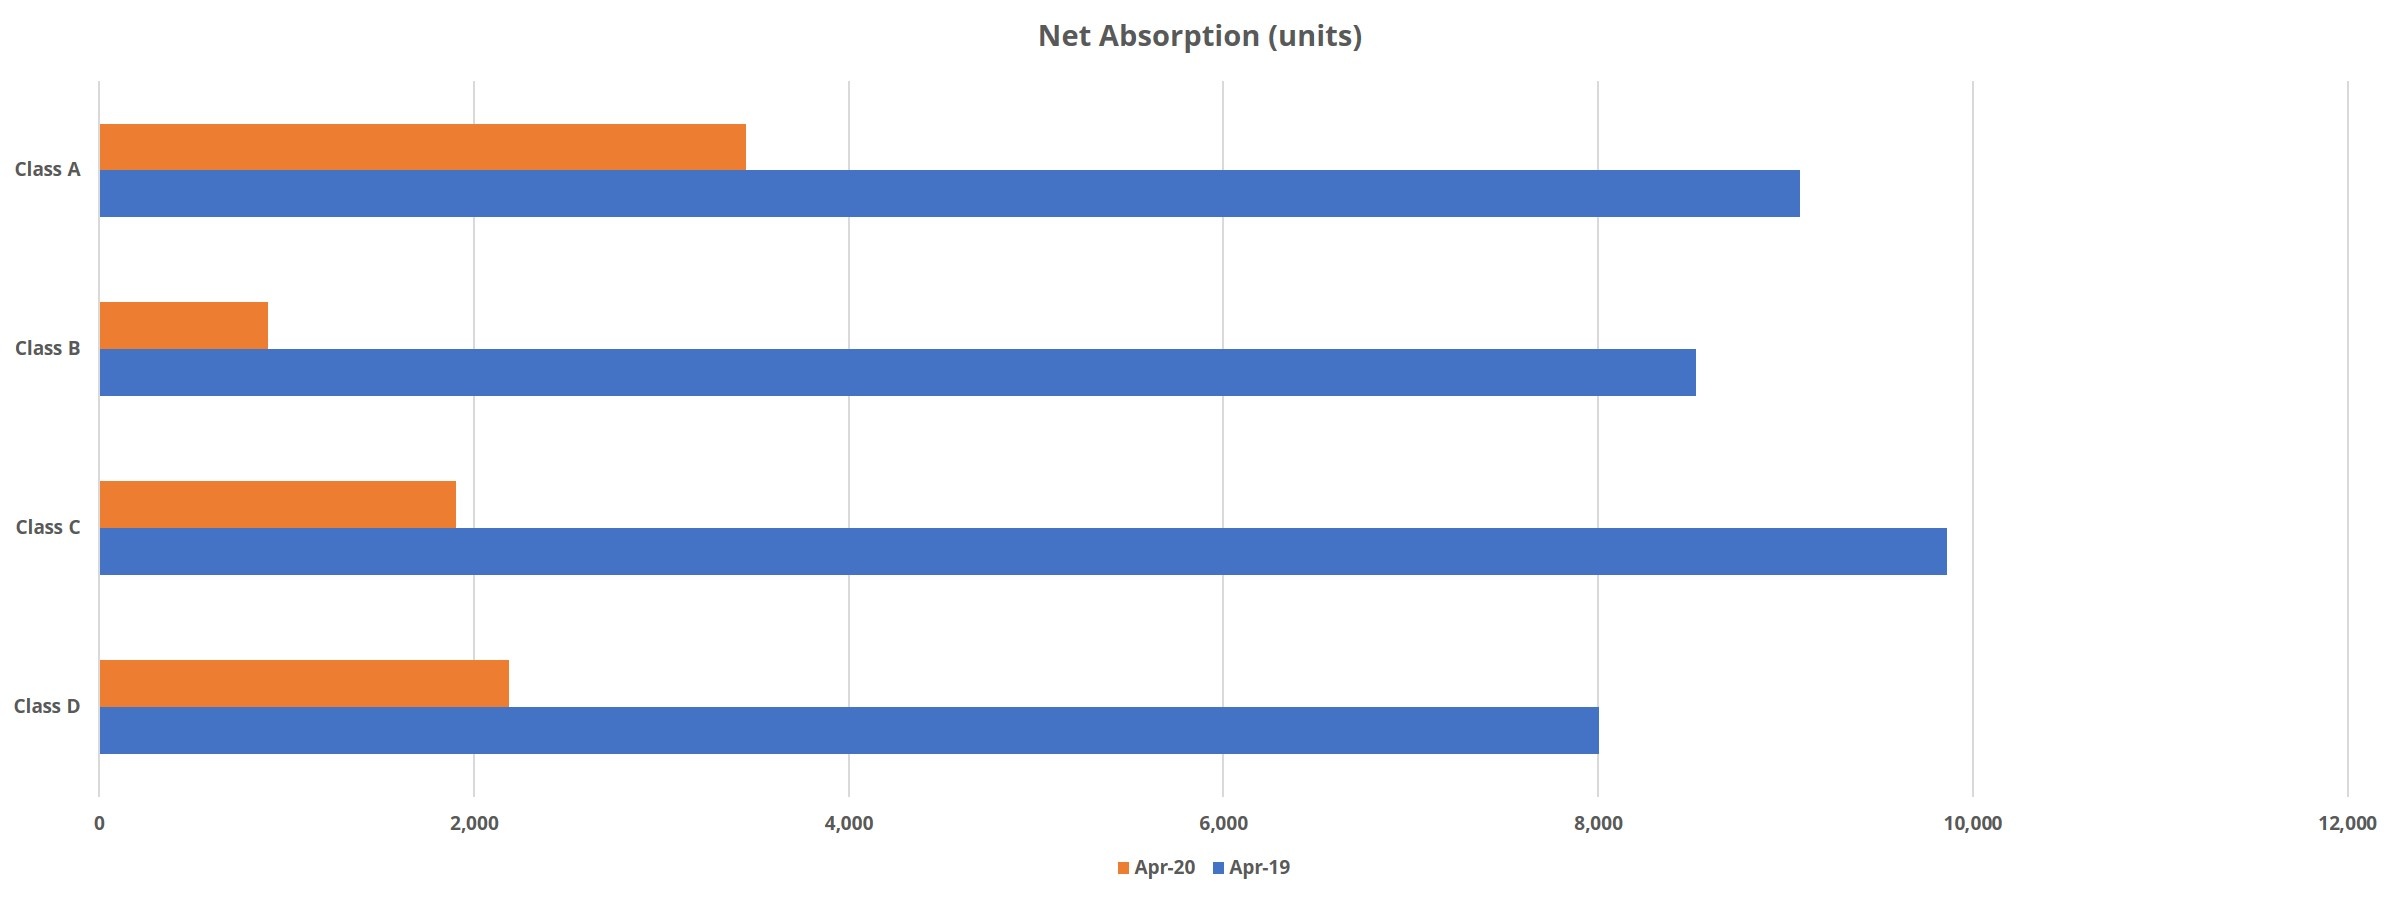
Class C average occupancy was unchanged in April, holding steady at around 93%. In the last three years, April average occupancy in this tier has remained somewhere just above 93% and just below 94%. Net absorption fell precipitously here as well, though not to the extent seen in Class B properties. After almost 10,000 previously unoccupied units were rented in April of 2019, this April saw less than 2,000 units absorbed.
Overall, the fall in demand was 80%. Whereas monthly absorption for Class C properties doubled that of Class B properties, the decline in average effective rent for this group was twice that of Class B. A loss of 0.25% brought the average unit to $1,275 per month after rent growth of around 0.6% in each of the last two Aprils.
These properties were the only group to manage an average occupancy gain during the month. This distinction is more a technicality, as the increase was only 0.1%. Occupancy for Class D closed the month closer to 94% than 93%, comfortably within the narrow range established for the period over the last three years. Demand was second strongest of these four groups, though “strongest” may be a rosy characterization. This is true whether looking at total units absorbed, or the change in demand year-over-year for April.
About 2,200 units were newly rented during the month, after around 8,000 units were absorbed last April. All told, this year’s result was 73% lower than last year’s. Net absorption may not have been as hard hit in this group as in Classes B and C, but average effective rent declined by 0.26% to $1,051 per unit. Rent ground had been about 0.5% in each of the last two Aprils. Noticeably, whether looking at overall average occupancy or at average effective rent growth, Classes C and D have tracked closely together in each of the last three years for April.
The most eye-popping monthly numbers were obviously the absorption numbers. Demand evaporated in April, with Class B properties being hardest hit. Somewhat mitigating the drop in absorption was an almost 10,000 unit decrease in new deliveries for April compared to last April. There has not yet been a move to pull the concessions lever to maintain occupancies and the dynamic in April was more about a halt in growth rather than an immediate decline in rents.
One factor not addressed in the aggregate rent and occupancy figures is the portion of residents occupying units while making partial rent payments or no rent payments. The impact of these “zombie leases” on net rent was softened by the better than expected rent collections in April as reported by the National Multifamily Housing Council. Even so, May is expected to be rockier still, and this could be more of an issue for operators moving forward.
To learn more about the data behind this article and what ALN Apartment Data has to offer, visit https://alndata.com.


Sign up to receive our stories in your inbox.
Data is changing the speed of business. Investors, Corporations, and Governments are buying new, differentiated data to gain visibility make better decisions. Don't fall behind. Let us help.


Sign up to receive our stories in your inbox.
Data is changing the speed of business. Investors, Corporations, and Governments are buying new, differentiated data to gain visibility make better decisions. Don't fall behind. Let us help.