In the mad dash to get our NFP forecast and the related job market data out as quickly as possible in advance of tomorrow’s jobs report, I will keep the broader commentary to a minimum (as in none) and just focus on what we’ve seen and are seeing in our job market data.
Shocking to no one, the data is horrific and unlike anything anyone alive has ever seen or will ever see again. There are a few mild indications that the rate of decline in labor demand is slowly abating and that the worst of the decimation specifically related to job listings might be behind us, but given what we expect to see not just in tomorrow’s jobs report but in job losses and the unemployment rate well into the foreseeable future, labor demand is, at best, a secondary consideration to the hellscape of the U.S. labor market. (And it goes without saying that the labor market is also, in turn, a concern infinitely far behind the loss of life and health-related crisis we’re facing).
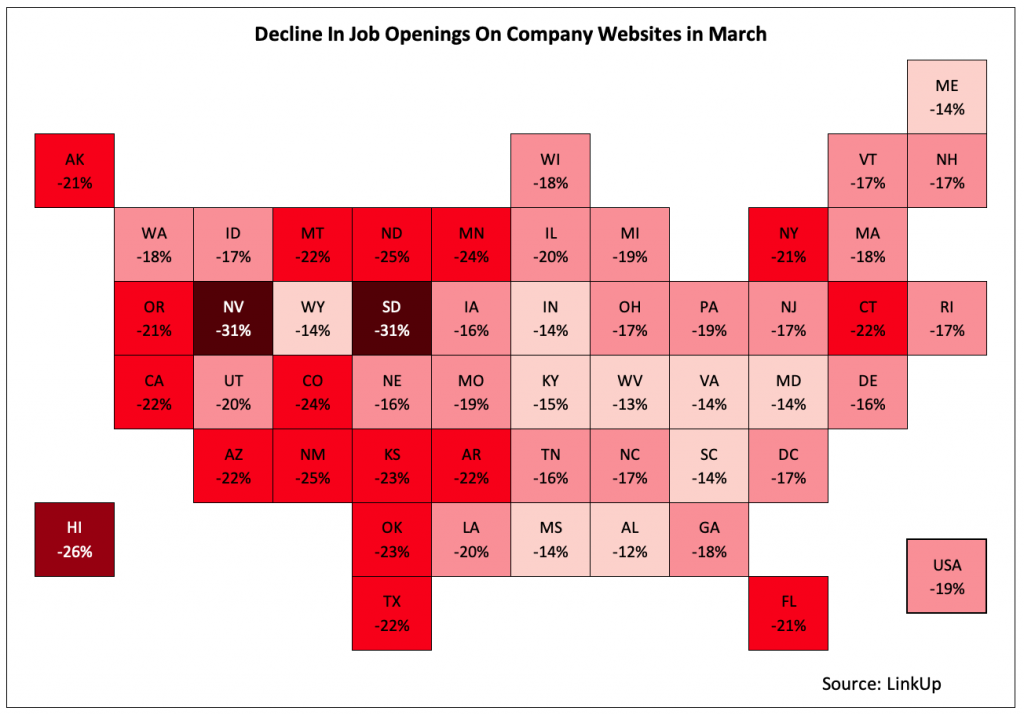
In any event, I’ll start by turning back to March data, mostly to put April’s data in context. In March, job listings across the entire U.S. economy dropped by 19%.
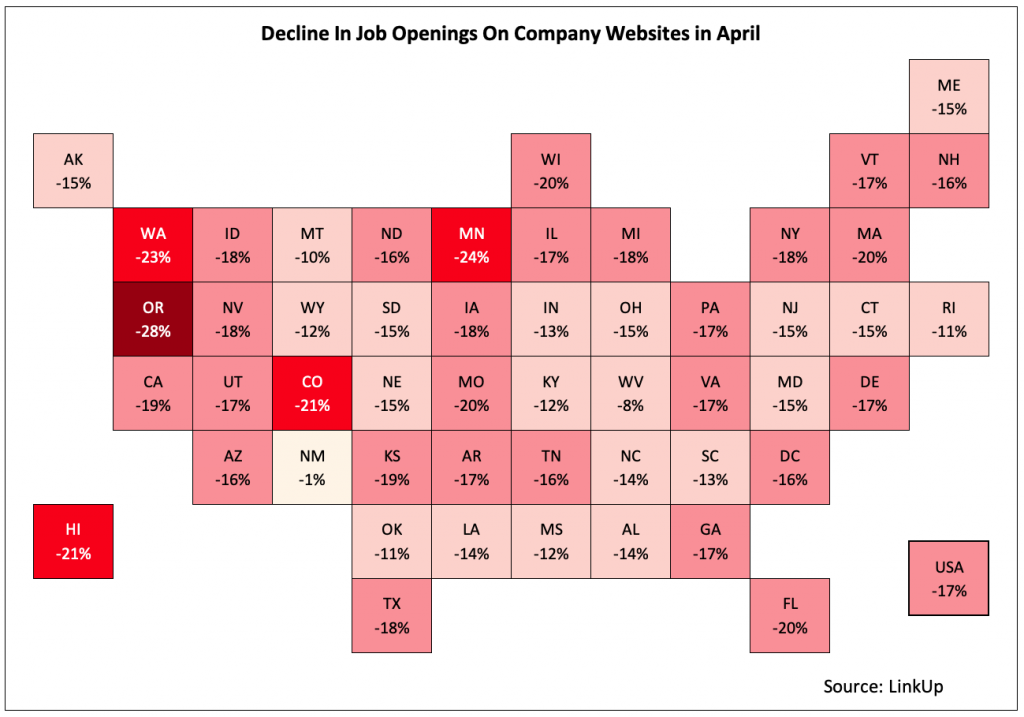
In April, job listings fell at a slightly lower rate of 17% and the percentage declines in most states improved from the prior month, making the ‘heat map’ of the country look significantly better relative to March than one might expect from just a 200 basis point ∆ between the two months.
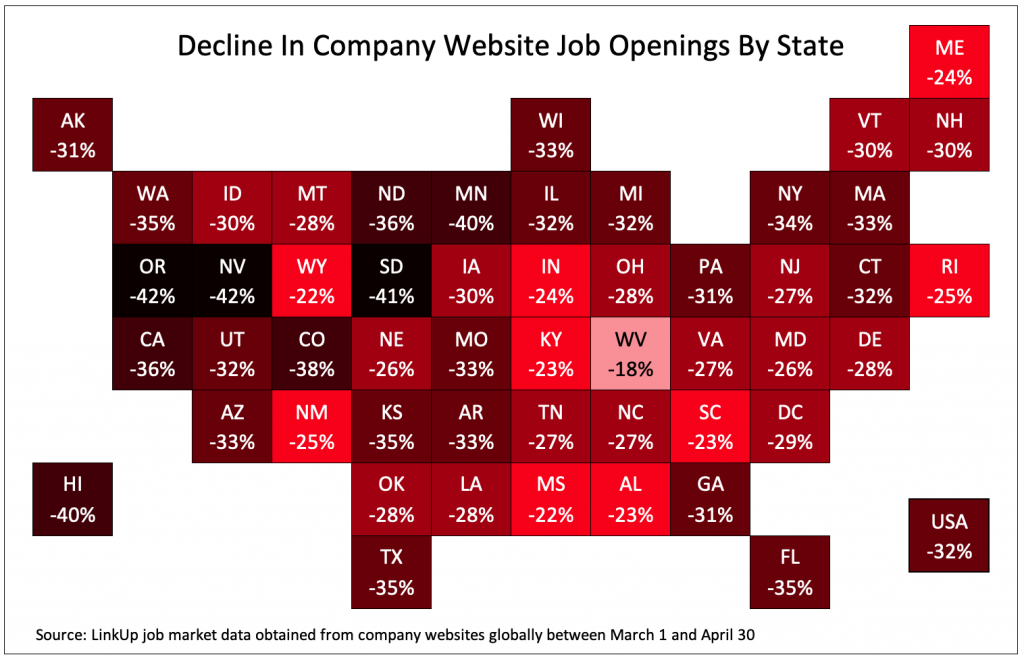
The map for job listing declines for March and April combined, however, shows just how catastrophic the pandemic has been to employment and labor demand.
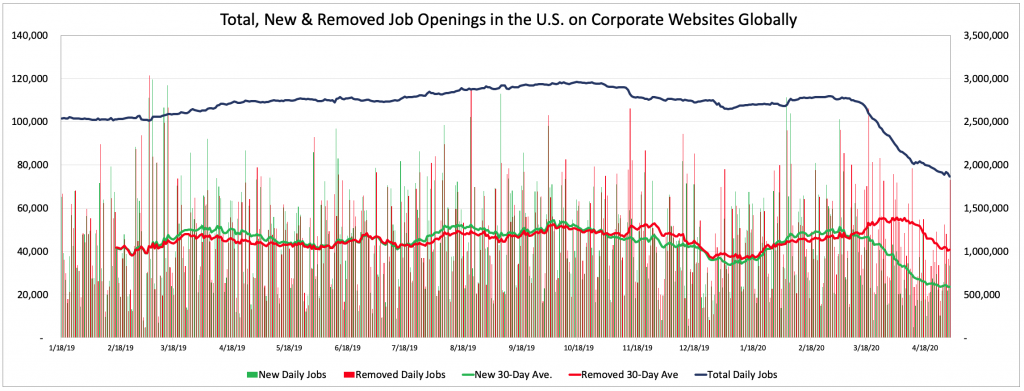
Looking at the monthly raw data in aggregate, total unique job listings in the U.S. fell 23% with new job openings falling 37% from March and removed job openings dropping 29%.
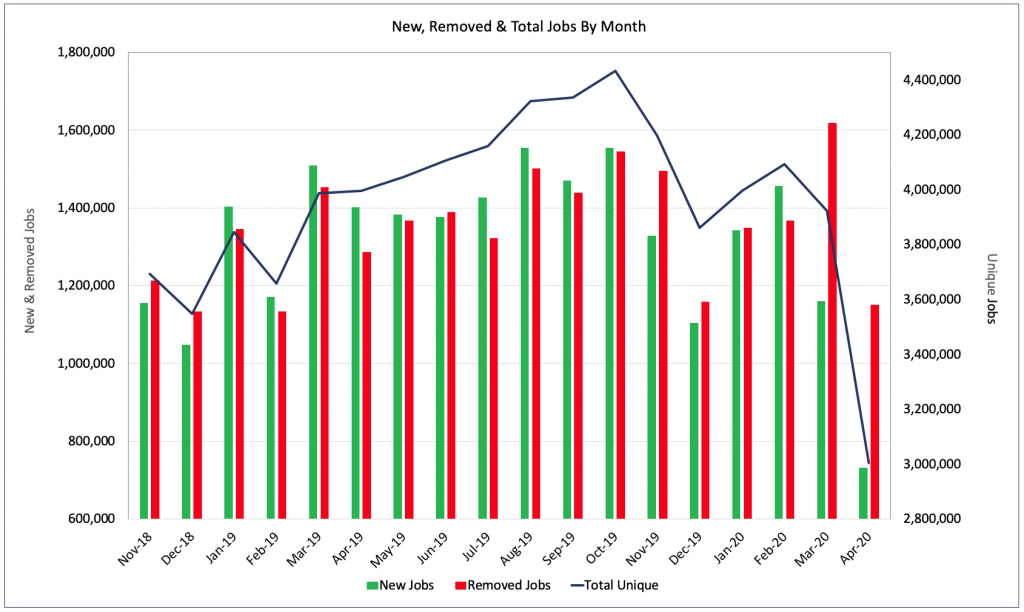
Looking at the same data but on a daily basis with 30-day rolling averages for new and removed jobs shows how quickly and severely the decline in job listings beginning in Mid-March.
As an aside, for background and context, LinkUp is the global leader in delivering job market data and information to clients and partners in the capital markets, human capital management, and corporate sectors. Our data solutions are built from job openings that we index every day exclusively and directly from company and employer websites around the world. The historical dataset of 130 million job records goes back over 10 years and we update it every day with roughly 3 million jobs (pre-COVID-19) indexed from 60,000 company websites around the world. The dataset includes every job and occupation type from public and private companies of all sizes and industries from all over the country and around the world as well as non-profit organizations and government employers. We do not aggregate jobs from job sites so there are no duplicate listings, expired openings, or job board pollution. From that powerful and predictive dataset, we’ve developed a broad range of data solutions that deliver a unique and highly compelling value proposition for our clients in the markets we serve.
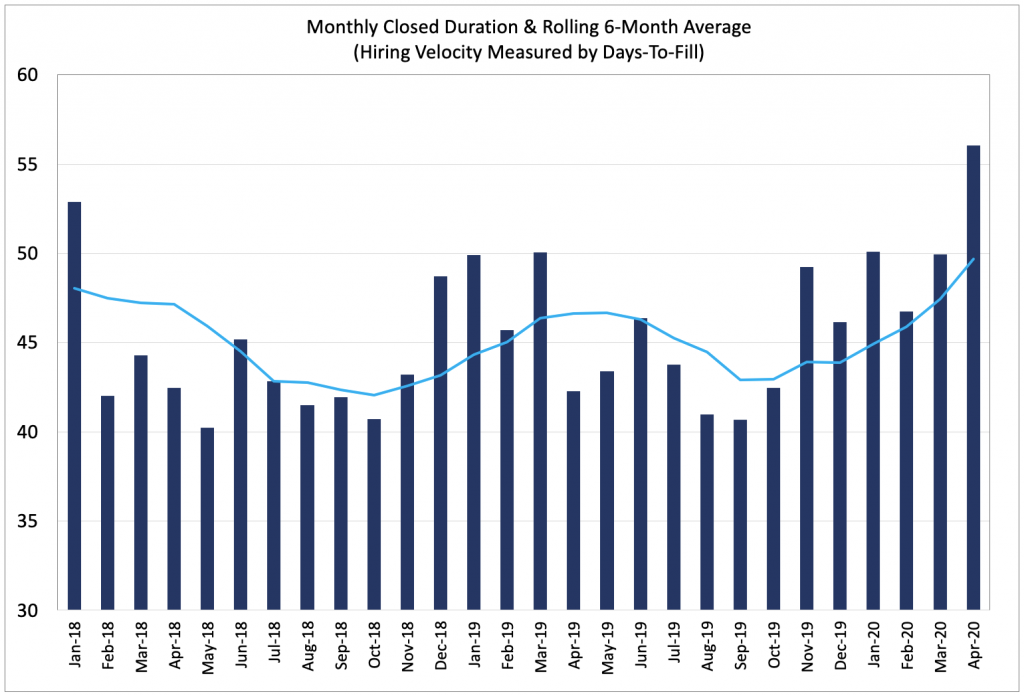
Turning back to our data from April, hiring velocity slowed sharply in April. We measure hiring velocity by calculating the average number of days that job listings are posted on corporate career portals around the country before they are removed. Under normal circumstances, job listings are removed when an employer fills the opening with a hire, but in the current pandemic, employers are removing job listings almost solely due to the fact that they no longer intended to fill the positions with hires. So while the metric might be slightly skewed as a result of the current crisis, there is no doubt that, across the board, hiring velocity for most companies dropped precipitously in April.
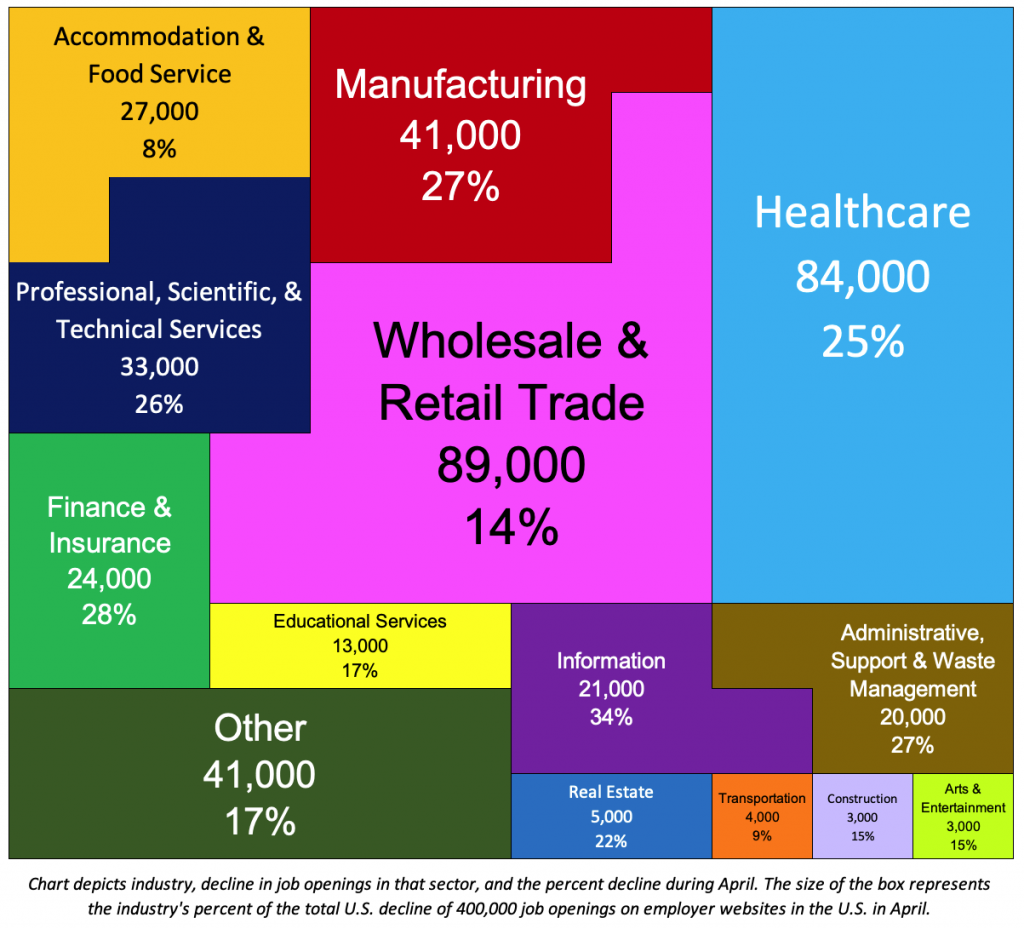
In April, job openings by industry (using NAICS) dropped by 400,000 (compared to a decline of 485,000 in March). The graphic below shows the industry, the number of job openings that were removed in each sector, the percent decline from the prior month, and for each industry, the size of the Tetris piece reflects that industry’s percent contribution to the total decline of 400,000 job listings.
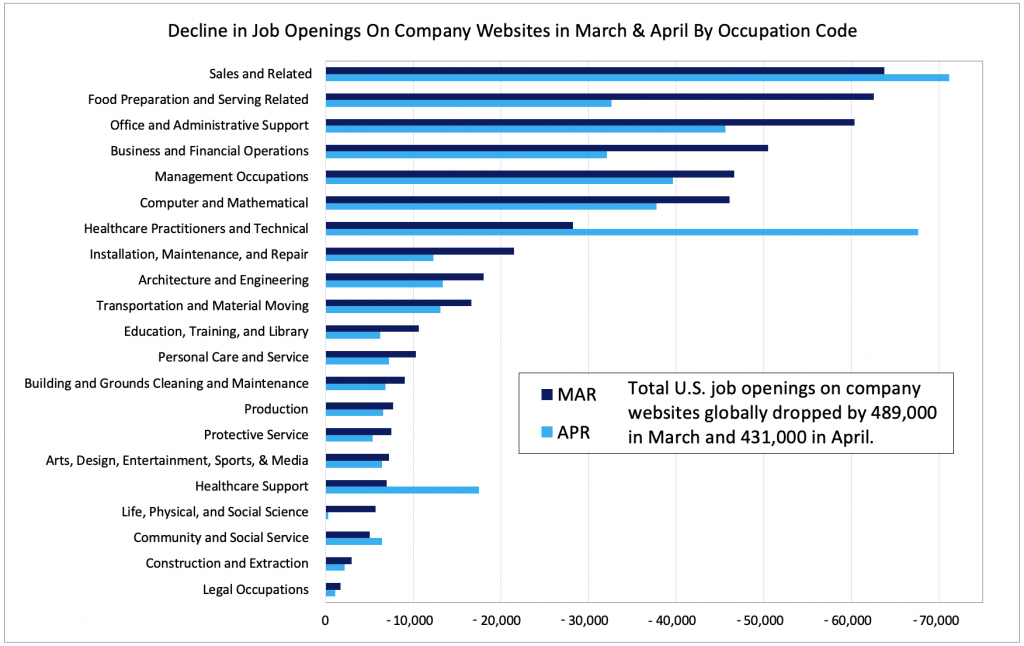
Again in April, sales jobs were the hardest hit in terms of occupation type, but cuts in healthcare listings rose sharply in April as states began mandating stoppages in non-essential medical services, elective surgeries, and various other parts of the healthcare industry.
Because we are continuously adding new companies and jobs to the index, we’ve developed a few analytics to normalize the data. One of those is the LinkUp 10,000 which counts the total number of U.S. job listings for the 10,000 global employers with the most job openings in the U.S. on any given day or in a given month.
In April, the LinkUp 10,000 dropped 24.5% to 3.93 million job openings.
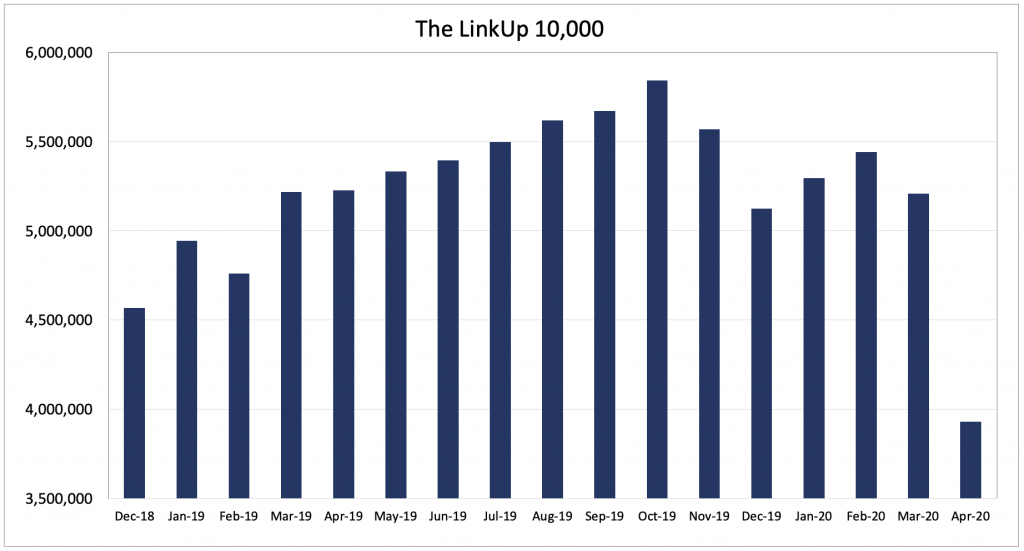
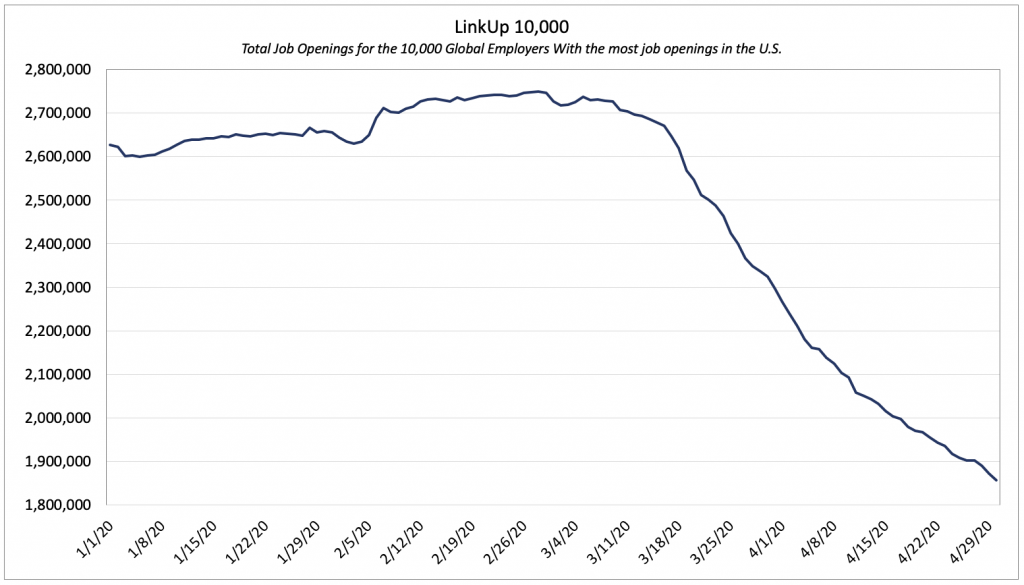
In March, the LinkUp 10,000 fell just 4.3% because the decline in job openings did not begin until Monday, March 16th. For the first half of March, job openings were actually rising from the prior month but then fell off a cliff in the 2nd half of the month. That free-fall continued throughout April.
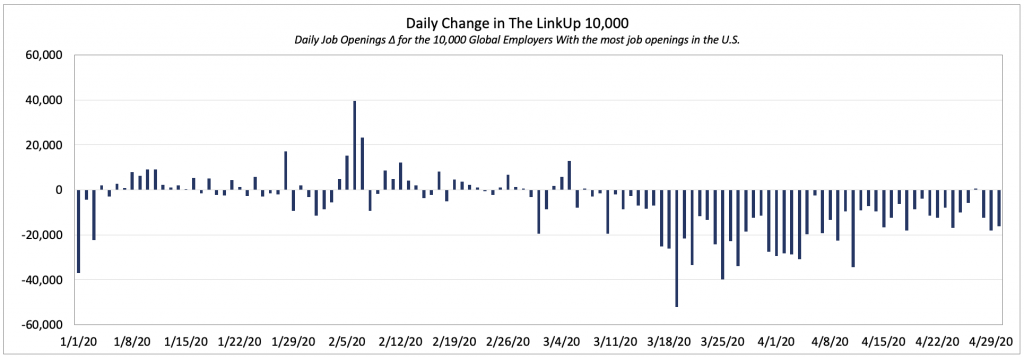
But looking at the daily decline, it is clear that the rate of decline is slowing down and on April 27th, job openings actually rose by 663 job openings.
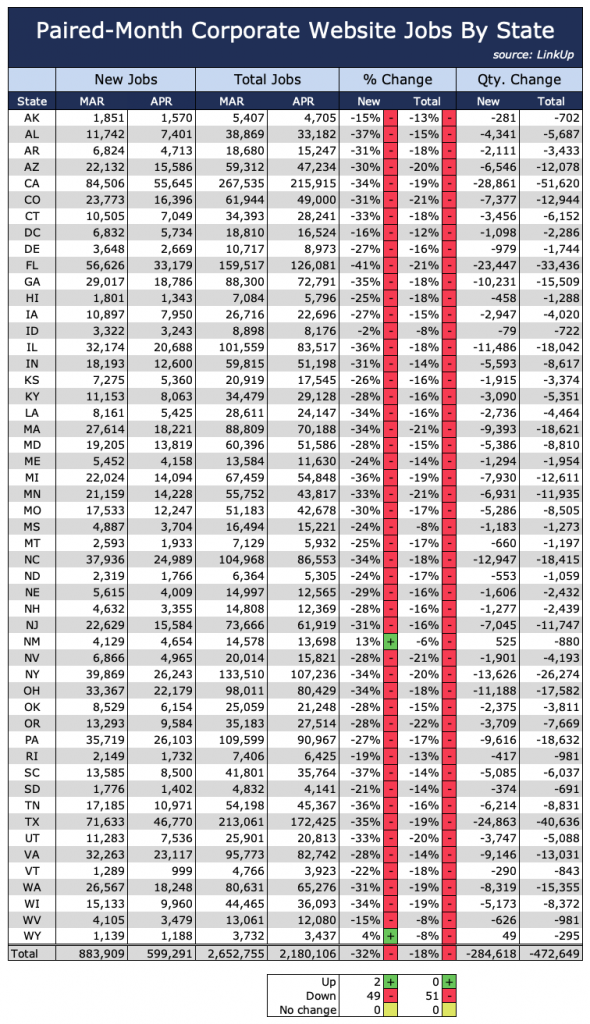
Our paired-month data is another methodology we have developed to normalize the data to account for the continual addition of new companies and employers to the dataset. Each month, we measure changes in new and total job listings for a distinct set of companies that were hiring during each of the two prior, consecutive months.
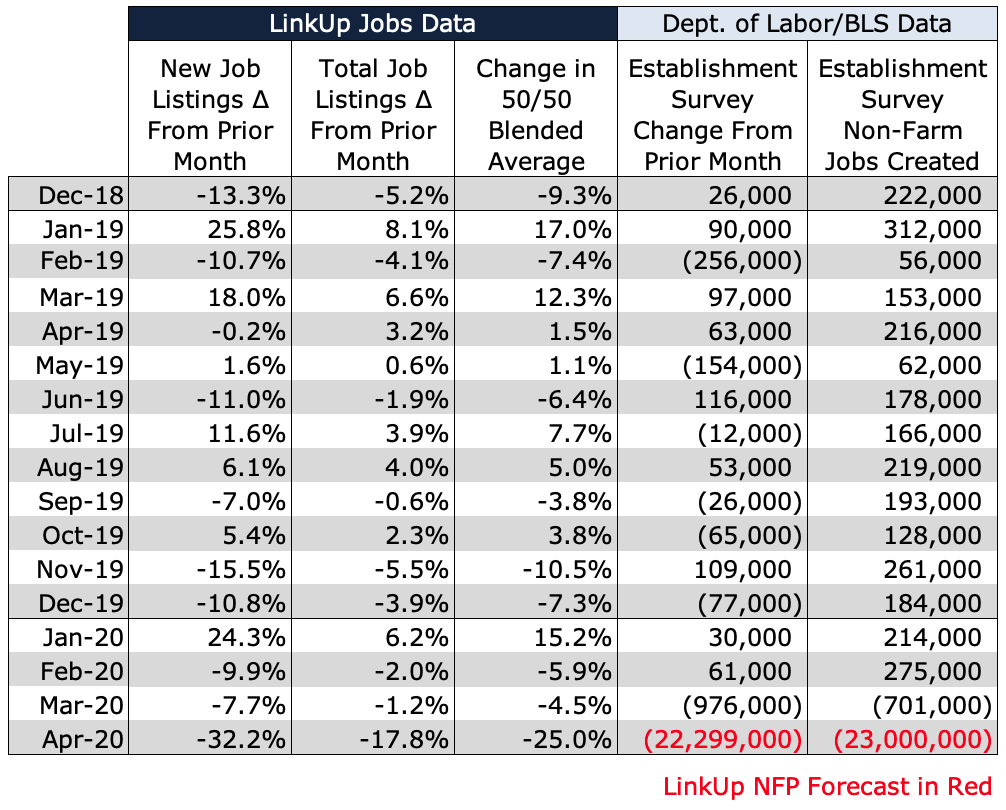
In April, new and total job openings from the paired-month data fell 32% and 18% respectively.
Needless to say, the forecasting model that we built a decade ago, which has, by the way, enjoyed a pretty solid track record over the years, doesn’t accommodate any type of scenario that would remotely approach what we’re dealing with these days. So because our alethiometer does not possess a symbol for a global pandemic, we’re forced to pretty much wing it for tomorrow’s jobs report. And in any event, I’m not sure it much matters precisely where between a loss of 20-25 million jobs the actual number falls – it will be apocalyptic, depression-era regardless.
So with that being said, we are forecasting a net loss of 23,000,000 jobs in April.
Complete insanity.
To learn more about the data behind this article and what LinkUp has to offer, visit https://www.linkup.com/data/.


Sign up to receive our stories in your inbox.
Data is changing the speed of business. Investors, Corporations, and Governments are buying new, differentiated data to gain visibility make better decisions. Don't fall behind. Let us help.


Sign up to receive our stories in your inbox.
Data is changing the speed of business. Investors, Corporations, and Governments are buying new, differentiated data to gain visibility make better decisions. Don't fall behind. Let us help.