

This is the 11th edition of a weekly review of changes in road traffic demand in the United States from the COVID-19 virus spread and our collective response.[1] We will endeavor to publish this Synopsis every Monday for the foreseeable future, providing results through Friday of the previous week. If interested in detailed information with daily updates, we have introduced the INRIX Trip Trends.
Key Findings
Background
Our incoming data sources (The ‘INRIX Fleet’) provides anonymous speed/location reporting to us in real-time and generates over 100 million trips, traveling over 1 billion total miles per day across the US. The INRIX Fleet provides information about all roads in the national network, not just major roads and spans the full range of vehicle types: consumer vehicles, local fleets, long haul trucks.
We have re-purposed our INRIX Trips metadata – with only a 48-hour lag – to generate relevant summary level information about traffic demand.[3] In this extraordinary time, we hope that this information will be useful to policy makers and the public. We look forward to the week, hopefully soon, when we can report on congestion and volume growth – as this will be a sure sign of recovery.
Synopsis
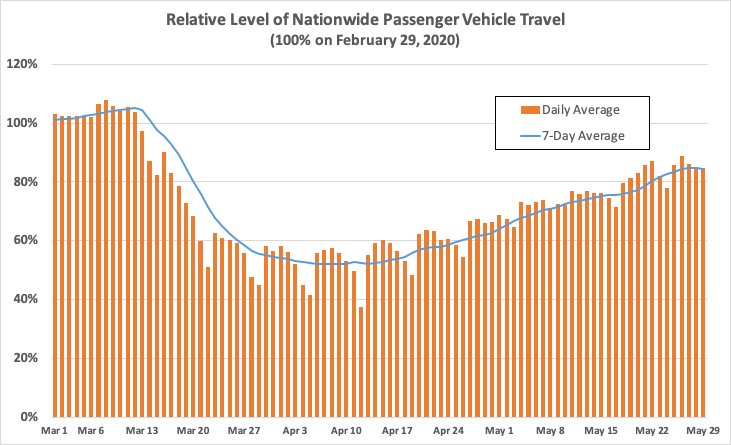
It has been ten weeks since travel began its noticeable decline nationwide. Figure 1 shows the relative change in passenger vehicle travel from March 1, relative to the comparable day of the week during the control week of February 22 – 28, 2020. Figure 1 also includes a weekly rolling average. Passenger travel continued to trend upwards, down 16% weekly on Friday, May 29th, compared to 19% the previous Friday and 48% on April 9th the low point to date. The weekly average was last at 16% on Thursday, March 19th, just one week into the initial travel decline.
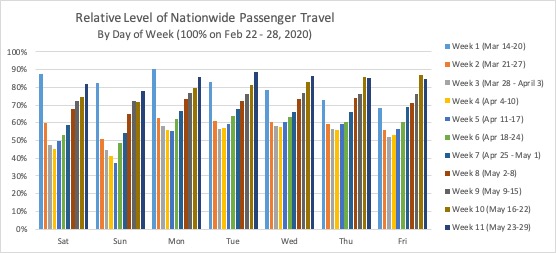
The daily figure for Tuesday, May 26th was 89%, a figure last seen on Monday, March 16th, the fourth day of measurable nationwide travel decline. Figure 2 shows the daily figures each week, illustrating the travel declines stabilizing in Weeks 4 and 5, increasing since then. Memorial Day weekend altered trends, with more travel late in Week 10 and less travel early in Week 11, highlighting that day-to-day trends can be volatile. With no holiday impact, Week 12 should revert to a ‘normal’ week for comparison purposes.
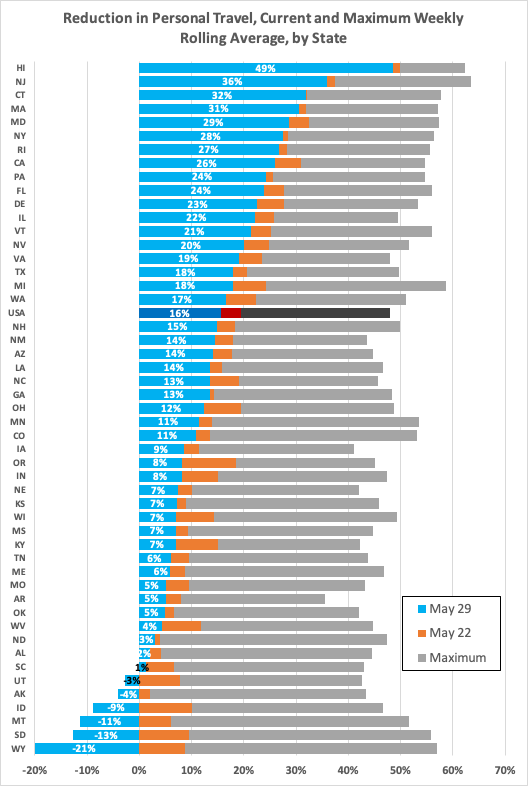
State Level Passenger Travel increased in every state compared to last week, for the sixth week in a row. 16 states increased 5% or more in Week 10. Two states increased 10%: Oregon and Idaho. Three states increased 1% or less: New York, Georgia and Connecticut. Figure 3 shows each state’s weekly rolling average on May 29th in blue, last week’s (May 22nd) in orange, and the maximum drop at any point from March 1st in gray.
Six states have now exceeded control week travel, with Idaho and Utah joining four states that first exceeded last week. All states but Hawaii (13%) have recovered at least 25% from their maximum weekly rolling average reduction, with 39 states recovering 30% or more. Wyoming has had the largest recovery from its maximum reduction of 57%, from a 36% reduction to a 21% increase.
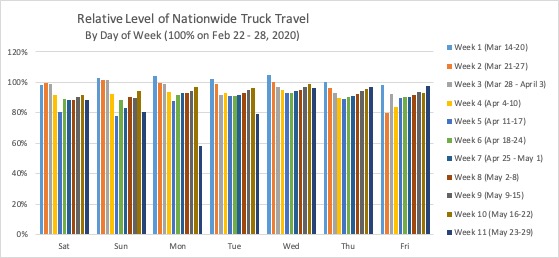
Nationwide Long Haul Truck travel decreased in Week 11, down 13.5%, compared to 4.6% last week, with all states having lower truck travel. As figure 4 shows, Memorial Day weekend significantly skews the trend line, with noticeable declines Sunday, Monday and Tuesday and total travel likely returning to the trend line later in the week.
Metropolitan Area[4] personal travel increased overall again this week, with 88 of the 98 metropolitan areas tracked increasing in Week 11. Only Oklahoma City had a decline of more than 1%, with 1.4%. 21 areas increased 5% or more week over week, led by Pensacola, Florida, up 16% in Week 11. Four areas have now fully ‘recovered’: Mobile, Pensacola, Knoxville, and Corpus Christi. Of the other 94 areas, two have declines in the 40%’s (vs. 3 last week), 10 have declines in the 30%’s (vs. 15 last week), 29 have declines in the 20%’s (vs. 37 last week), 41 areas have declines in the 10%’s (vs. 34 last week), and 12 areas have declines less than 10% (vs. 8 last week).
The ten largest reductions in travel in Week 11 were:
Personal travel has increased 19% or more from peak reduction for all 98 metropolitan areas, with 92 areas more than 25% above their peak reduction level. Honolulu now has the least ‘improvement’ at 19% (vs. 17% last week).
Local fleet traffic in metropolitan areas decreased in Week 11 overall, down 18%, compared to 6% in Week 10. Again, Memorial Day weekend significantly impacted total weekly travel, with Monday in particular being well below a normal work week Monday, as would be expected.
Seasonal Adjustments
According to the Federal Highway Administration, the average daily national vehicle miles traveled in May 2019 was 14.8% higher than the daily average in February 2019.[5] The 16% reduction in nationwide personal travel actually understates the true change in expected travel. In a ‘typical’ year, indices computed in this Synopsis would be expected to naturally rise at/near 15% as our method is not presently adjusting for seasonal variation.
To simplify, for every 84 miles traveled in the US last week, we could have expected 115 miles if not for the virus. Thus, the 19% reduction translates into a roughly 27% reduction, seasonally adjusted. This calculation is included for illustrative purposes and to remind readers that, depending upon when the indices shown in this Synopsis return to ‘normal’ compared to the Control Week, they may or may not indicate full recovery on a seasonally adjusted basis.
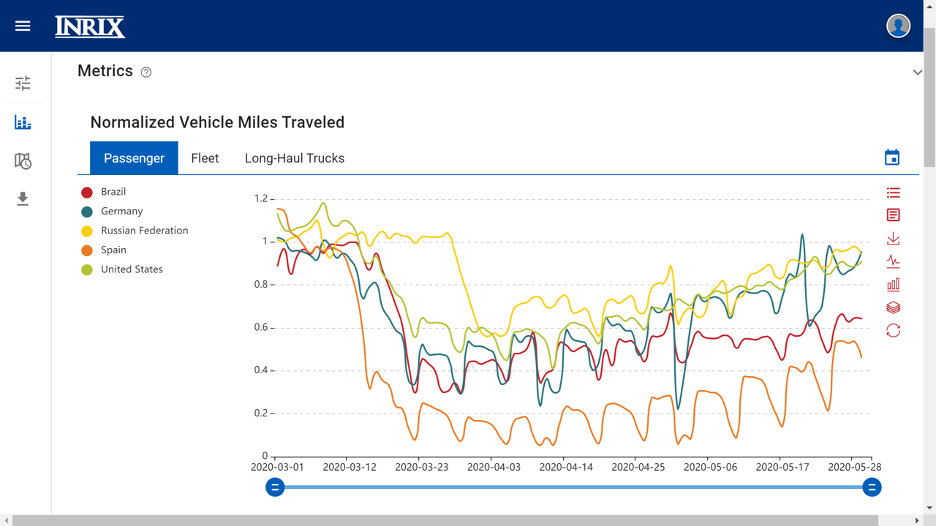
INRIX Trip Trends Dashboard Chart of the Week
Each week going forward, the Synopsis will include a chart from the INRIX Trip Trends Dashboard, a service available for licensing. Figure 5 shows the trends in daily passenger travel in several different countries, including Russia and Brazil, countries with rapidly rising COVID-19 cases.
[1] Previous Issues can be found on the INRIX Blog site
[2] Given the day of week pattern of travel demand, we compare a given day and area to the same day/area in a previous week, and we are using the week commencing Saturday, February 22, 2020 as our ‘control week’
[3] Metadata used is total trip distance of all INRIX Trips originating in the country/state/region each day
[4] INRIX has established 98 metropolitan area geographies for internal purposes; these are the areas used in this analysis
[5] https://www.fhwa.dot.gov/policyinformation/travel_monitoring/tvt.cfm
To learn more about the data behind this article and what Inrix has to offer, visit https://inrix.com/.


Sign up to receive our stories in your inbox.
Data is changing the speed of business. Investors, Corporations, and Governments are buying new, differentiated data to gain visibility make better decisions. Don't fall behind. Let us help.
Sign up to receive our stories in your inbox.
Data is changing the speed of business. Investors, Corporations, and Governments are buying new, differentiated data to gain visibility make better decisions. Don't fall behind. Let us help.