

Welcome to the 17th edition of the PlaceIQ Social Distance Tracker.
Incredibly, we’ve hit the three month milestone of post-COVID life. In that time, we’ve had three distinct phases of foot traffic activity:
Today we’re going to review the Reemergence Ramp, the phase in which we currently find ourselves. We’ll review what categories are reemerging and where, and which categories still remain negatively impacted.
The Reemergence Ramp So Far
At first, the Reemergence Ramp was so subtle it was obscured by Easter and Mother’s Day. At the time we assumed upticks in traffic were momentary blips driven by these holidays. But as May played out the trend was clear as day:
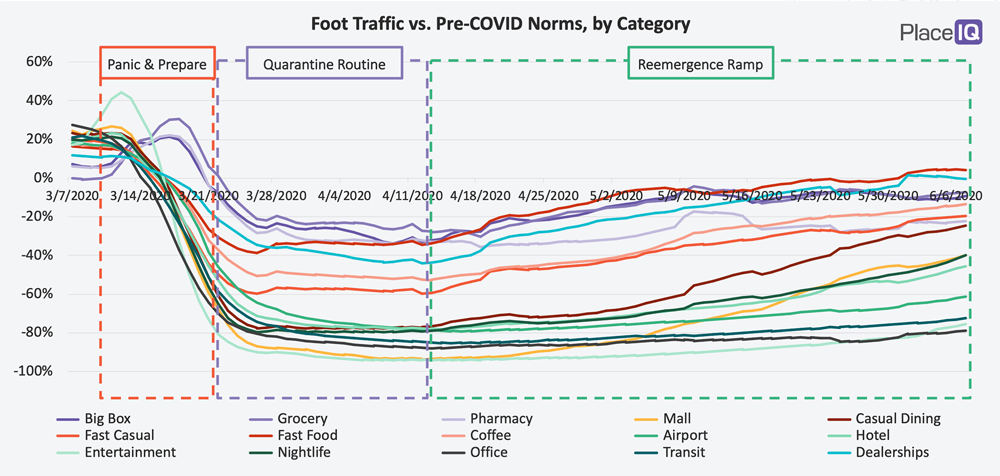
In retrospect, the holiday traffic blips likely kicked off the climb: people ventured out more than usual due to the holiday, felt like they could safely emerge a bit more, and began relaxing their quarantines in varying degrees. Businesses which were open – but had yet to find traction – such as coffee shops and fast casual restaurants, began to pick up significantly as customers expanded their comfort zones.
While the first half of the Reemergence Ramp kicked off without official opening orders, the second half was clearly influenced by state regulations beginning to lift. At the end of May and beginning of April, a smattering of states ended their stay-at-home orders. This allowed four categories to begin participating in the Reemergence Ramp: casual dining, shopping malls, nightlife, and hotels.
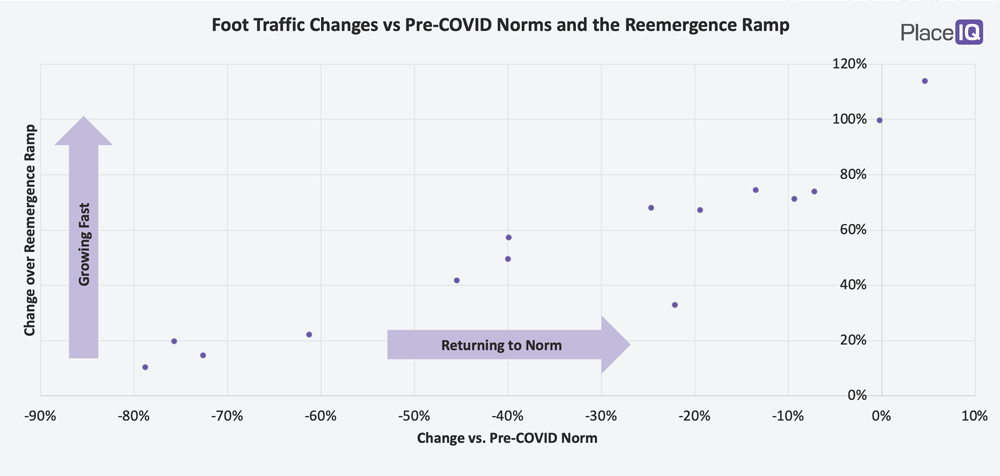
We can dive further into the themes of reemergence by segmenting categories by their recovery and velocity. Simply put: how far away is a category from its pre-COVID norms and how quickly is it approaching that milestone? We can visualize this dynamic in the following way:
Cluster 1: Still Empty
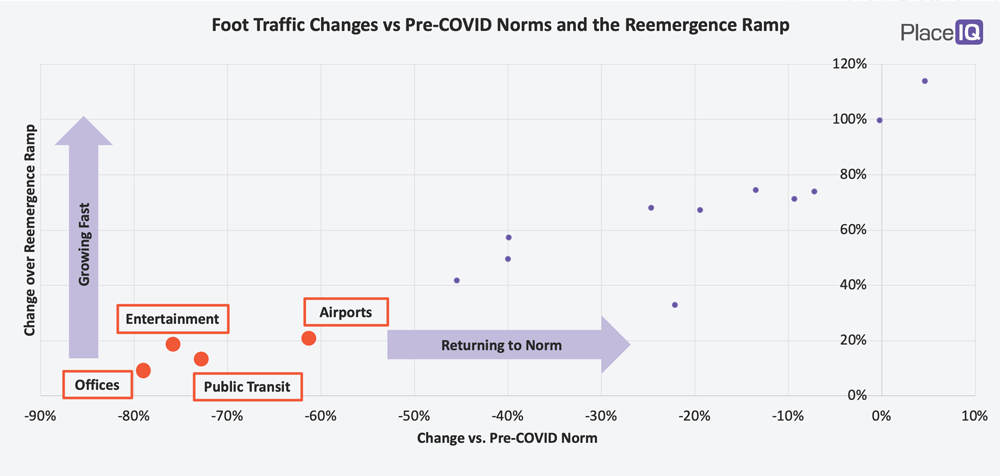
The first cluster are the businesses which are still empty: airports, entertainment, offices, and public transit hubs. They are all below -60% vs their norms and barely growing at all.
In many regions entertainment venues remain shuttered. The dense events they host are on hold or canceled, as governments continue to restrict large gatherings. But airports and public transit are (and have been) open. Despite this, they continue to be avoided by most, as they have been since March, representing a key example of our assertion that re-emergence will happen via both mandate and consumer comfort levels.
What to Watch for:
Cluster 2: Beginning Reemergence
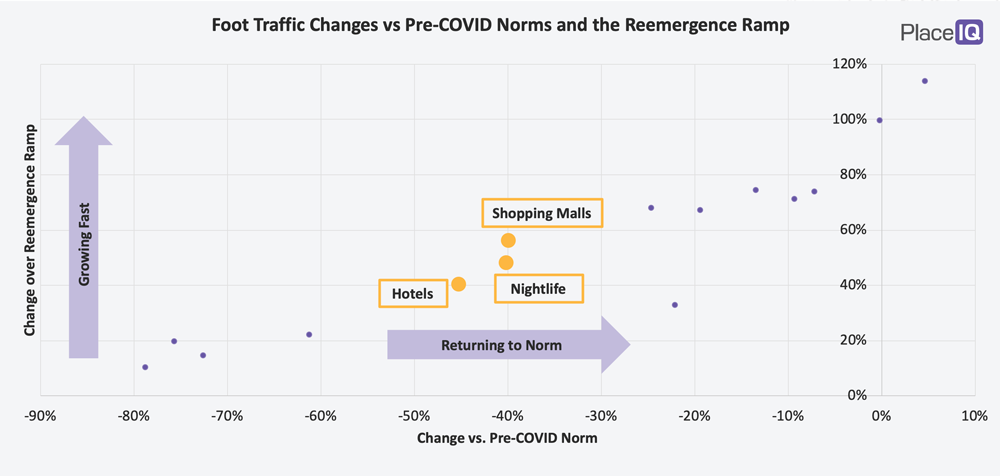
The second cluster are those categories which are beginning reemergence following the lifting of official orders: shopping malls, hotels, and nightlife venues. They are still far from their pre-COVID norms but are picking up steam.
What to Watch for:
Cluster 3: Steadily Reemerging
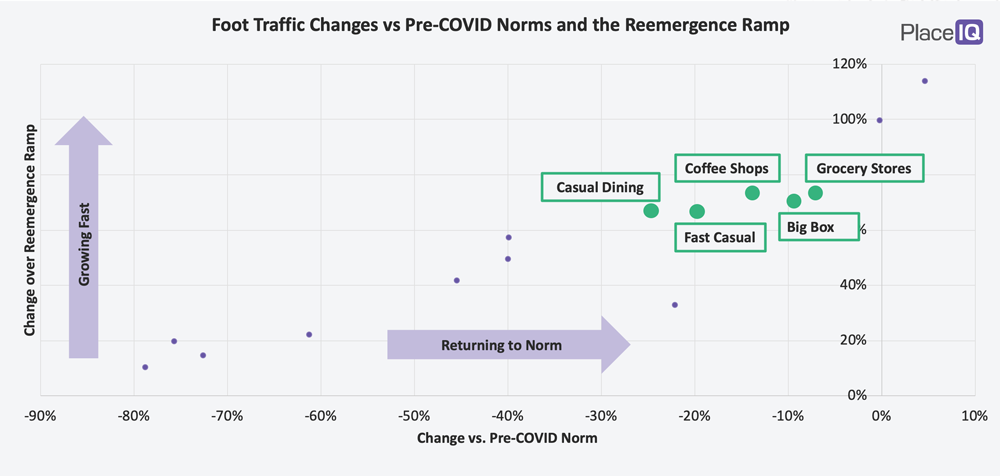
The third and final cluster are categories steadily reemerging. These businesses have nearly returned to their pre-COVID norms and are quickly approaching this milestone: grocery stores, big box, coffee shops, fast casual, and casual dining.
This category is interesting in that they share fast growth rates but are spread out across a relatively wide range of recovery. Casual dining remains ~25% below their norms while grocery stores are less than 10% below their norms. It will be interesting to see if this group tightens up as the dining category catches up to these essential retailers.
What to Watch for:
The Outliers
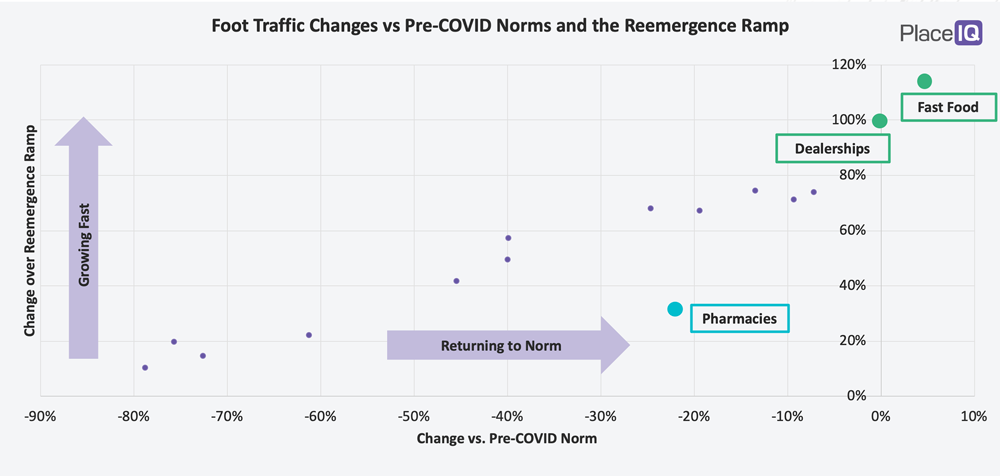
When analyzing data, you continually reframe your figures. Much of analysis is this: forming a hypothesis, constructing a visualization or metric to test the theory, then shifting your approach as your idea is supported or undercut. It’s a cycle of deductive attrition that we continuously engage in with strategic data users. The goal is to step closer and closer towards a clear insight that you can use to understand, plan, strategize. You’re looking for sustained patterns, but also where clear patterns break down.
With this visualization our metrics correlate very well and our categories cluster nicely. Except for fast food restaurants, auto dealerships, and pharmacies. These businesses are outliers.
We believe fast food restaurants are experiencing such high demand because they are nearby, safe, and affordable entertainment. It’s an easy option when you need to get out of the house. And categories that can match these attributes (see: beaches) will continue to grow beyond pre-COVID norms, absorbing foot traffic from categories that are not nearby, safe, and cheap.
So, what’s going on with auto dealerships? We’ve discussed this with our partners in the auto industry and have some theories to share in our next issue. Please stay tuned!
To learn more about the data behind this article and what PlaceIQ has to offer, visit https://www.placeiq.com/.


Sign up to receive our stories in your inbox.
Data is changing the speed of business. Investors, Corporations, and Governments are buying new, differentiated data to gain visibility make better decisions. Don't fall behind. Let us help.
Sign up to receive our stories in your inbox.
Data is changing the speed of business. Investors, Corporations, and Governments are buying new, differentiated data to gain visibility make better decisions. Don't fall behind. Let us help.