
In our latest report, “European Passenger Travel During COVID-19,” we identified travel trends across Europe since COVID-19 hit the continent earlier this year. INRIX Trip Trends allows users to view and analyze vehicle-miles traveled (VMT) in cities and countries across Europe, allowing a quick look at travel as events unfolded. This, when paired with travel speeds and incidents, provide a unique insight into how travel behavior has been affected by the outbreak.
We found that VMT fell across Europe, especially during the three-week span at the end of March and early April, with the UK, Spain, Germany and France all hitting their lowest VMT recorded. In the UK specifically, VMT fell by 56% in during the week of 23 March alone.
While the report reveals that UK VMT has grown slower than its European neighbors, this blog seeks to provide readers with better understanding of how key events affected travel in the UK, how London stacks up to other capital cities, and the travel time and speed impacts of a lower VMT across the country.
United Kingdom Daily VMT Timeline
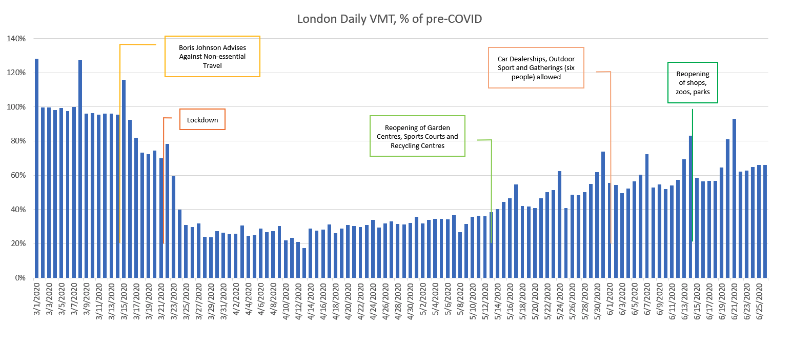
As expected, the lockdown caused a dramatic drop in VMT across the United Kingdom. It stagnated for about a month, then began to rise throughout May and June with the reopening of recreational sites and retail locations. Notably, weekend travel remains strong across the UK.
Cities
Many cities across Europe have yet to recover to pre-COVID levels of travel, despite 10 out of the 19 countries analysed in the study reaching theirs.

Berlin, for example, saw VMT drop similarly to London and New York by the week of 23 March, yet began its higher trend upwards almost immediately, whereas London and New York grew at a steadier pace. Paris’ ascent, on the other hand, was bolstered by an 87% jump the week of 11 May, when the French government eased its lockdown and began reopening.
Speeds & Travel Times
VMT & Speed Changes from Feb Baseline
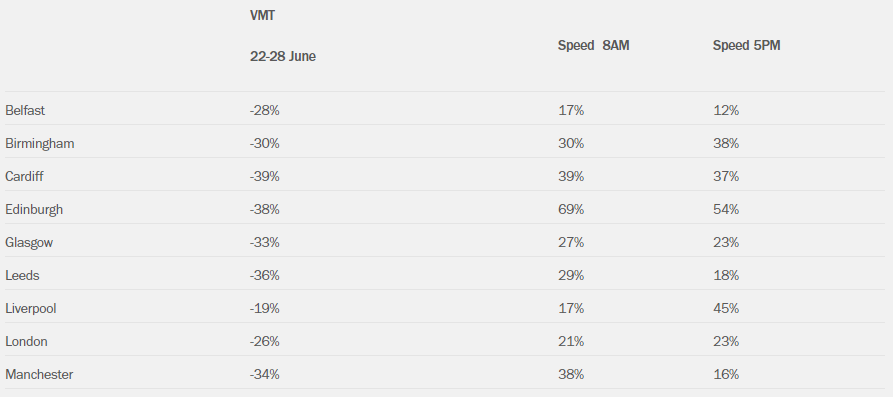
The effects of reduced VMT are reflected in lower travel times and faster vehicle speeds across the UK. By June, drivers around Edinburgh saw the largest speed increases out of all cities studied, with a 69% jump in speed during the 8:00AM rush hour, while drivers in Belfast during the afternoon commute saw a 12% increase in travel speeds.
However, as VMT continues to grow, travel speeds have started to retract. Speeds around London have fallen from their April highs significantly (when VMT was at its lowest point), dropping 26% in the AM commute and 36% in the PM commute. Despite the drops in speeds, however, rush hour travel is still more than 20% faster in June than it was in February.
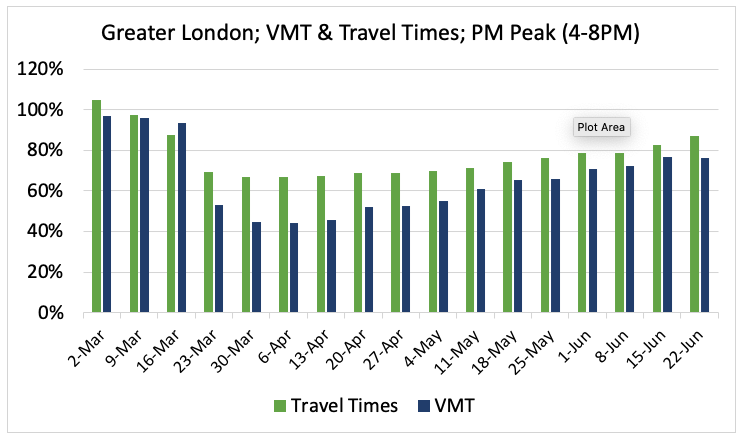
Combining INRIX travel time and vehicle miles driven data allows us to analyse how future increases in VMT may affect travel times. For example, the chart above visualizes weekly travel since the week of 2 March. After reaching a low during the week of 6 April, VMT has increased 73%. Yet travel times have only increased 24%. This indicates that VMT growth is currently relatively inelastic, where an increase in VMT equates to a smaller increase in travel times. This will likely shift as economies continue to reopen and people return to commuting to work, to relatively elastic, where a small increase in VMT will lead to larger increase in travel times.
As cities continue to rebound from COVID-related lockdowns, traffic congestion will continue to rise. However, depending on permanence of telecommuting habits, online shopping/retail and automobile, public transport and cycling use, the intensity of congestion may not reach ‘normal’ levels for a while.
To learn more about the data behind this article and what Inrix has to offer, visit https://inrix.com/.


Sign up to receive our stories in your inbox.
Data is changing the speed of business. Investors, Corporations, and Governments are buying new, differentiated data to gain visibility make better decisions. Don't fall behind. Let us help.


Sign up to receive our stories in your inbox.
Data is changing the speed of business. Investors, Corporations, and Governments are buying new, differentiated data to gain visibility make better decisions. Don't fall behind. Let us help.