

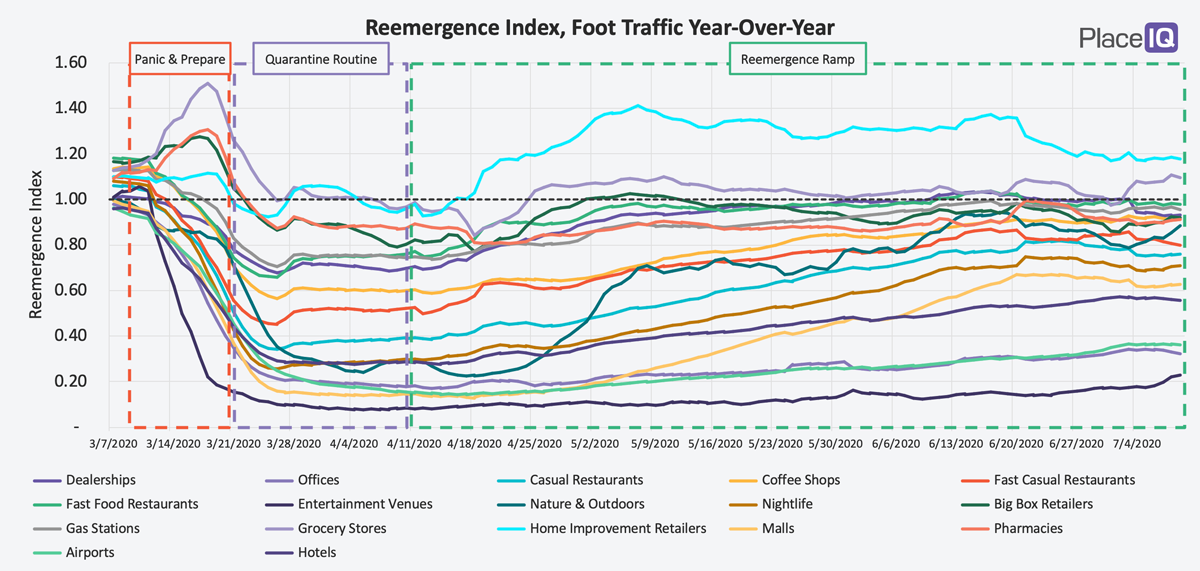
We’re not quite ready to call it a new phase in our quarantine life, but the Reemergence Ramp has largely plateaued in recent weeks. The change kicked in around June 20th, as we saw regional upticks in cases throughout the south and west, and has persisted through some holiday spikes. We’ll dive into the slowdown of traffic in more detail below.
We’ll also be taking a look at how consumers who continue to isolate differ from those that are more rapidly reemerging. One of our primary findings has centered on the sheer complexity of reemergence. We took this challenge as a prompt to build new strategic audiences which allow marketers to segment audiences by propensity to reemerge, helping them to focus investments and manage the county-level complexity we’ve been observing. It’s these audiences our analysts have cracked open to better understand and share with you today.
Reemergence Takes a Rest
The rise in cases throughout the Sunbelt over the last few weeks has significantly softened foot traffic across America. Looking at national trends from June 20th onward, we can see traffic halting its advance and in some cases receding:
If we look at the rolling trends compared to the prior week, we can see that dining traffic is receding across the category:
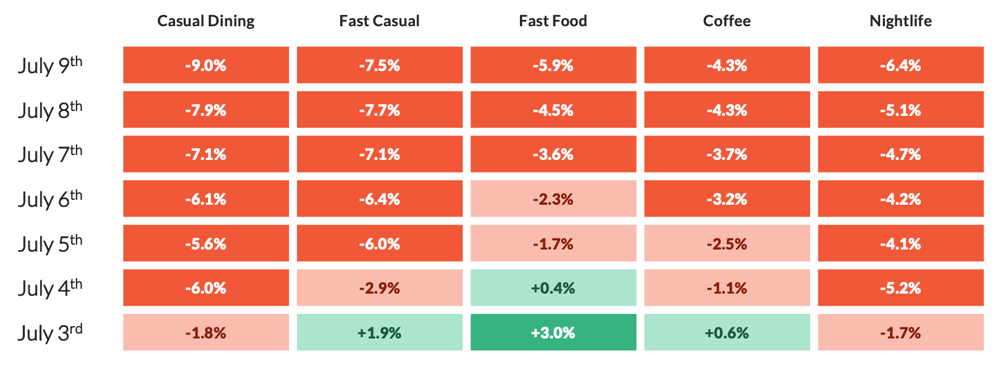
The percent change in foot traffic is calculated by comparing the average foot traffic volume over the past 7 days to the 7 days prior.
Across the retail sector, it’s more of a mixed bag. Mall traffic, perceived as the least essential of the bunch, is following dining’s trajectory:
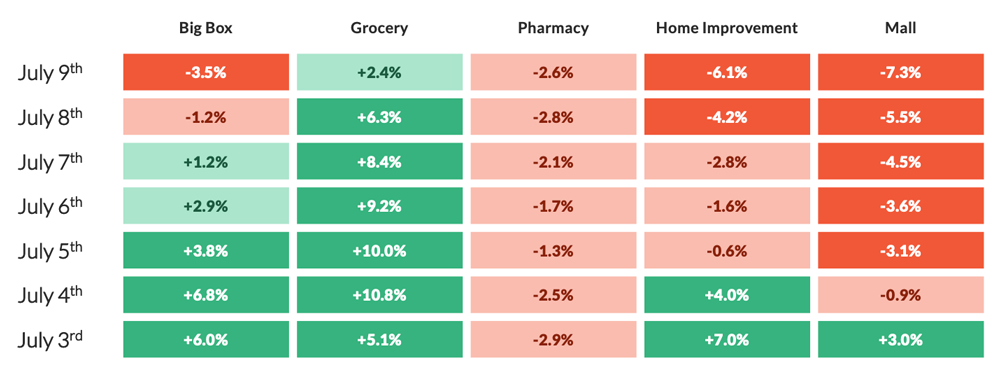
The percent change in foot traffic is calculated by comparing the average foot traffic volume over the past 7 days to the 7 days prior.
Dining’s decline is partially due to coming off slight spikes on July 3rd, when many opt to eat out rather than wade through another round of dishes prior to the big cookout. Interestingly, that blip didn’t hit the high-water mark set on 6/21.
Dining’s walkback in the face of significant case gains is real and persistent. Though, as usual, the story is more complex once we get to the county-level.
Dining Reemergence, Week 28
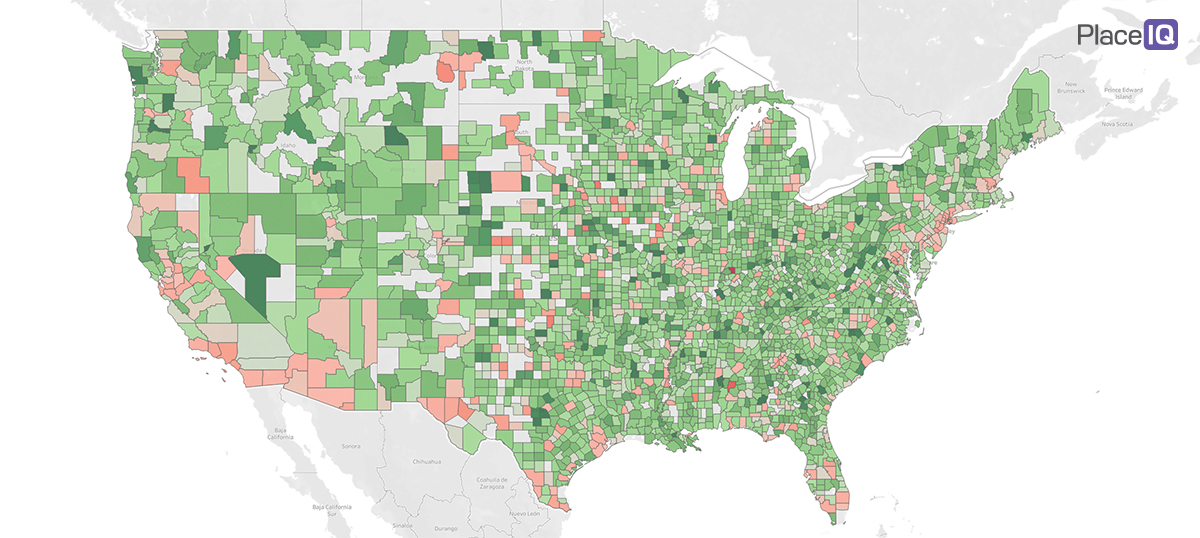
Unlike during the initial phases of traffic decline, the trends are mixed at the county level. In the dining example above, we see foot traffic returning to or exceeding 2019 levels in most counties. This is not a full pause, but one unevenly distributed across the nation. Traffic remains much higher than the Quarantine Routine phase, but we’re clearly entering a new era of the Reemergence Ramp with fewer gains and more stagnation.
The picture is still geographically complex, with no consistent patterns dictating how and where reemergence will take place next week. We are however seeing some consistent divides among the audiences we’ve built to deal with this challenge.
How Are Isolating Audiences Different from the Reemerged?
Recently, our analyst and product teams released a new suite of audiences to help marketers deal with the patchwork quilt pictured above. These Reemerging Audiences segmented devices and households into those Still Isolating, those Cautiously Reemerging, and the Reemerged by comparing their current activities to their pre-COVID norms.

Strictly Isolating
Households which are staying in as much as possible, taking little to no trips to essential businesses.

Cautiously Reemerging
Households which are beginning to visit essential businesses at an increased rate.

Reemerged
Households which are frequently visiting essential businesses and visiting newly reopened businesses.
Since their launch, many marketers have been using them to tailor their messaging (for example: “order online” to the Isolating, “pick up in store” to the Reemerged) or increase the efficiency of their campaigns (no need to market to the Isolating if you’re running an in-store promotion).
This week, our analysts took a look at the behavioral differences between each group. We knew the Isolating were shopping less than the Reemerged, but we wondered if there was any further nuance to their behaviors that could be useful for marketers.
Reemerged Household Behavior Compared to Isolating Households
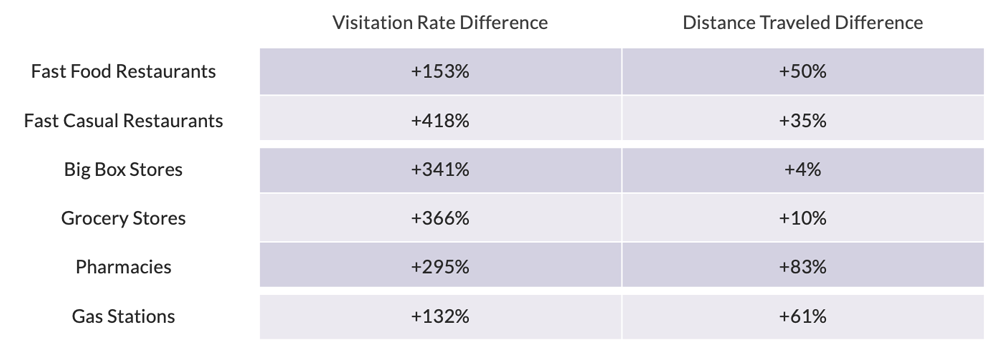
The percent change for Visitation Rate Difference describes the number of visits Reemerged Households make compared to Isolating Households. The Distance Traveled Difference describes how much further Reemerged Households travel compared to Isolated Households.
Let’s start with the left column, ‘Visitation Rate Difference.’ We knew Reemerged households were more active than Isolating, but it’s still startling to see by how much. Reemergent audiences will visit retailers and restaurants more often by multiple factors. And we’re not including non-essential categories here (like malls), which Isolated audiences are defined as explicitly not visiting.
Looking at the right column, ‘Distance Traveled Difference’, we can see that Isolated audiences prefer to stay much closer to home, especially when dining. With big box, however, the difference is negligible: Isolating households will drive as far as the Reemergent to visit Costco or Walmart because they’re bulk-buy stops which allows them to reduce their total retail trips.
As we covered last week, the Isolating aren’t making convenience-driven ‘mission’ trips to convenience store retailers like pharmacies or gas stations. They visit these retailers less and won’t go out of their way to shop there.
The general split between these two groups isn’t surprising, but the magnitude of their differences is. Our recommendations: for business strategies or ad campaigns reliant on in-person visitation, we recommend that clients prioritize those people actively reemerging. To reach those still isolating, ensure your messaging is relevant for those seeking contactless pick up, online or delivery options. For access to PlaceIQ’s reemergence audiences, please reach out to your Account Manager to make them available in your preferred DSP, search, or social platform.
To learn more about the data behind this article and what PlaceIQ has to offer, visit https://www.placeiq.com/.


Sign up to receive our stories in your inbox.
Data is changing the speed of business. Investors, Corporations, and Governments are buying new, differentiated data to gain visibility make better decisions. Don't fall behind. Let us help.


Sign up to receive our stories in your inbox.
Data is changing the speed of business. Investors, Corporations, and Governments are buying new, differentiated data to gain visibility make better decisions. Don't fall behind. Let us help.