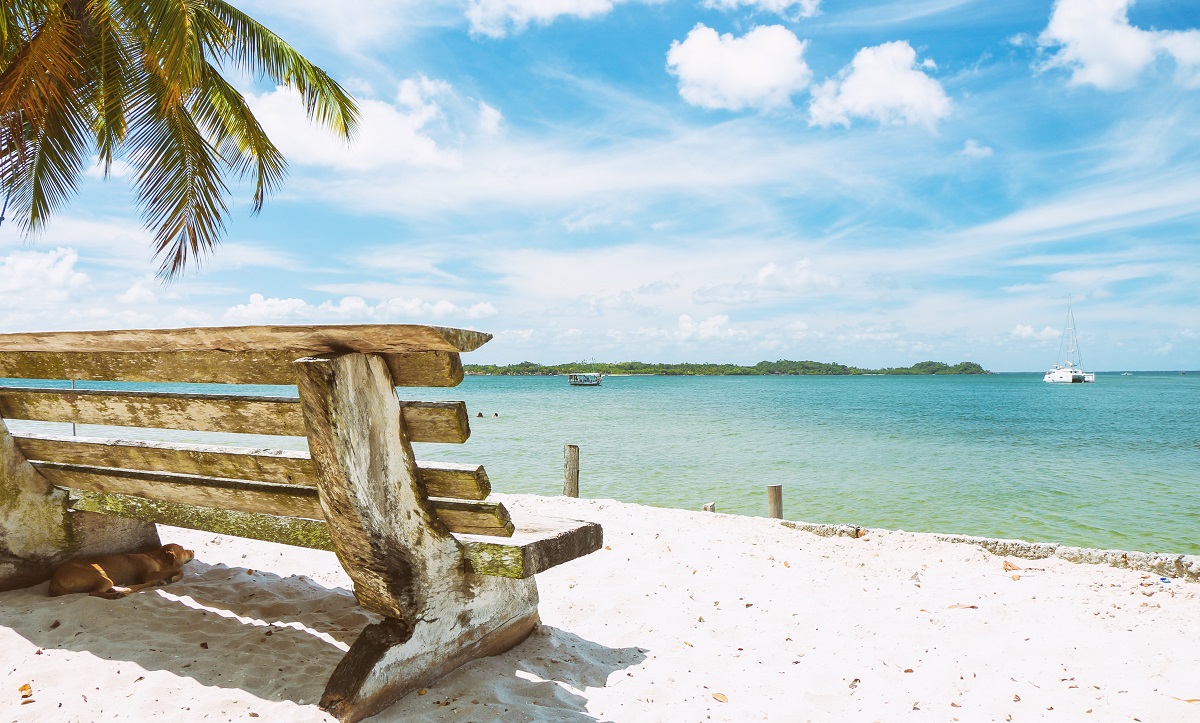
You don’t need a data analyst to tell you people are going outside a lot more these days. Camping sites are nearly impossible to come by. You can’t find an RV to rent. Bikes are sold out everywhere. These trends illustrate a pattern we’ve observed during COVID: if an activity is nearby, safe, and cheap people will flock to it. Beaches and forests are often within driving distance, outdoors, and (generally) lend themselves well to social distancing. This is a summer of road trips.
Today we’ll take a look at how the rush to the great outdoors manifests in our data and how it compares to other activities. We’ll also review current trends which show traffic halting its declines, perhaps finding an equilibrium for our current state of affairs.
Summer Road Trips Kick Off
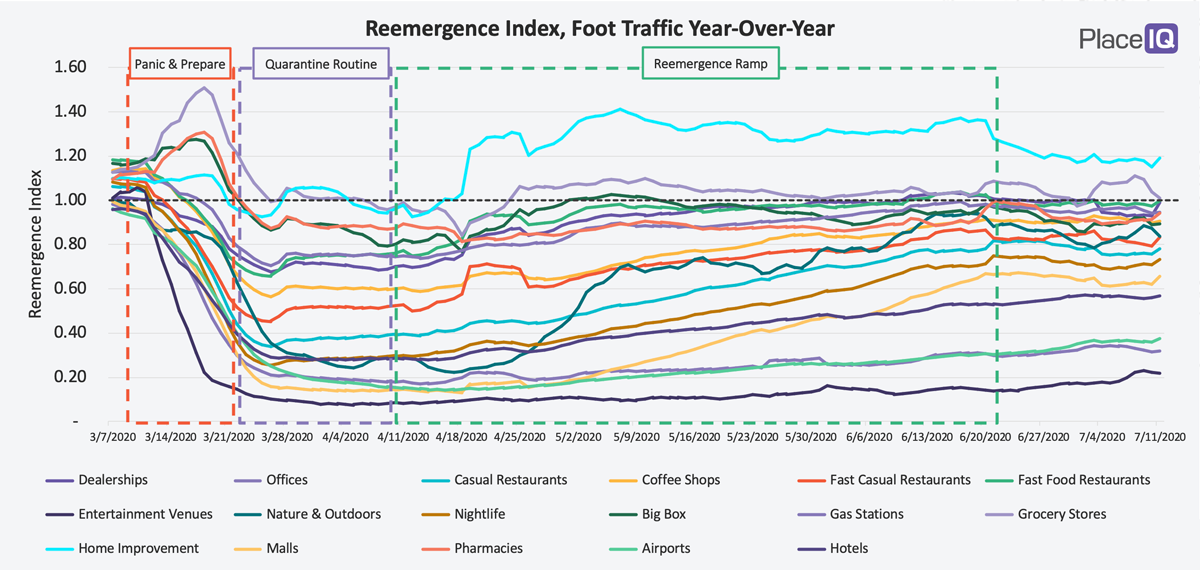
Over the past couple months, activities outside have been logging impressive amounts of foot traffic. While the usual entertainment fare — movie theaters, theme parks, nightclubs — have regained only a fraction of their usual traffic, the great outdoors has routinely pulled figures at or above 2019 levels. Beaches in particular have been persistent, often hitting gains of 40% year-over-year:
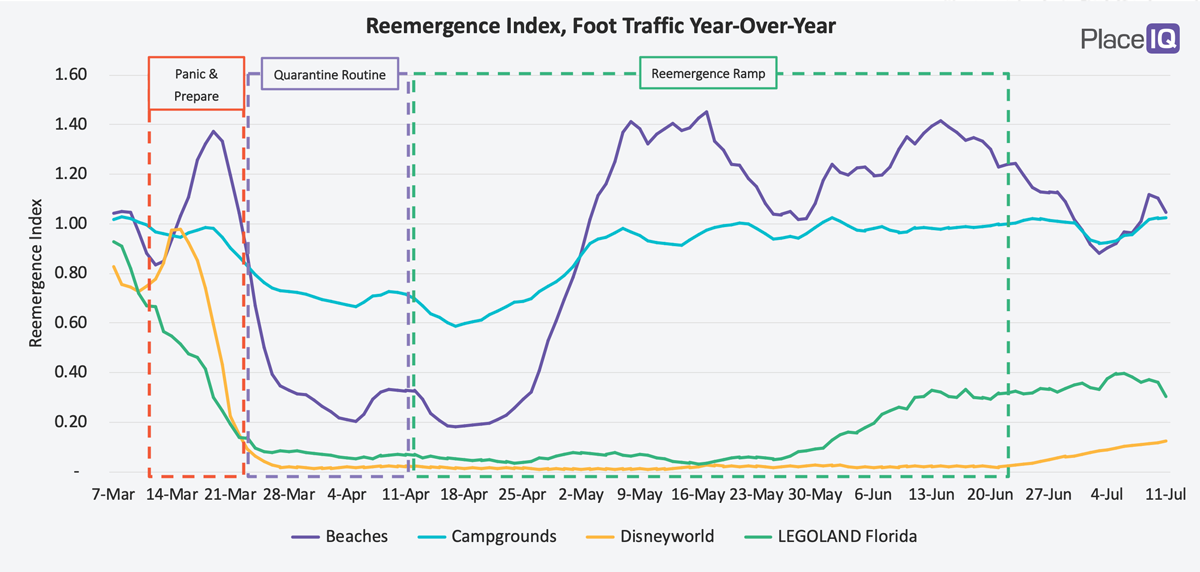
As you can see, ever since we left the Quarantine Routine, outdoor activities have been a popular option: they’re affordable, relatively safe, and often nearby. Beach and camping activities are thriving. However, we’re not seeing campgrounds exceed their 2019 norms. This is largely because the campgrounds we’re tracking in our index above are those affiliated with state parks, national parks, and other usually in-demand destinations. They book up every year, and 2020 is no different.
Normally, we might expect our usual tourism fare to steal some of the share as they come back online. In the plot above, we can see a trickle of activity as Disneyworld prepped to open, which occurred the very last day in the figure above. We were surprised to see LEGOLAND Florida on the map with less than 40% of their usual traffic for the past month. Turns out they’ve been open! LEGOLAND gives us our first clue that amusement park foot traffic isn’t likely to come rushing back, even when the Disneyworld data rolls in.
The other clue that the great outdoors are “here to stay” is that we’re seeing people start to travel further to visit new outdoor locations. Check it out:
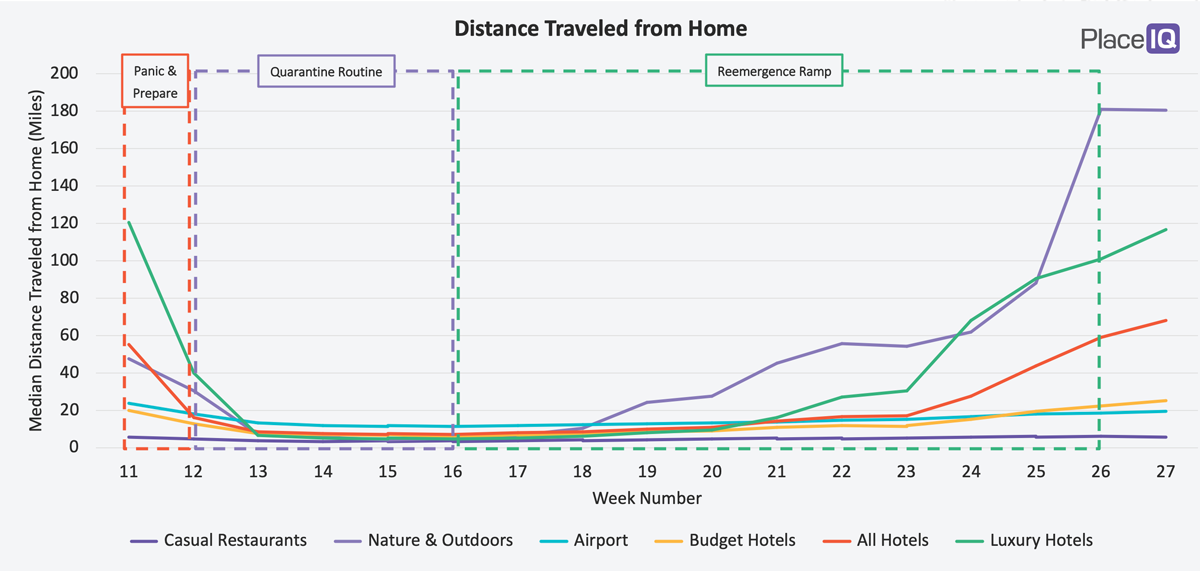
The y-axis in the plot above is the median distance a device traveled from the household to visit a destination. The x-axis is the week number of 2020. For this plot, we’ve selected a variety of vacation destinations, with Casual Restaurants included to add context.
As you can see, people barely ventured out of the immediate vicinity during the Quarantine Routine and the first quarter of the Reemergence Ramp. Foot traffic to airports and hotels was miniscule during this period, and those who did visit were sticking close to home.
Keep in mind: the y-axis here has nothing to do with how much foot traffic each category was receiving at this time. But, if you’re curious:
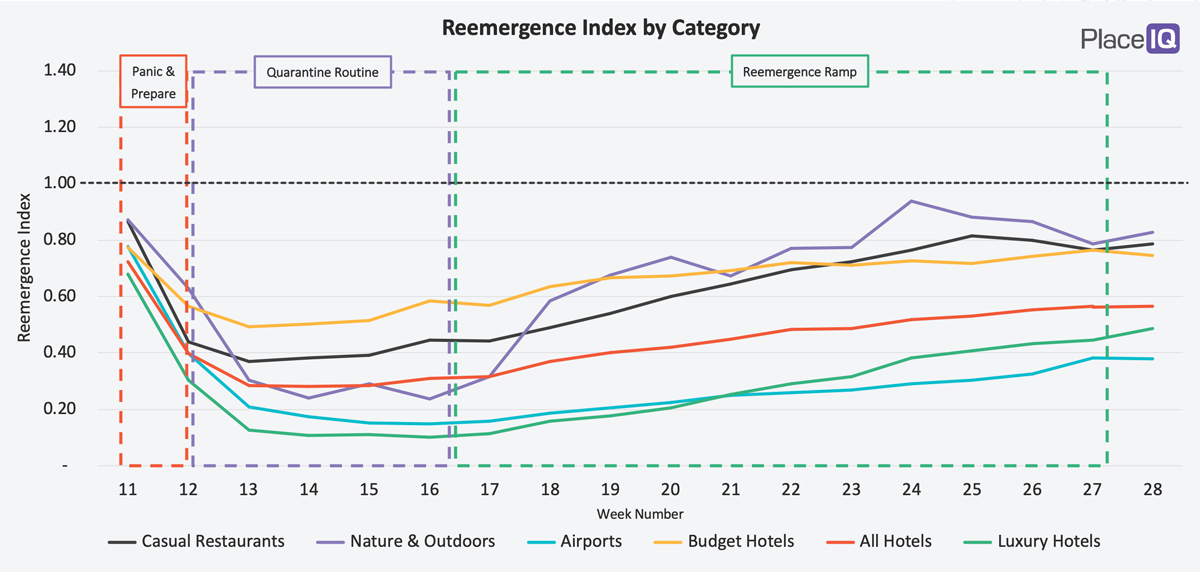
The “Nature and Outdoors” category here contains venues including beaches, campgrounds, parks, and gardens (which is why its index is slightly lower than our beach and campground figures above). It is consistently above 75% of its 2019 levels from the beginning of May onward.
Keep that in mind as you review the distance traveled chart above: traffic returned to the outdoors starting in May. During that month, the median distance people ventured to go to these destinations was 20 to 60 miles. But as we entered June, foot traffic crept slightly upwards as driving distance grew significantly. By late June, with summer feelings in full swing, the median distance driven to outdoor areas was over 180 miles. People aren’t growing tired of the outdoors, they’re actively seeking more of it.
This presents an opportunity for marketers to adjust and meet consumers where they are (and where they’re going). Reach consumers while they’re making Summer travel decisions, when they’re shopping for vacation essentials, or when they’re on the road and in need of sustenance, entertainment or supplies.
While airport foot traffic is slightly up, it’s not up enough to account for the outdoor trend. We’re looking at weekend and week-long road trips to outdoor destinations. Which might explain why the driving distance to hotels is up in the same timeframe — while airport driving distances remain abysmally short.
A New Phase of Social Distancing
You might have noticed in the charts above: we’re calling the end of the Reemergence Ramp. We’ve now been through 3 distinct phases, each marked by their own unique foot traffic behaviors:
Since June 20th, traffic has ceased to grow. We can’t be in the “Ramp” anymore because our current trends look more like a plateau:
So far, the defining quality of this era is hesitation. Traffic is going up and down from day to day, but in relatively small amounts. Further, regional patterns continue to be a complex patchwork of reemergence and re-sheltering. Hopefully the picture will improve with more data as we get further away from the abnormalities of Fourth of July weekend.
(You may note we don’t have a clever name yet for this plateau. Suggest any you might have. So far our only nominations have been inspired by frustration and not quite ready for print.)
To illustrate the hesitancy we’re seeing, let’s look at the current trends:
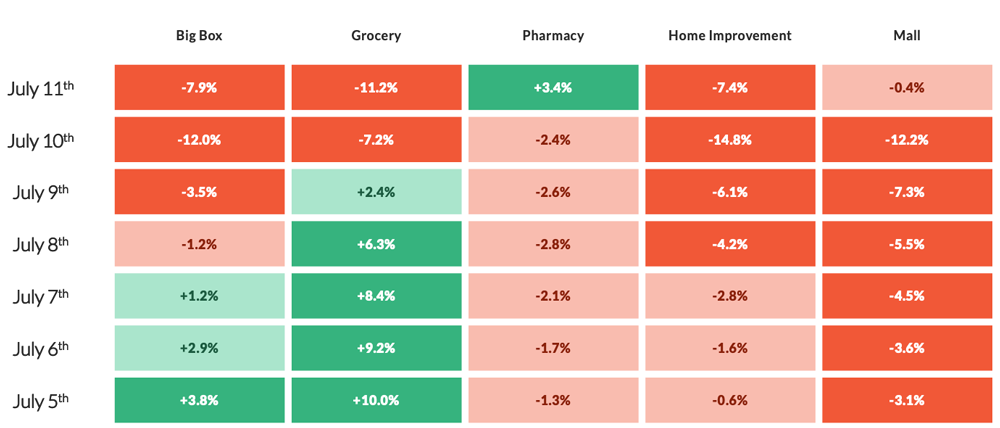
As mentioned earlier, we’re just now getting out of the shadow of the Fourth of July. July 11th is the first day not including the holiday in it’s look-back window, which explains some of the abrupt changes we see this week.
In the retail figures above we can see pharmacies have halted their declines and groceries are starting to revert to their norms after a surge for the holiday. Home Improvement’s decline is sustaining, though still well above 2019 norms.
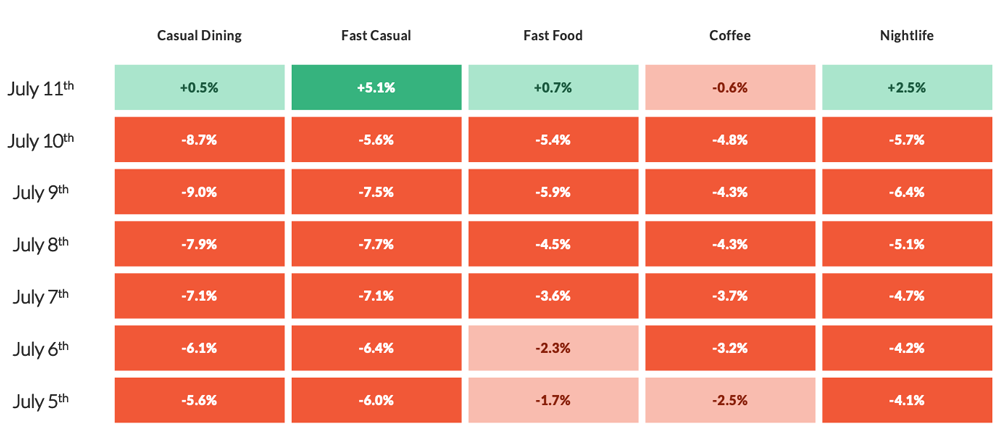
Across the category, dining has found some equilibrium. Every category has significantly slowed its negative trend and may be finding a new floor. Though given the ‘hesitancy’ we keep mentioning, we’ll have to stay tuned to see if this sticks.
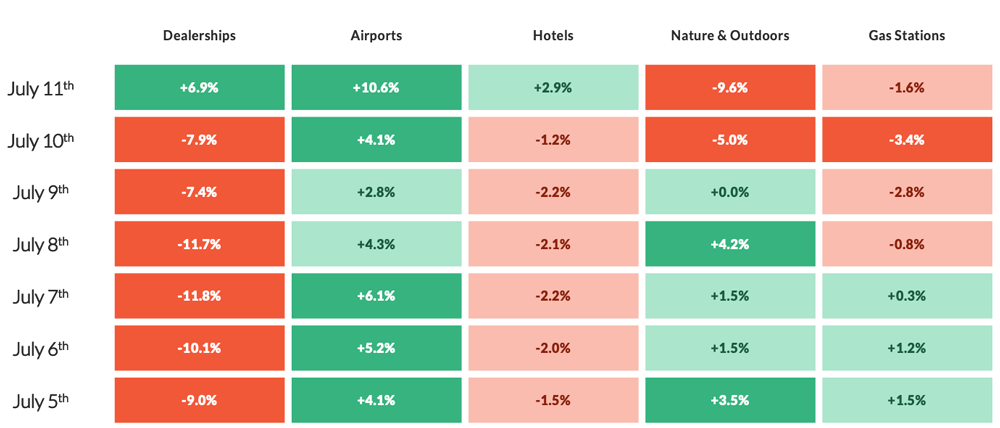
Dealerships, which had been remarkably resilient since April before going negative in July, are also finding their footing and ceasing their decline. Gas station traffic has equalized, hinting the road trips we discussed above are no longer growing in volume…which the Nature and Outdoors trendline supports. All categories here will be clearer early next week when the Fourth is truly out of our sights, but until then we’re seeing hints at what normal might look like for now.
To learn more about the data behind this article and what PlaceIQ has to offer, visit https://www.placeiq.com/.


Sign up to receive our stories in your inbox.
Data is changing the speed of business. Investors, Corporations, and Governments are buying new, differentiated data to gain visibility make better decisions. Don't fall behind. Let us help.


Sign up to receive our stories in your inbox.
Data is changing the speed of business. Investors, Corporations, and Governments are buying new, differentiated data to gain visibility make better decisions. Don't fall behind. Let us help.