Introduction
Welcome to the August 2020 National Apartment List Rent Report. As the number of new COVID-19 cases spiked back to alarming record levels through the course of July, the gradual process of reopening the economy and loosening social distancing guidelines was put on pause and even reversed in some parts of the country. And although the unemployment rate has come down from its peak, a record number of Americans still remain out of work, with new unemployment claims continuing to top one million per week. It has become clear that the effects of the pandemic are far from behind us, and the economy does not appear on track for the quick V-shaped recovery that many had originally hoped for. While this economic weakness continues to be reflected in sluggish rent growth, our national rent index actually inched up slightly by 0.1 percent over the past month, the first monthly increase since the start of the pandemic. That said, year-over-year growth still stands at just 0.2 percent nationally, and many markets are continuing to see notable declines in prices.
Rents tick up nationally, but growth remains sluggish
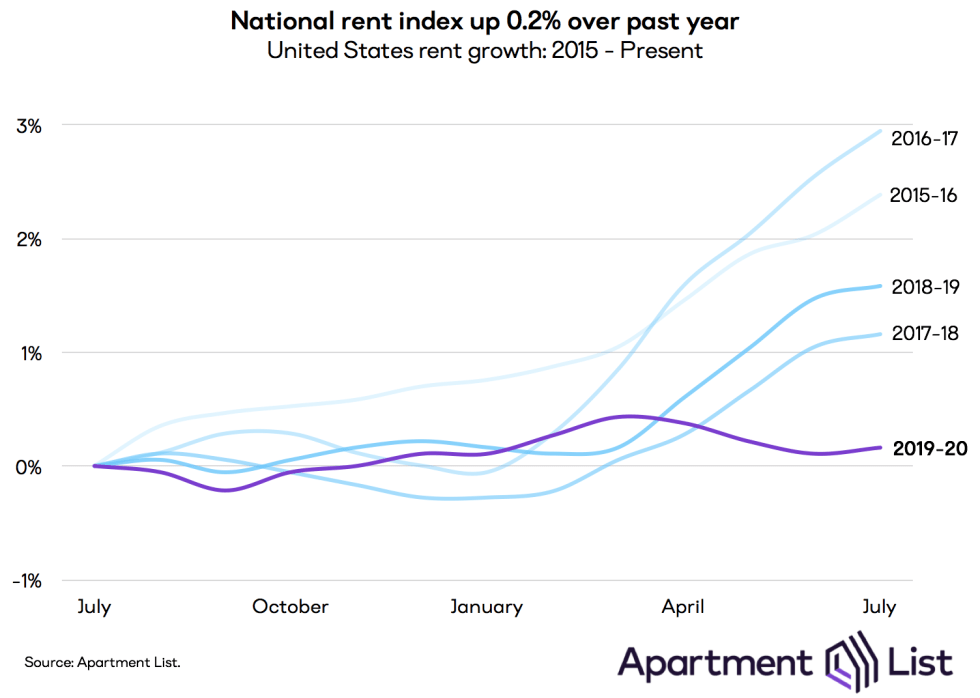
From June to July, our national rent index ticked up for the first time since March. Despite the 0.1 percent month-over-month increase, our national index has still experienced a cumulative decline of 0.3 percent since the pandemic began. While this dip may seem modest, it is occurring at a time of year when rent growth is normally at its fastest due to seasonality in the market. Rent growth from March to July has ranged from 1.1 percent to 2.1 percent in prior years, going back to 2014, when our rent estimates begin. And over the entirety of the past year, our national index has increased by just 0.2 percent. This is by far is by far the lowest year-over-year growth rate that we’ve observed in July over any of the past five years, as shown in the chart below. The fact that we’re seeing rents decrease at what is normally the peak season for rental activity is reflective of the financial hardship and shifting preferences being imposed by the pandemic.
The recent softness in the market that can be broadly attributed to two major factors:
Property owners are beginning to respond to these new realities by offering lower prices in order to fill vacancies. The overall decline in our national index is still fairly modest, and is now showing signs of levelling off, but this masks significant variation across markets. Prices are responding much more rapidly in the most heavily impacted parts of the country, which we explore below.
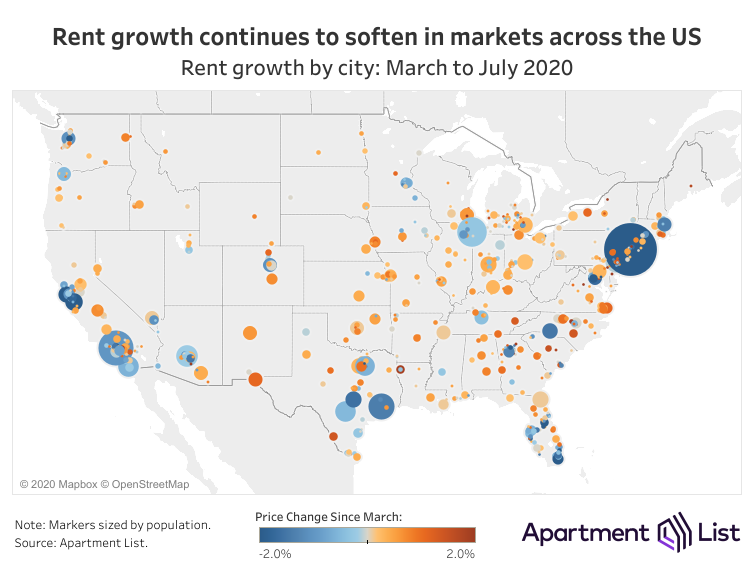
Expensive markets and tourism-driven economies show biggest declines
Market-level data give us a clearer picture of what some cities are experiencing more dramatic rent declines. Of the 100 largest cities for which we have data, 48 have seen rents fall or hold steady since the start of the pandemic in March.
The cities experiencing the biggest dropoff in rent prices generally fall into two major buckets:
The first group is typified by Orlando (-2.1 percent rent decline since March) and Miami (-2.0 percent rent decline). As tourism ground to a halt at the onset of the pandemic, we predicted these cities would be particularly vulnerable because they have the 2nd and 3rd highest shares of workers facing extreme employment risk. Today, with a significant share of households now facing financial hardship, landlords have begun to lower rents in order to attract qualified renters to fill their vacancies. Houston represents another example of this trend. While these cities have had some of the largest rent declines since the start of the pandemic, prices were actually up slightly by 0.2 month-over-month in Orlando. Meanwhile, Miami and Houston had fairly modest declines of 0.3 percent and 0.2 percent, respectively. Even in some hard-hid markets, rents are beginning to level off.
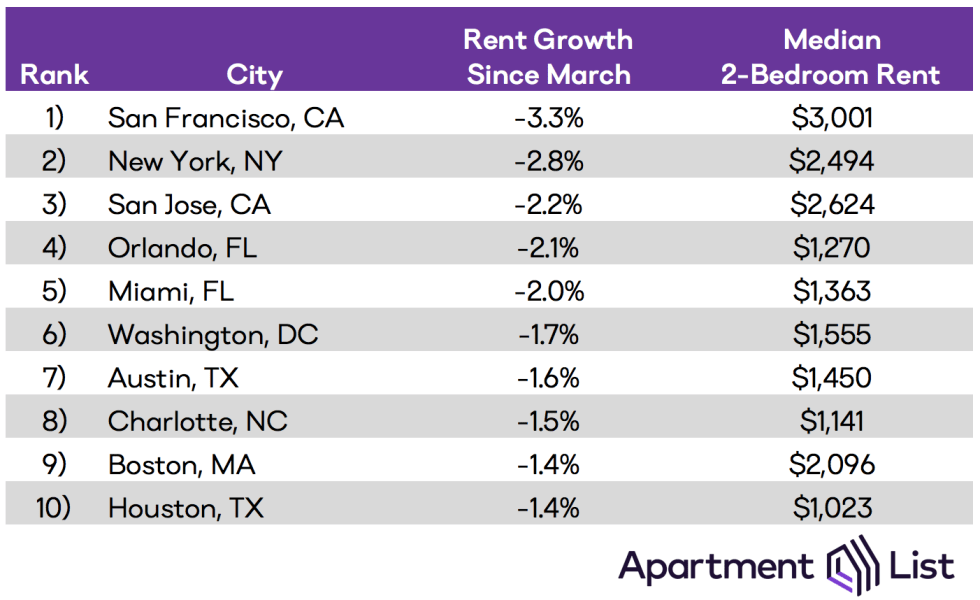
That said, in the city that has seen rents drop fastest since the start of the pandemic, prices are continuing on a downward trend. Despite having an outsized share of its workforce employed in the tech industry – where the transition to remote work has largely been a smooth one – rents in San Francisco fell by an additional 1.1 percent from June to July, and have now declined by 3.3 percent since the start of the pandemic. This seems to be driven by the fact that the median rent in San Francisco is the highest in the country, at $3,001 for a 2-bedroom. Similarly, San Jose and New York City have the 2nd and 3rd most expensive rents in the country, and also round out the top three biggest price drops in recent months. As layoffs expand beyond the service industry and into white collar occupations, landlords in these markets appear to be responding to a lack of demand for high-priced rentals.
In San Francisco, rents are falling fastest in the core city
Delving a bit deeper into the data for San Francisco specifically, we notice an interesting nuance in rent changes throughout the region as a whole. Specifically, while the city of San Francisco has seen rents come down by 3.3 percent since March, surrounding regions have experienced more modest declines.
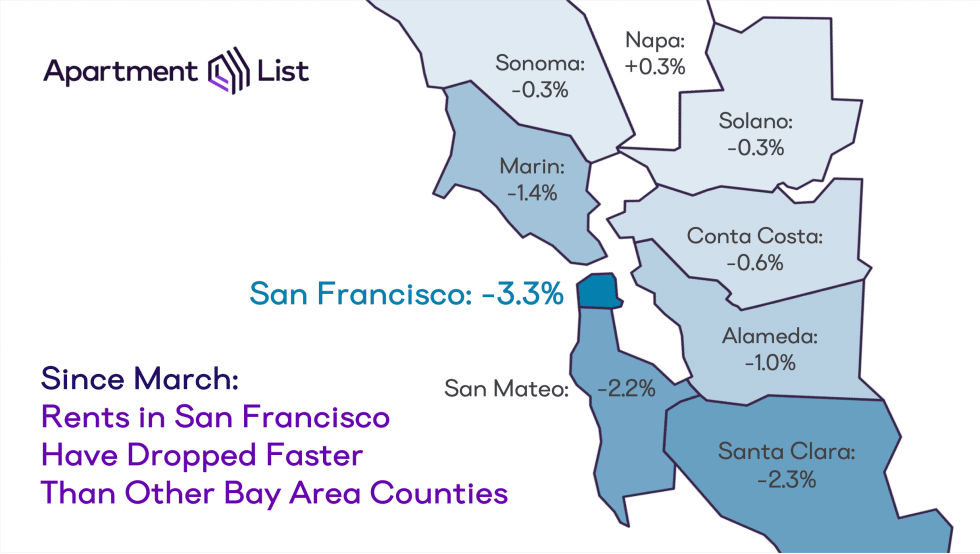
In the South Bay counties of San Mateo and Santa Clara, where rents also tend to be quite expensive, rents have fallen by 2.2 percent and 2.3 percent, respectively. Meanwhile, the more affordable Alamada, Contra Costa, and Solano counties in the East Bay have been even less affected, with declines of 1.0 percent, 0.6 percent, and 0.3 percent, respectively. On the whole, it seems that the most expensive parts of the Bay Area are seeing rents fall fastest.
As some Bay Area tech companies signal that a growing embrace of remote work will outlast the pandemic, many have hypothesized that workers will take advantage of this new flexibility by abandoning downtown in search of more space and greater affordability in the suburbs. However, a recent analysis of our user search data did not show any signs of San Francisco renters looking to leave the core city for other parts of the metro, nor was there a dropoff in the share of renters looking to move to San Francisco from elsewhere.
Conclusion
Since the start of the COVID-19 pandemic, we have seen shelter-in-place ordinances put a halt to normal moving activity, combined with staggering job losses as huge segments of the economy were put on pause. These unprecedented forces have dampened the demand for rental housing across the country. 33 percent of Americans say that they are now less likely to move since this year, while the 21 percent who are more likely to move are being driven primarily by a need to find more affordable housing. These financial losses and general uncertainty are creating softness in the market. While rents levelled off this month at the national level, prices are still declining fairly rapidly in some of the most heavily impacted markets.
As far as longer-term impacts, the pandemic’s effect on rent prices will depend heavily on how quickly the economy is able to recover. There are indications that the recovery will be more drawn out than many had initially hoped, making it likely that we’ll see a protracted uptick in downgrade moves as many households facing financial hardship begin looking for more affordable housing. We may also see a significant slowdown in new household formation, as more Americans move in with family or friends to save on housing costs. These trends could mean that competition will remain tight for rental units at the middle and lower ends of the market, while luxury vacancies get harder to fill. As long-term remote work gains traction, we may also be seeing the beginning of a shift away from expensive downtown markets and toward more affordable suburbs.
To learn more about the data behind this article and what Apartment List has to offer, visit https://www.apartmentlist.com/.


Sign up to receive our stories in your inbox.
Data is changing the speed of business. Investors, Corporations, and Governments are buying new, differentiated data to gain visibility make better decisions. Don't fall behind. Let us help.


Sign up to receive our stories in your inbox.
Data is changing the speed of business. Investors, Corporations, and Governments are buying new, differentiated data to gain visibility make better decisions. Don't fall behind. Let us help.