There is a strong narrative present in today’s media that the $600 a week provided by the CARES Act is creating a disincentive for Americans to return to work. This narrative can be seen in Washington as politicians argue over the pros and cons of extending some benefits of the CARES Act, and what the parameters of the stimulus should be this time around. In this post we will examine whether LinkUp’s job listing dataset can provide support to this narrative. We will be working off the hypothesis that, for the length of the CARES Act, low paying jobs will have a higher Closed Duration then previously observed. The assumption being that employers are struggling to hire people for these jobs because those workers stand to make more on unemployment. The focus of this article is not to support or dispute that certain income levels will see increased pay by collecting unemployment, (great research has been done on this already) but rather to see if this increased pay is stopping unemployed individuals from returning to work.
The primary measure used will be Closed Duration, which is the measure of how long a job is present on a company website before it is removed. We assume in this case that when a job is removed it has been filled. Closed duration is calculated by taking the difference between the delete date and created date of a job listing. These will then be averaged for a group of job listings (jobs with no delete date will be ignored in this calculation). This can be helpful in determining what occupations are a challenge to hire for currently. This will be skewed, as higher skilled jobs tend to be harder to fill than lower paying ones. This will be accounted for by comparing 2020 closed duration to last year’s closed duration for the same time period. The time frame we will use begins when the CARES Act started, examining job listings that were created on or after March 27 to July 20th. We will be using a week buffer here to account for drift.
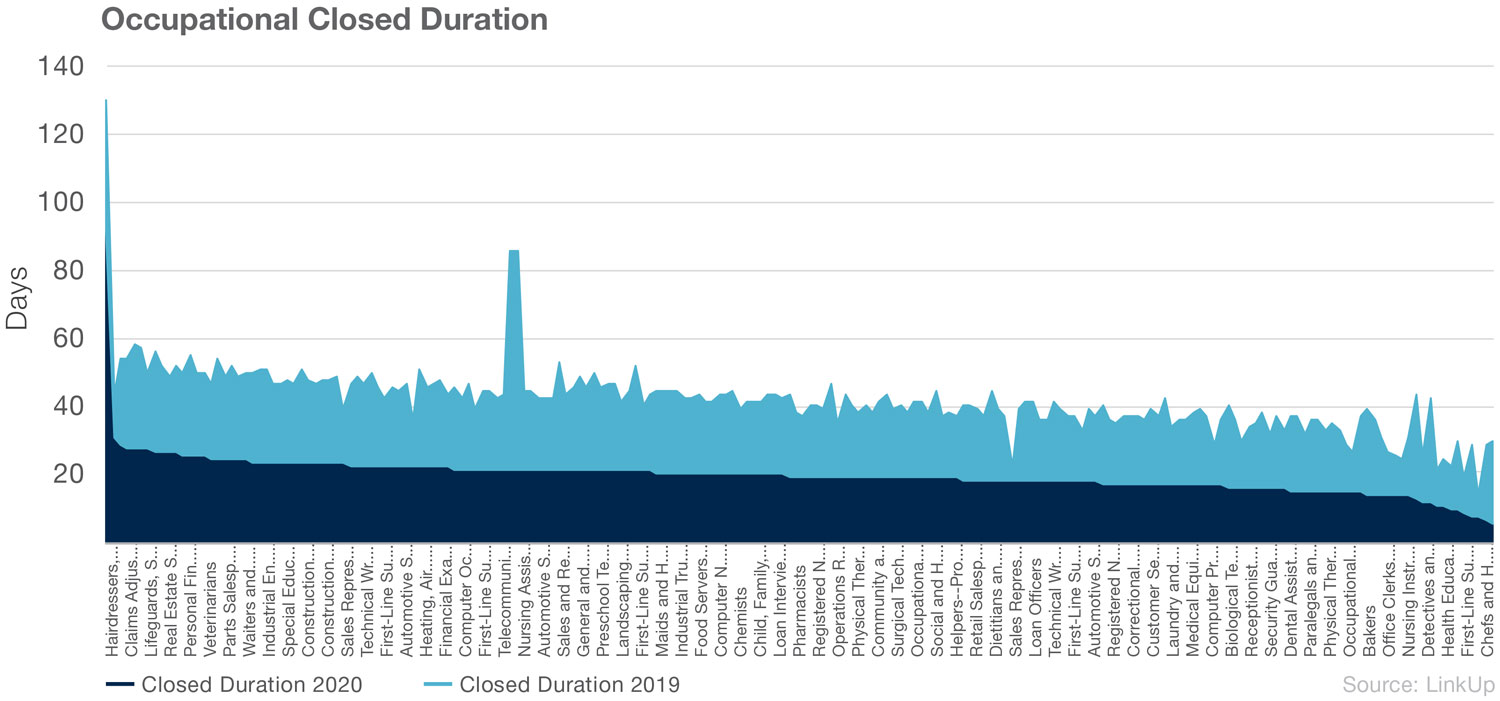
While the graph above is interesting when looking at certain occupations, like Hair Dressers, that seem to be particularly hard to hire currently, it does not tell us much as a whole. Logically the additional $600 a week will benefit someone who made less percentage-wise than a high earning occupation. For example, a study performed by Chicago Booth School found that “the median retail worker who is laid-off can collect 142% of their prior wage in “UI” and “unemployed janitors who worked at businesses that shut down can collect 158% of their prior wage.” To see if this trend is present in our dataset, we will join BLS salary data using O*Net code. This will allow us to analyze how salary affects the closed duration of job listings. Following the narrative in the above articles, the hypothesis is that we will see a negative correlation between salary and closed duration. As salaries rise, jobs would be getting filled faster since they stand to gain less for the unemployment benefits.
Below is a scatter plot of BLS annual salary, and the difference between 2020 closed duration vs 2019 closed duration, for occupations that had at least 1000 jobs posted during the timeframe.
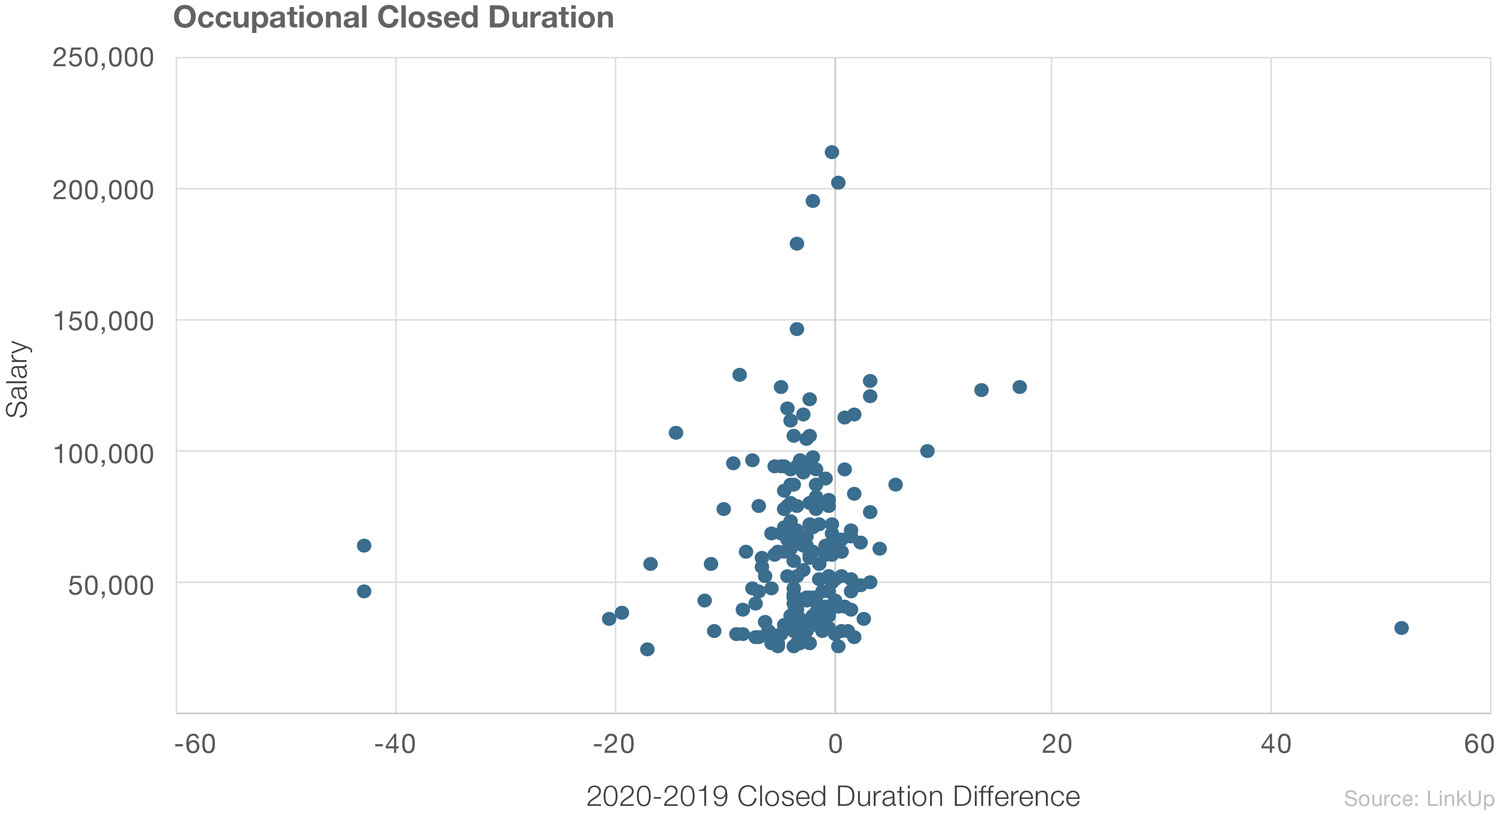
This leads to no meaningful correlation between the 2 variables. This result could be skewed by the higher income jobs that always takes a long amount of time to fill. To account for this we will look at jobs that have a salary of $100,000 or less. This still leads to no correlation, and no support for our original hypothesis.
Part of what may be missing is an understanding of how UI benefits are distributed. To better understand how these variables can affect job listing length, we will look at the 2 states that have the highest and lowest unemployment and calculate their expected unemployment benefits. At the time of this writing, those 2 states are Kentucky with an unemployment rate of 4.3% and Massachusetts with an unemployment rate of 17.4%.
Massachusetts’ unemployment benefit calculation is fairly complex, but can be reduced to a simpler formula of taking half of the previous weekly pay, with the upper bound being set at $823. Kentucky’s unemployment insurance is a bit simpler to calculate as it is basically 1.1923% of annual pay with an upper bound set at $415.
Annual salary will be taken from BLS using the state level, opposed to the national level as previously used, to determine what pay should be for each occupation. Right off the bat an interesting trend appeared, in that 78 out of the 118 occupations reached the upper bound of UI in Kentucky where in Massachusetts only 38 out of the 120 occupations reached the upper bound of UI.
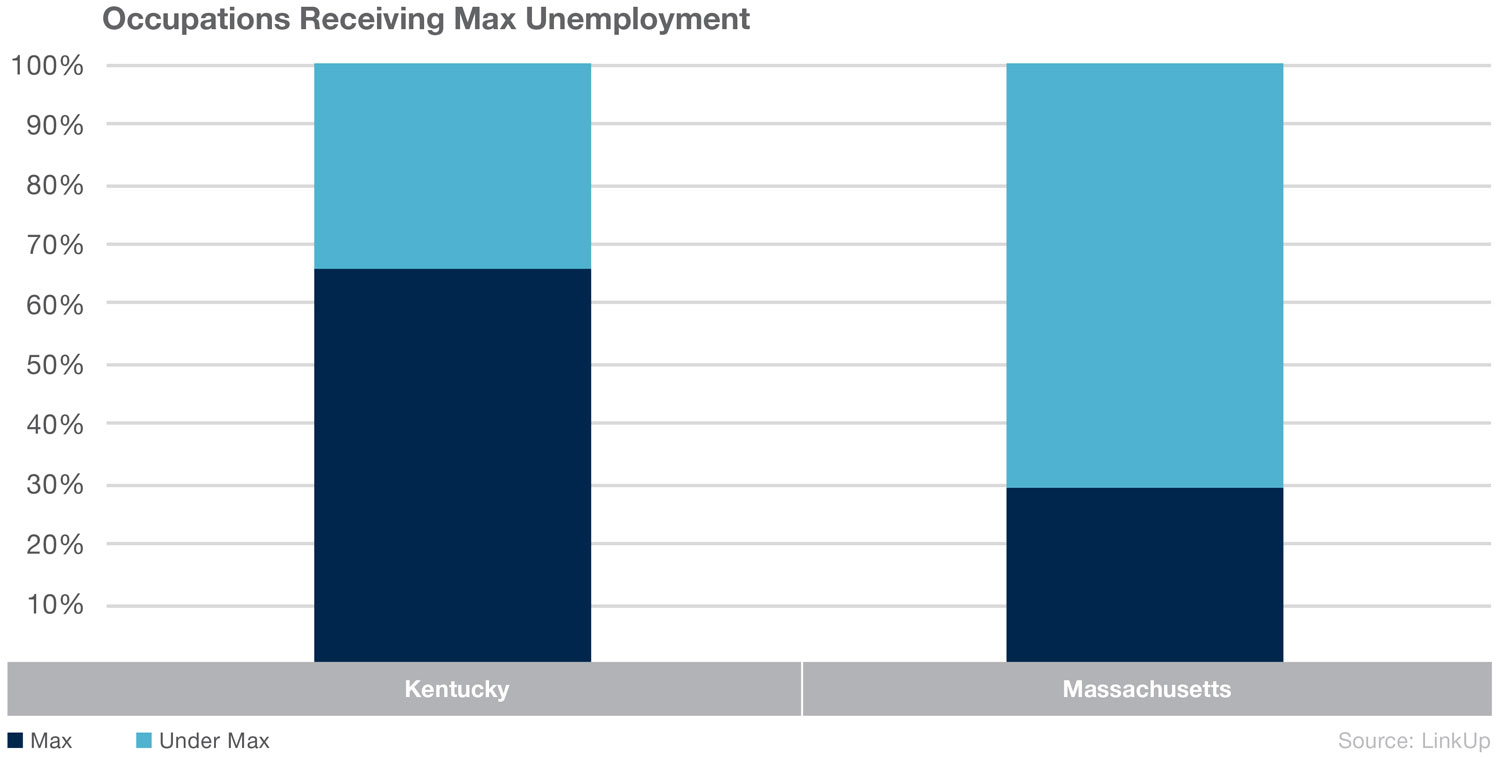
Given this, the percentage increase in UI benefits seen in Kentucky should be much larger than in Massachusetts. The logical conclusion here is that Kentucky would have seen increased closed duration, since employees are seeing a larger increase in benefits, they have less incentive to return to work.
This is true, with the average difference in closed duration being higher in Kentucky opposed to Massachusetts by roughly 2 days. Although this result may be misleading as both states have seen average closed duration decrease from the year before with Massachusetts decreasing -3.14 days and Kentucky decreasing -.93 days.
Lastly we will take a look at the correlation between the percentage increase in UI benefits, compared to occupation closed durations for each state.
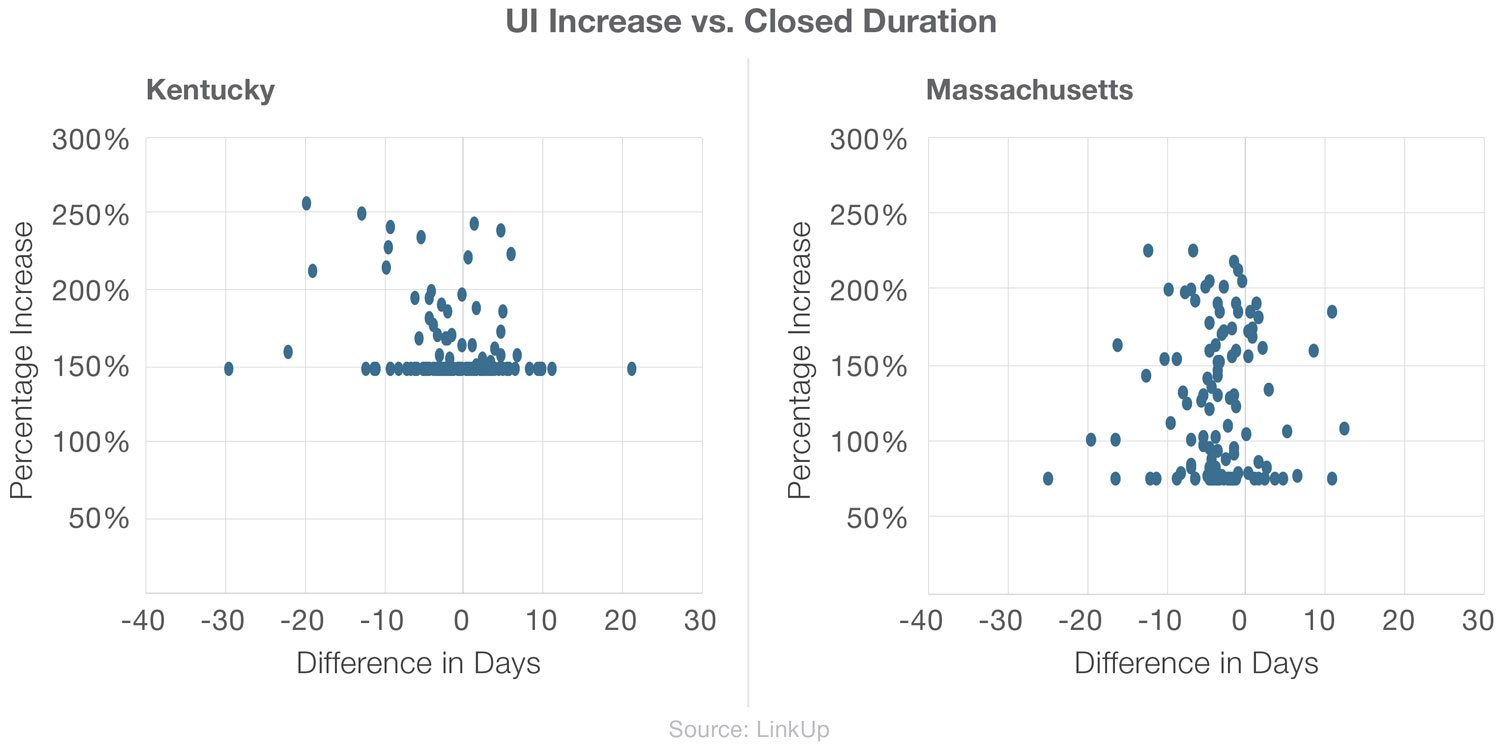
Massachusetts almost shows no correlation, where Kentucky has a correlation coefficient of -.26. Granted this score is not very strong, but it would support the opposite of our hypothesis in that as the percentage of UI benefits increase for occupations, the time to close their positions decreases.
Bigger picture
Throughout the analysis no evidence was found to support our original hypothesis that the increased UI benefits were leading to employers having a hard time filling positions. Looking on the national scale, there are certainly examples of lower paying occupations (ie Hair Dressers and Massage Therapists) that are harder to fill this year, either due to difficulty finding candidates or in predicting demand for these occupations during Covid. At the same time, there are also similar examples for the opposite, with occupations like Fast Food and Counter Workers taking significantly less time to fill.
There are multiple reasons for this lack of support that can be observed from the results discussed above. First, this was a short period of time when dealing with closed duration. If we examine this again in the future these numbers may change, as jobs are being posted and closed, and we could find evidence to support our original hypothesis. Additionally, it may be smaller employers that do not use online job listings or use only job boards, who are having trouble hiring. Lastly, what I believe to be more likely is that, while the UI bonus may or may not disincentivize workers from returning, there still needs to be job listings for those workers to return to. If we look at our listings on a country scale we see that those jobs largely have yet to return. Below is our active jobs measure, a chart from 2020, and 2019 for comparison.
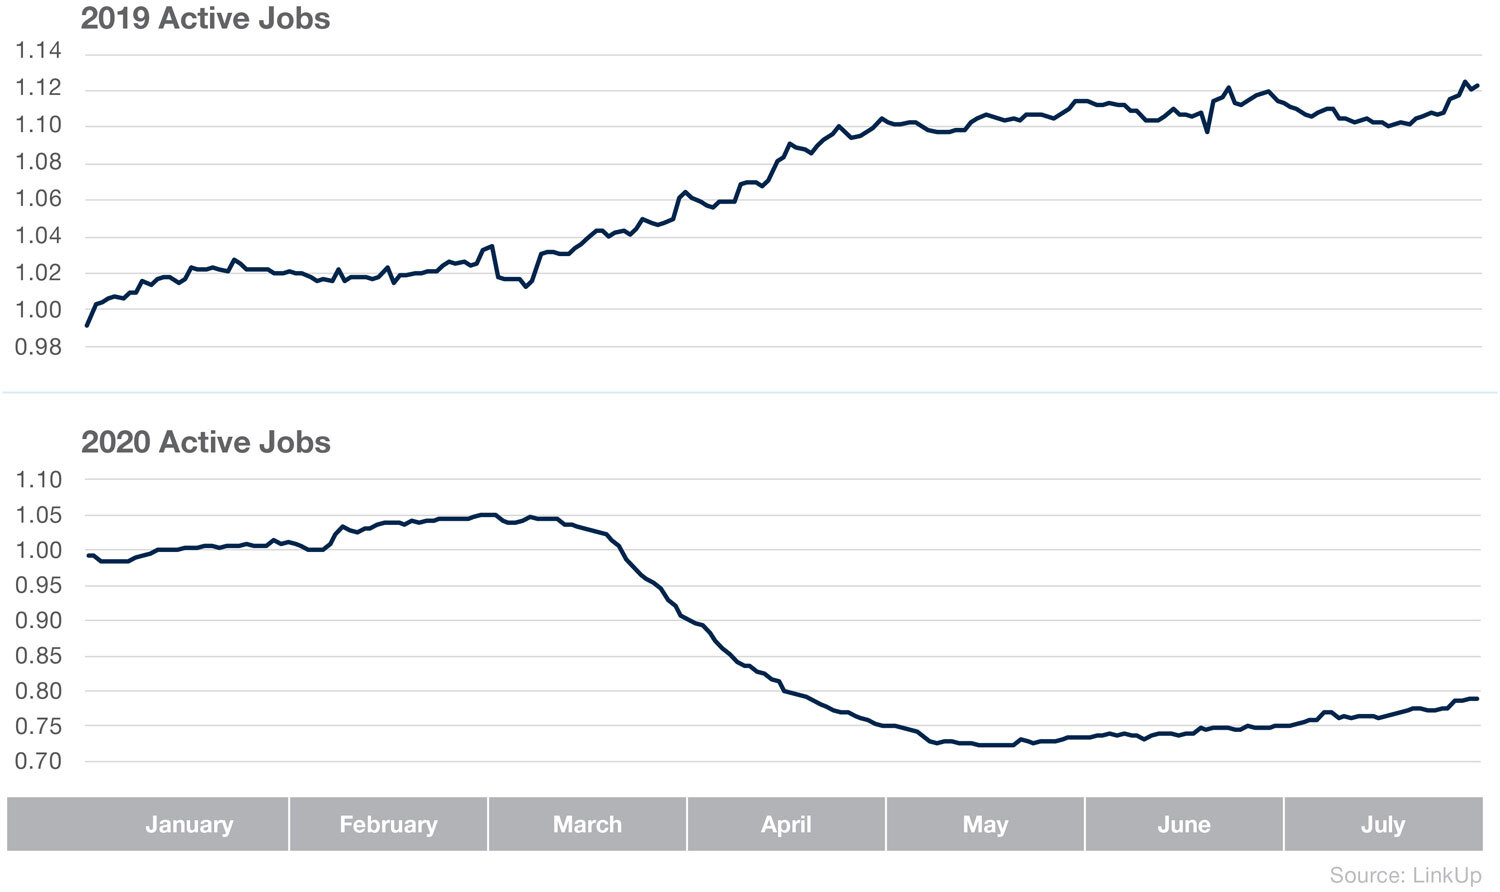
This points to a conclusion that while there may be good anecdotal evidence of employers struggling to hire workers seen in articles, on a larger scale it looks like the jobs are not there. If this is the case, it will be interesting to see how the next round of stimulus plays out. If there is a reduction, or nothing is decided and additional benefits are stopped all together, there is a possibility this would reduce consumer demand, furthering the reduction in the labor market. LinkUp will return to this topic after the next round of stimulus is decided and enough time has passed to observe the implications.
To learn more about the data behind this article and what LinkUp has to offer, visit https://www.linkup.com/data/.


Sign up to receive our stories in your inbox.
Data is changing the speed of business. Investors, Corporations, and Governments are buying new, differentiated data to gain visibility make better decisions. Don't fall behind. Let us help.


Sign up to receive our stories in your inbox.
Data is changing the speed of business. Investors, Corporations, and Governments are buying new, differentiated data to gain visibility make better decisions. Don't fall behind. Let us help.