
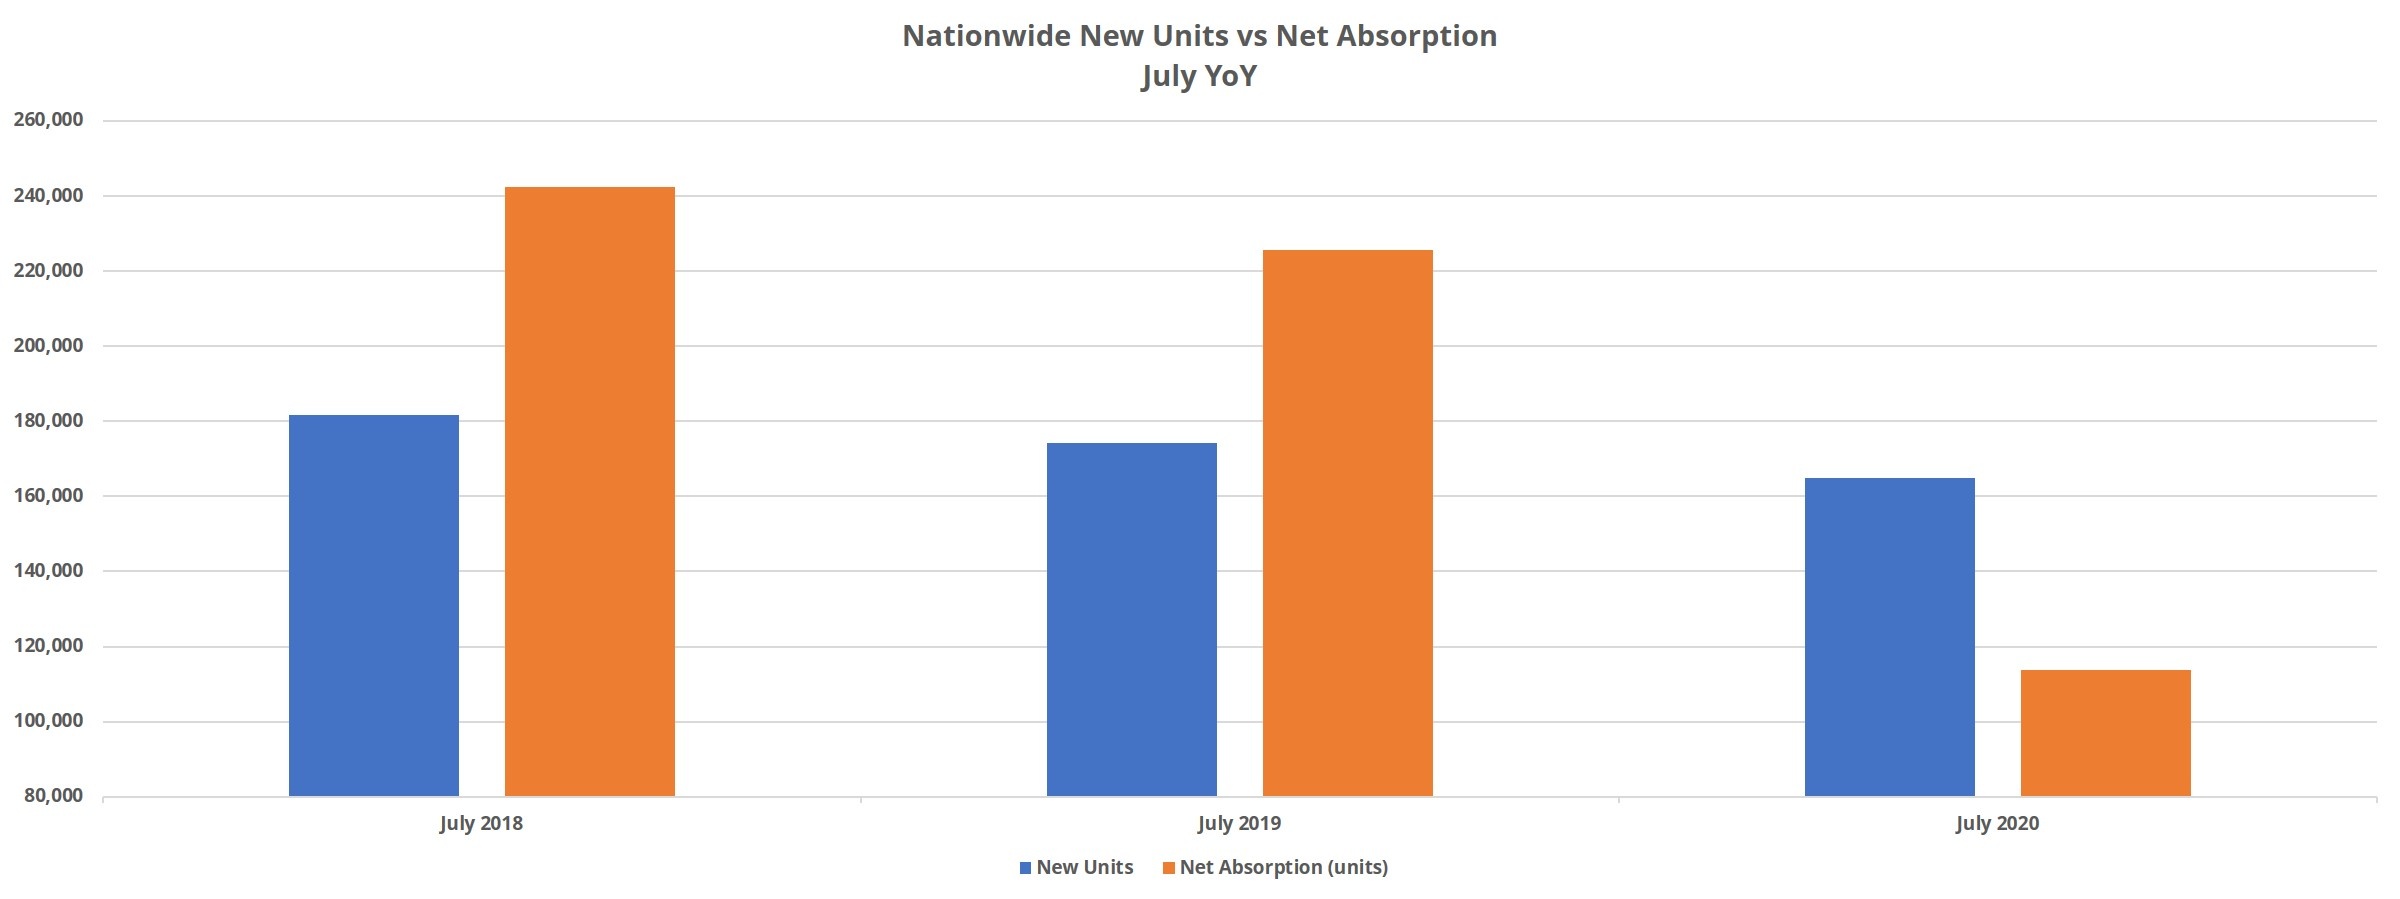
One aspect of the new environment for multifamily that has become apparent over the last few months is that new supply is likely to act as a headwind for market performance as we move through 2020 and into early 2021. Apartment demand through July was half that of the same period last year, and 50,000 less units were absorbed than added in the first seven months of the year.
With that in mind, let’s have a look at markets with a high level of new supply delivered in the last twelve months and then some markets with a high level of upcoming deliveries.
New Units Delivered
Two of the three markets with the most new units delivered in the last year were Texas markets (also number four). Dallas – Fort Worth led the way with about 21,000 new units. Much of that new supply has been on the Greater Dallas side of the market, and beyond that, especially focused in suburban submarkets.
Next was the Houston area, which added around 19,000 new units in the last year. Deliveries were less skewed toward suburban submarkets than in DFW, with two of the top four submarkets being inside the Inner Loop area. Even so, a lot of activity was in the northern suburbs.
Rounding out the top three was Washington, DC with more than 13,000 new units delivered. Slightly more than half of those new units were delivered in only two neighboring submarkets – the Capitol Hill area and just across the Potomac in the Arlington – Old Town Alexandria submarket.
When looking at areas with the most new supply in a time period, of course it is the large markets that are going to appear on the list. But there are smaller markets that have seen even more new supply, relative to their size. One that stood out over the last year was Asheville, North Carolina. The area added only about 1,500 new units, but that represents more than 12% of existing capacity there at the start of the period.
For context, the largest percent of capacity for the three large markets mentioned above was 3.8% in DFW. Another smaller market that stood out was Miami. 6,200 new units delivered in the last year equals 7.5% of the market’s existing capacity from 12 months ago.
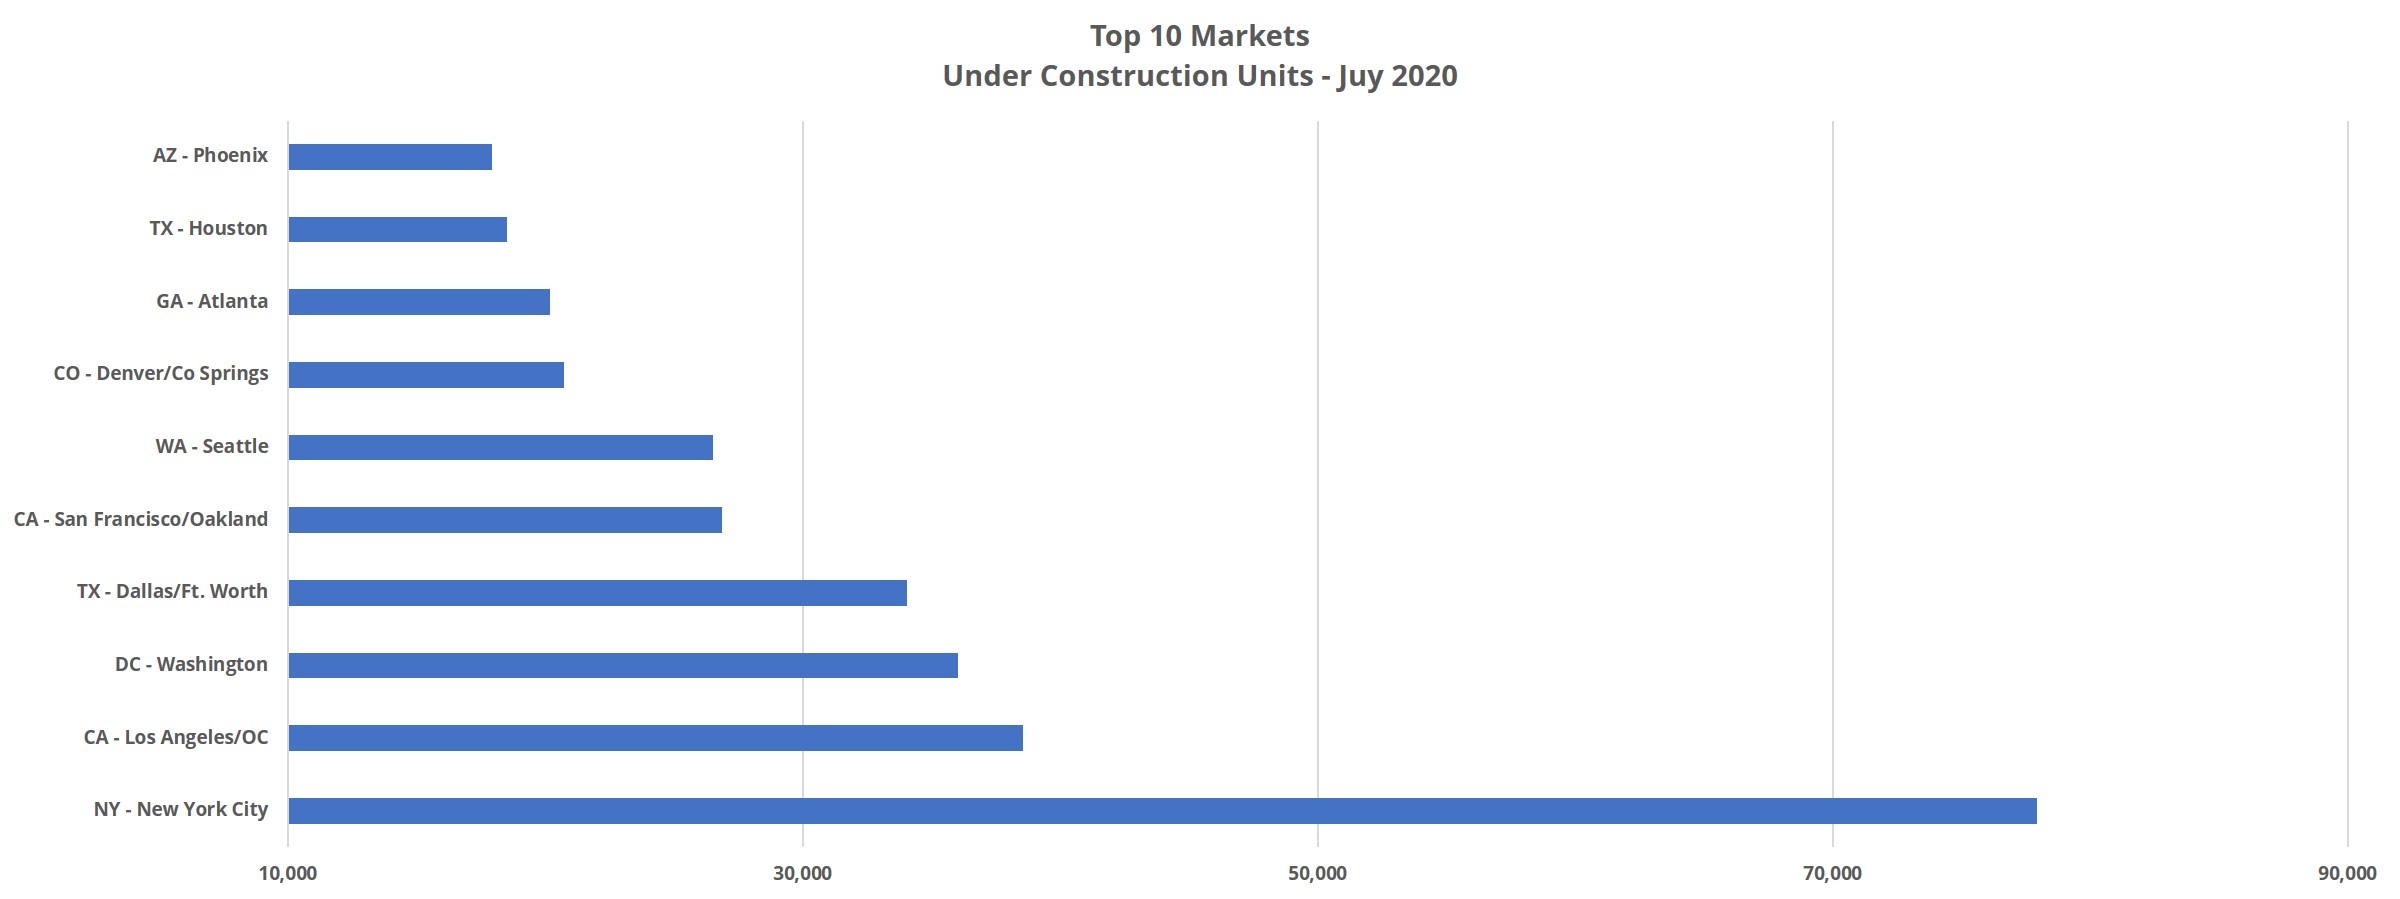
Units Under Construction
Projects in this stage of the construction pipeline have already broken ground but have not yet begun to lease. The Greater New York City area currently has more than 76,000 units under construction, by far the most of any market in the country. That volume is enough for an eye-popping 15% of existing market inventory.
The Los Angeles – Orange County area has the second-most units under construction, with about 37,000 units currently being built. Though not anywhere near the 15% of existing capacity seen in the NYC market, 37,000 new units still accounts for just over 7% of existing inventory.
Washington DC also shows up once again, with almost 34,000 new units currently under construction. As with the LA area, these units account for just more than 7% of existing capacity in the Greater DC market.
Two smaller markets are especially noteworthy in this category. The first is Honolulu, where around 1,600 new units currently under construction equal nearly 19% of existing capacity there. It should come as no surprise that Honolulu was a market especially hard-hit in the second quarter, losing ground both in average effective rent and average occupancy, and this volume of new supply relative to the market’s size is unlikely to ameliorate that situation.
The other smaller market especially of note in this category is Boise, Idaho. Boise has been a high-growth market in recent years, and in some ways, has been similar to the Denver market in that much of the growth has been derived from residents leaving more expensive West coast markets and the proliferation of tech jobs in the area. The 3,000 units under construction there represent about 16% of existing capacity.
Takeaways
Because of the sharp downturn in multifamily demand in recent months, new units entering the market will be facing a much different environment than lease-up properties from the past few years. This will have an impact on average occupancies and on average effective rent growth, though certainly to varying degrees across markets. Looking below just the headline numbers will be even more of a necessity.
A simple example – net absorption nationally has fallen 50% this year through July compared to last year during the same time. However, when evaluating only the Class A subset what most new construction will fall into, demand has fallen 64%.
Large and growing markets with a diverse array of industries contributing meaningfully to employment will have more play in the joints than markets with a heavy reliance on one or two industries, or smaller markets with especially large volume relative to their size.
One other piece of the puzzle to watch is the concentration of deliveries within a market. This is something eminently simple to do by referring to ALN’s free monthly Market Review reports, which include the top five submarkets by upcoming pipeline units. A market with new units focused in only one or two submarkets is likely to perform differently as we move through the rest of 2020 than areas with construction activity across the market.
To learn more about the data behind this article and what ALN Apartment Data has to offer, visit https://alndata.com.


Sign up to receive our stories in your inbox.
Data is changing the speed of business. Investors, Corporations, and Governments are buying new, differentiated data to gain visibility make better decisions. Don't fall behind. Let us help.


Sign up to receive our stories in your inbox.
Data is changing the speed of business. Investors, Corporations, and Governments are buying new, differentiated data to gain visibility make better decisions. Don't fall behind. Let us help.