
In the Ernest Hemingway novel The Sun Also Rises, Mike is asked how he went bankrupt. “Two ways,” he answers. “Gradually, then suddenly.”
COVID-19 seems to have rewritten the financial rules: Central Banks are pushing interest rates further into negative territory and Government support for businesses and their employees has pushed Sovereign debt to levels not seen since the Second World War.
But in the real world, fundamentals still matter. The bankruptcy list lengthens every week, and growing numbers of “Fallen Angels” show that many more firms are likely to suffer the same fate before the crisis is over.
The boundary between investment grade (IG) and non-investment grade (non-IG) borrowers, is traditionally defined by agencies and bond markets such that anything rated at BBB- or better is IG, anything at BB+ or worse is non-IG. Consensus credit data suggests that, in normal circumstances, this boundary corresponds to an approximate forward-looking default risk of 50Bps per annum, or 1 in 200.
Figure 1 shows proportionate yield changes in each credit category over the crisis period (end-February to early August).
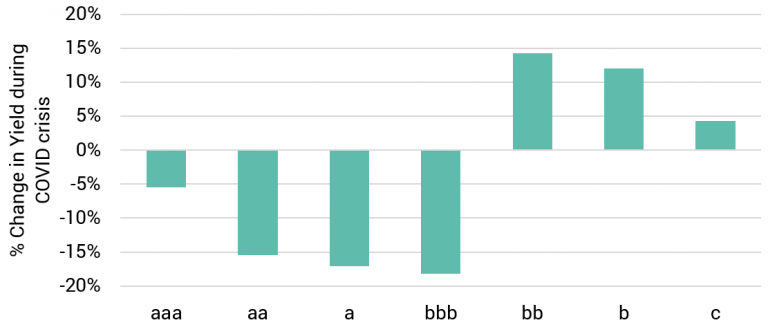
Source: Bank of America / ICE, St. Louis Federal Reserve
Investment Grade yields have dropped, especially in the large BBB category; while Non-IG yields have increased, especially in the BB category. This suggests a flight to quality by credit portfolio managers, with the A and BBB categories gaining at the expense of BB and B.
This is consistent with the traditional and distinct IG/Non-IG split, where credits on either side of this boundary can behave very differently. Credit spreads for each group often move independently or even, as in Figure 1, in opposite directions. Consensus credit transition data also shows that better risks are likely to stay in the same category, while bad risks tend to move around more – up or down – depending on the credit cycle.
In effect, IG credits are those that are likely to stay solvent and hence remain in the broad IG group; non-IG credits are at more serious risk of insolvency especially during credit downturns.
But in times of crisis, this “Solvency Boundary” may not be perfectly aligned with letter-based ratings, especially if a large number of previously Investment Grade firms (particularly those in the large BBB group) are migrating to junk status.
Figure 2 is based on the full set of Consensus credit transition matrix data for US Corporates and shows median downgrade percentages both for pre-crisis and COVID crisis periods, with the bbb category split into bbb+, bbb and bbb-.
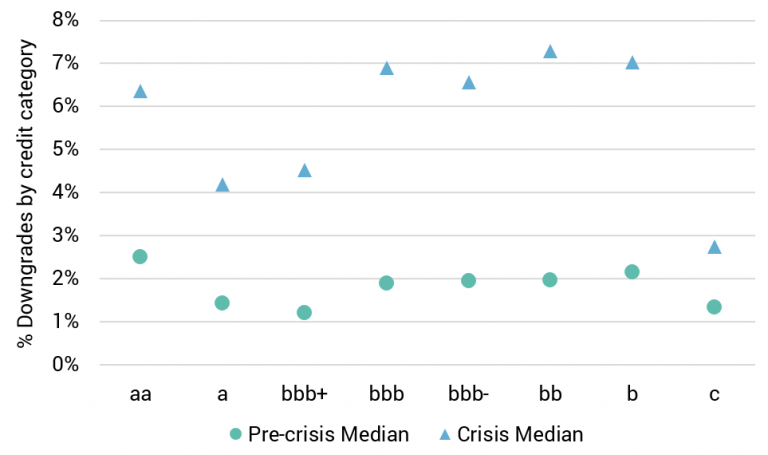
Pre-crisis, the median downgrade rate was about 2%; during the crisis, it has been in the range of around 3% (c category) to 7% (the other Non-Investment Grade categories). The aa category is just over 6% while the a and bbb+ categories are just over 4%. The bbb and bbb- categories are also close to 7%.
This suggests a possible boundary between the bbb+ category and the other bbb categories, with bbb+ close to the a- category rate, and bbb/bbb- similar to the bb and b category rates. This effect is observed consistently for every month between February 2020 and June 2020 inclusive[1].
If this trend continues, it implies that companies within the BBB bond issue categories will show divergent credit trends; the current “Solvency Boundary” may have moved, lying between the issuer risk categories of bbb+ and bbb.
This has important implications for bond and equity investors: in the current environment, not all BBB issues are the same. Investors need to look at the issuer risk level in detail if they want to remain on the safer side of the solvency boundary.
To learn more about the data behind this article and what Credit Benchmark has to offer, visit https://www.creditbenchmark.com/.


Sign up to receive our stories in your inbox.
Data is changing the speed of business. Investors, Corporations, and Governments are buying new, differentiated data to gain visibility make better decisions. Don't fall behind. Let us help.


Sign up to receive our stories in your inbox.
Data is changing the speed of business. Investors, Corporations, and Governments are buying new, differentiated data to gain visibility make better decisions. Don't fall behind. Let us help.