Following the longest period of economic growth in the U.S., the onset of the COVID-19 pandemic led to a decline in economic activity and a resultant recession. According to the National Bureau of Economic Research, February 2020 marked the end of the expansion that began in June 2009 and the beginning of a recession. However, as noted in our recent analysis, the 2020 recession, at four months in, is not following the typical trend of falling home prices but, similar to 2001, is seeing home price growth which is expected to continue through the first quarter of 2021. The latest CoreLogic HPI forecast predicted a 1% drop in HPI by June 2021.
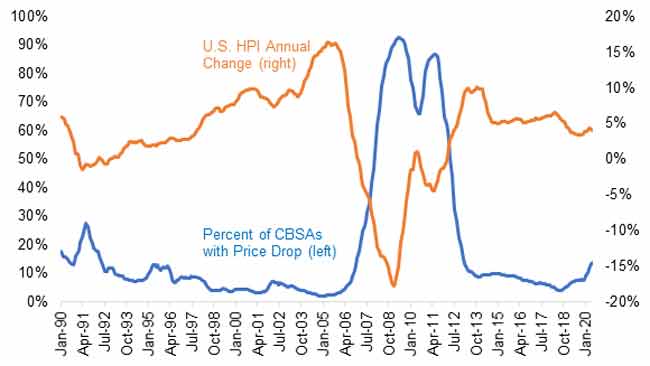
Nevertheless, looking at home price trends nationally can often mask changes occurring in some local markets. For example, as noted in our previous analysis, many places can see home prices fall even when the U.S. HPI is rising. Using annual price change across 954 metropolitan areas, Figure 1 tracks the share of metro areas with price drops going back to 1990 and highlights that there always were places where home prices declined even when the national index rose. Even in 2020, as home prices continued to grow at a solid clip, an increasing share of metropolitan areas have experienced home price declines compared to a year prior - 14% in May, the highest rate since the beginning of 2013.
Figure 1 Percent of CBSAs with home-price drops picked up in 2020
Going forward, the pandemic-induced recession will likely lead to an increasing number of housing markets where home prices are at risk of falling. According to the May 2020 CoreLogic Market Risk Indicators, which provide the probability of a home price decline over a 12-month period for 392 metro areas, probability of a lower prices through June 2021 varied from 19% for St Joseph, Missouri to 98% for Kahului, Hawaii. To determine vulnerability of metro areas to price decline, CoreLogic’s probability model considers many data points at a state and metro level including unemployment rates, income, distressed loans, new construction and a few others.
Given the unparalleled impacts this recession has had on unemployment and income so far, 29% of 392 metro regions now have high risk (65% or greater probability) of price decline over the following 12 months. Six months ago, no metro had falling price probability greater than 64%. The two areas with the greatest probability at the time, 64% and 52% respectively, were both in Arizona - Prescott and Flagstaff.
Nevertheless, even though almost one-third of metros have a relatively high probability of falling prices, the decreases are not expected to come anywhere close to the 15% annual drop seen in the national CoreLogic Home Price Index in 2009. In fact, only 4 out 392 metros have more than a 32% probability of drops of 10% or more. In other words, while the probability of a severe depreciation arguably always exists, the median probability of 10%+ decline across the metros is less than 1%.
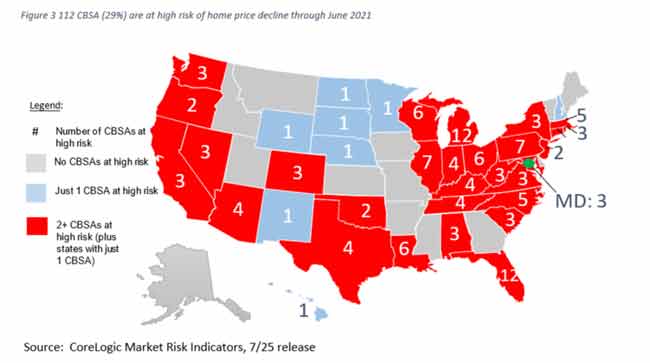
Figure 3 summarizes the number of metro areas by state that have a high risk (65% or greater probability) of lower prices through June 2021. Michigan and Florida have the most metro areas, each with 12, that are expected to experience lower prices. Only 4 metros in Michigan have less than 65% probability though all 4 have more than 60% probability. Wisconsin and Pennsylvania follow with seven metros, and Illinois and Louisiana with six each. Some states, such as Georgia and Utah, are not expected to see price decreases in any of their metro areas.
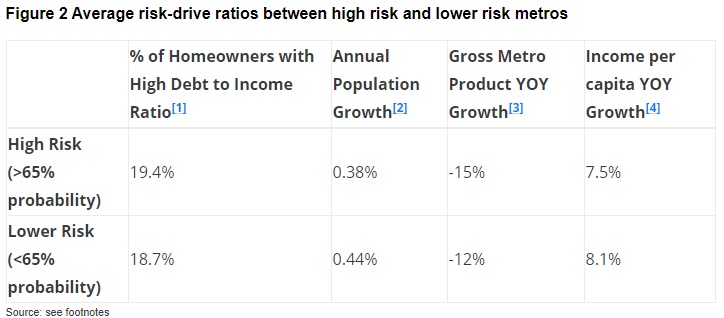
As noted, risk is determined based on a number of variables, however the pandemic is clearly expected to have the largest impact on regions heavily dependent on a tourism market, such as Florida markets, but also rust belt communities that are expected to see elevated unemployment rates. For example, the 13 metros in Michigan averaged a 14% unemployment rate in June, whereas the national rate was recorded at 11%. Still, as Figure 2 suggests, states within the rust belt have relatively more cities with higher price risk which reflects a longer term trend of slower population and income growth, higher unemployment pre-COVID-19 and more homeowners with high debt to income ratios (see Figure 2 for some average comparisons between high risk and lower risk metros).
Lastly, note too that a number of high-risk markets may not necessarily be large metro areas. For example, the four metro areas in Texas are Sherman-Denison, College Station-Bryan, Midland and McAllen-Edinburg-Mission – with the first three having populations of less than 270,000. McAllen-Edinburg-Mission, which is relatively larger at almost 900,000 people is a border town and has some of the lowest per capital income in the U.S. The larger Texas metros, such as Houston, Dallas, and Austin, all fall into the lower risk group.
Similarly, the three high risk markets in California are Merced, Modesto, Salinas which are relatively smaller communities located outside the large megapolitan areas. The risk probability of the large California metro areas is generally much lower, and Los Angeles is the only region with more than 50% probability of price drop. In fact, according to June CoreLogic HPI Forecast, San Diego is forecasted to see a 4.2% home price increase by June 2021, while San Francisco is at 2.2% predicted growth. Resiliency of California’s home prices remains a function of very limited housing availability amid strong pre-COVID-19 employment and income growth. Hence, elevated risk probability in Los Angeles reflects greater number of lower income jobs and higher unemployment relative to the Bay Area, for example.
And in conclusion, even with some expected decline in home prices nationally, the latest CoreLogic Equity Report showed that only 3.4% of all homes with a mortgage nationwide had negative equity. Nevertheless, there are variations across states and some of the states with largest negative equity shares were also hard hit by COVID-19 virus. Thus, as the uncertainties around the pandemic persist and shift local housing market conditions, it is important to keep monitoring local housing data regularly.
Figure 3 112 CBSA (29%) are at high risk of home price decline through June 2021
[1] Source: CoreLogic Loan Level Servicing Database: Percentage of single-family residential debt to income observations greater than 0.45, June 2020
[2] Source: IHS Economics - US Regional Service, July 2020 Forecast: Q2 2020 year-over-year percent change in population
[3] Source: IHS Economics - US Regional Service, July 2020 Forecast: Q2 2020 year-over-year percent change in gross metro product
[4] IHS Economics - US Regional Service, July 2020 Forecast: Q2 2020 year-over-year percent change in income per capita
To learn more about the data behind this article and what CoreLogic has to offer, visit https://www.corelogic.com/.


Sign up to receive our stories in your inbox.
Data is changing the speed of business. Investors, Corporations, and Governments are buying new, differentiated data to gain visibility make better decisions. Don't fall behind. Let us help.


Sign up to receive our stories in your inbox.
Data is changing the speed of business. Investors, Corporations, and Governments are buying new, differentiated data to gain visibility make better decisions. Don't fall behind. Let us help.