
Through what has been an unusual year, to say the least, the multifamily industry has in many ways been on the front lines of the disruption to lives and livelihoods. This impact has been borne out across multiple metrics, but nowhere so clearly as in multifamily demand. Through the first eight months of 2020 apartment demand fell by 42% compared to the same period last year – even as new deliveries were almost on par with last year’s volume.
At a national level the picture changed during the traditionally strong months of June, July and August. Apartment demand was slightly higher than that of the same months in 2019 with more than 108,000 net units absorbed. Even so, an average occupancy gain of 0.3% and an unchanged average effective rent fell well short of the results from the summer of 2019.
A clearer understanding of some of the dynamics involved necessitates going beneath the overall nationwide metrics. Before diving in, as always, all numbers will refer to conventional properties of at least 50 units.
Market Size
One piece of the puzzle is how markets of various sizes performed from June through August. ALN divides markets into one of four tiers based on the number of units in the market, with Tier One markets being the 33 largest in the country.
It was only across these 33 largest markets that summer demand fell short of last year. More specifically, net absorption fell 14% in these areas compared to last summer. It wasn’t all bad for the big markets though. Dallas – Fort Worth absorbed almost 11,000 net units, comfortably ahead of the area’s strong mark from last summer.
However, five markets actually shed rented units from June through August – Boston, New York City, Seattle, San Francisco – Oakland and Los Angeles – Orange County. Of the five, the Bay Area of California was hardest hit. A net loss of 3,800 rented units was combined with the delivery of about 2,700 new units for a loss of 2.3% in average occupancy. New York City was the only other area to lose more than 2,000 net rented units. A net loss of 2,300 rented units as about 2,800 new units were brought online decreased average occupancy there by 1%.
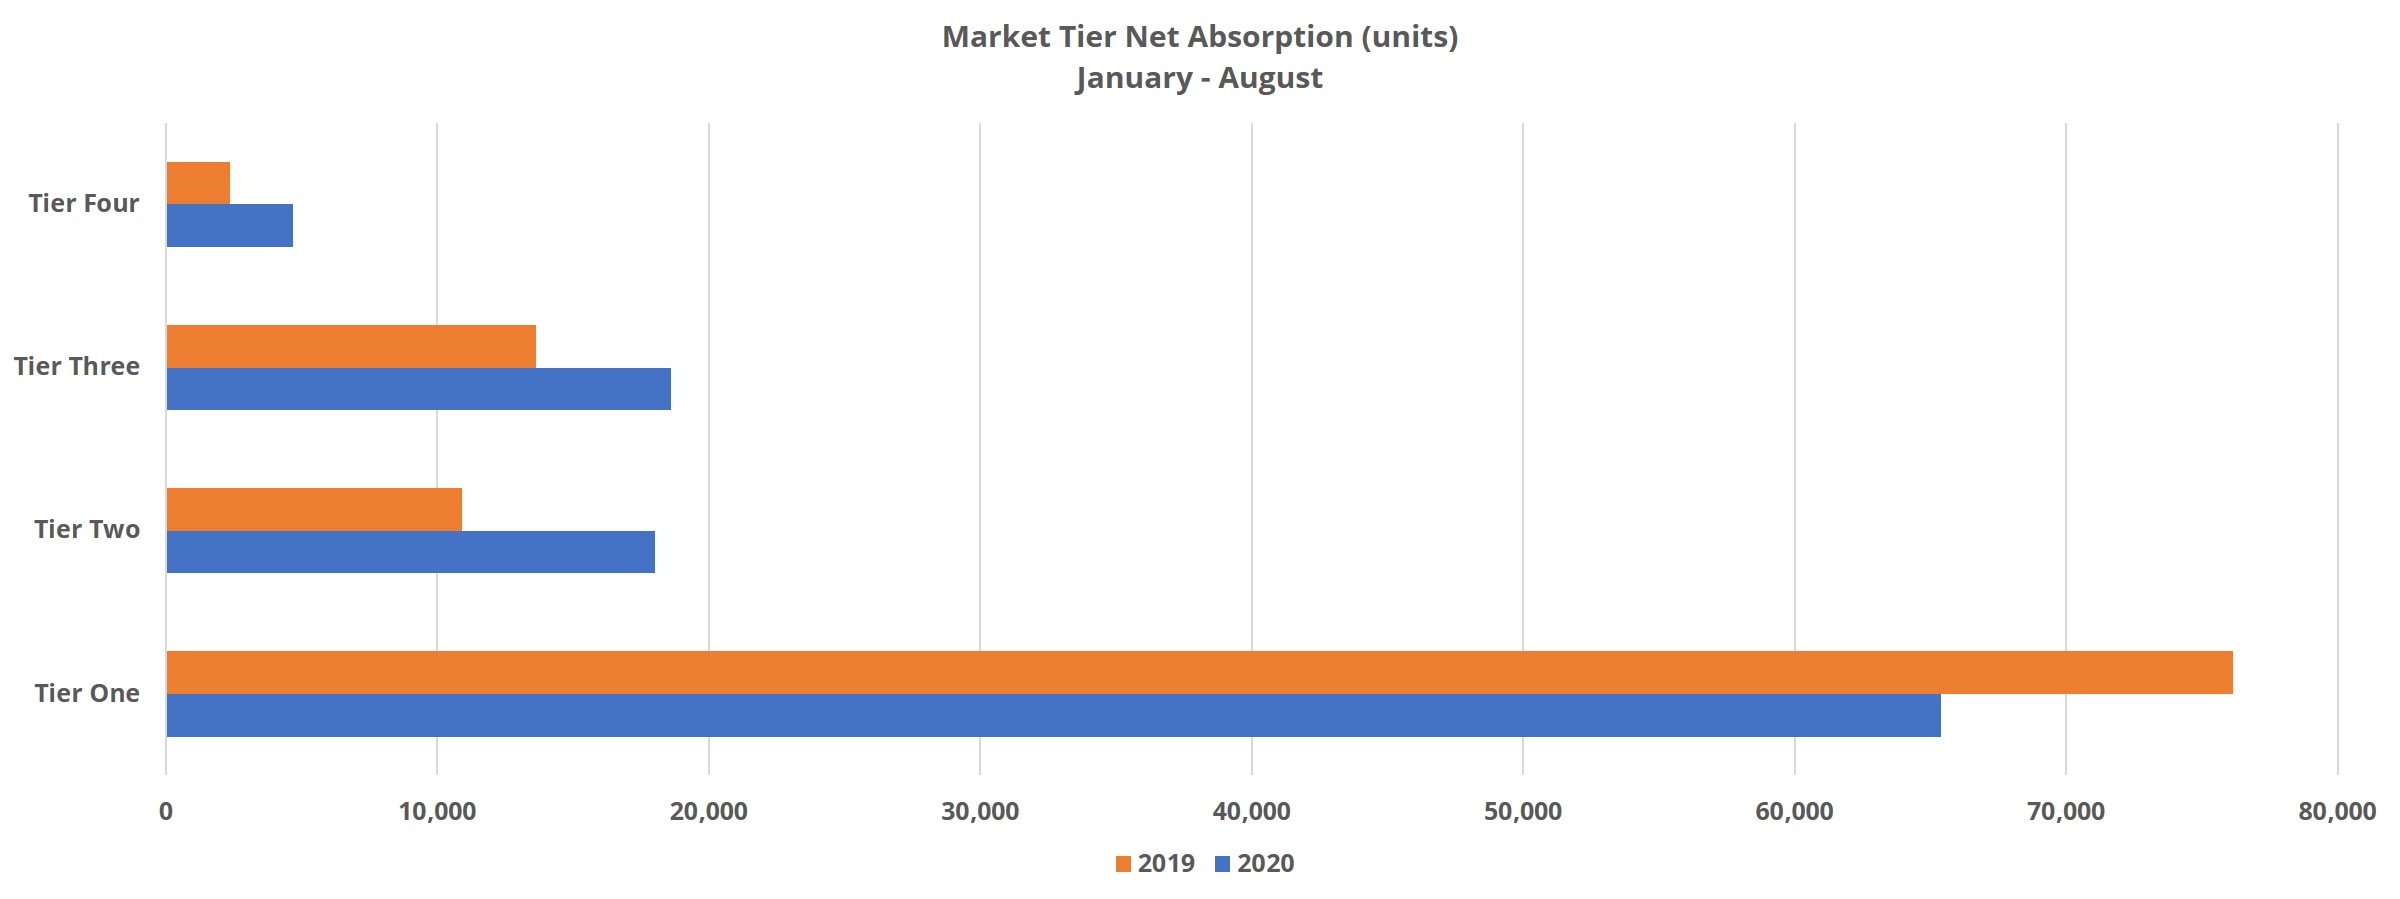
For markets in the other three tiers, demand was stronger than last year. The smallest areas typified this, with net absorption double that of last summer for Tier Four markets. Areas like Asheville, NC, Sioux Falls, ID and Amarillo, TX stood out among the small markets.
Tier Three markets saw demand increase by 37%, led by areas like Charleston, SC, Columbia, SC and Albuquerque, NM. Tier Two markets, which include areas like Milwaukee, Pittsburgh and St. Louis, saw net absorption climb 65% from last year. The aforementioned St. Louis stood out within this group, as did Louisville, KY.
Price Class
One other perspective that draws out some differences in multifamily performance from overall national numbers is price class. ALN assigns conventional properties to one of four price classes A through D based on each property’s average effective rent per square foot percentile in its market. This allows for more apt comparisons across markets.
Class A properties endured a rough summer. It was within these most expensive properties that demand tumbled the most – by an eye-popping 61% compared to June through August of 2019. Less than 17,000 Class A units were absorbed in three months in which more than 30,000 new units entered the market as Class A units. Familiar names crop up near the top if the list for worst Class A demand such as San Francisco – Oakland, Boston, Seattle and New York. One other market is Philadelphia, where the top price tier lost nearly 500 net rented units.
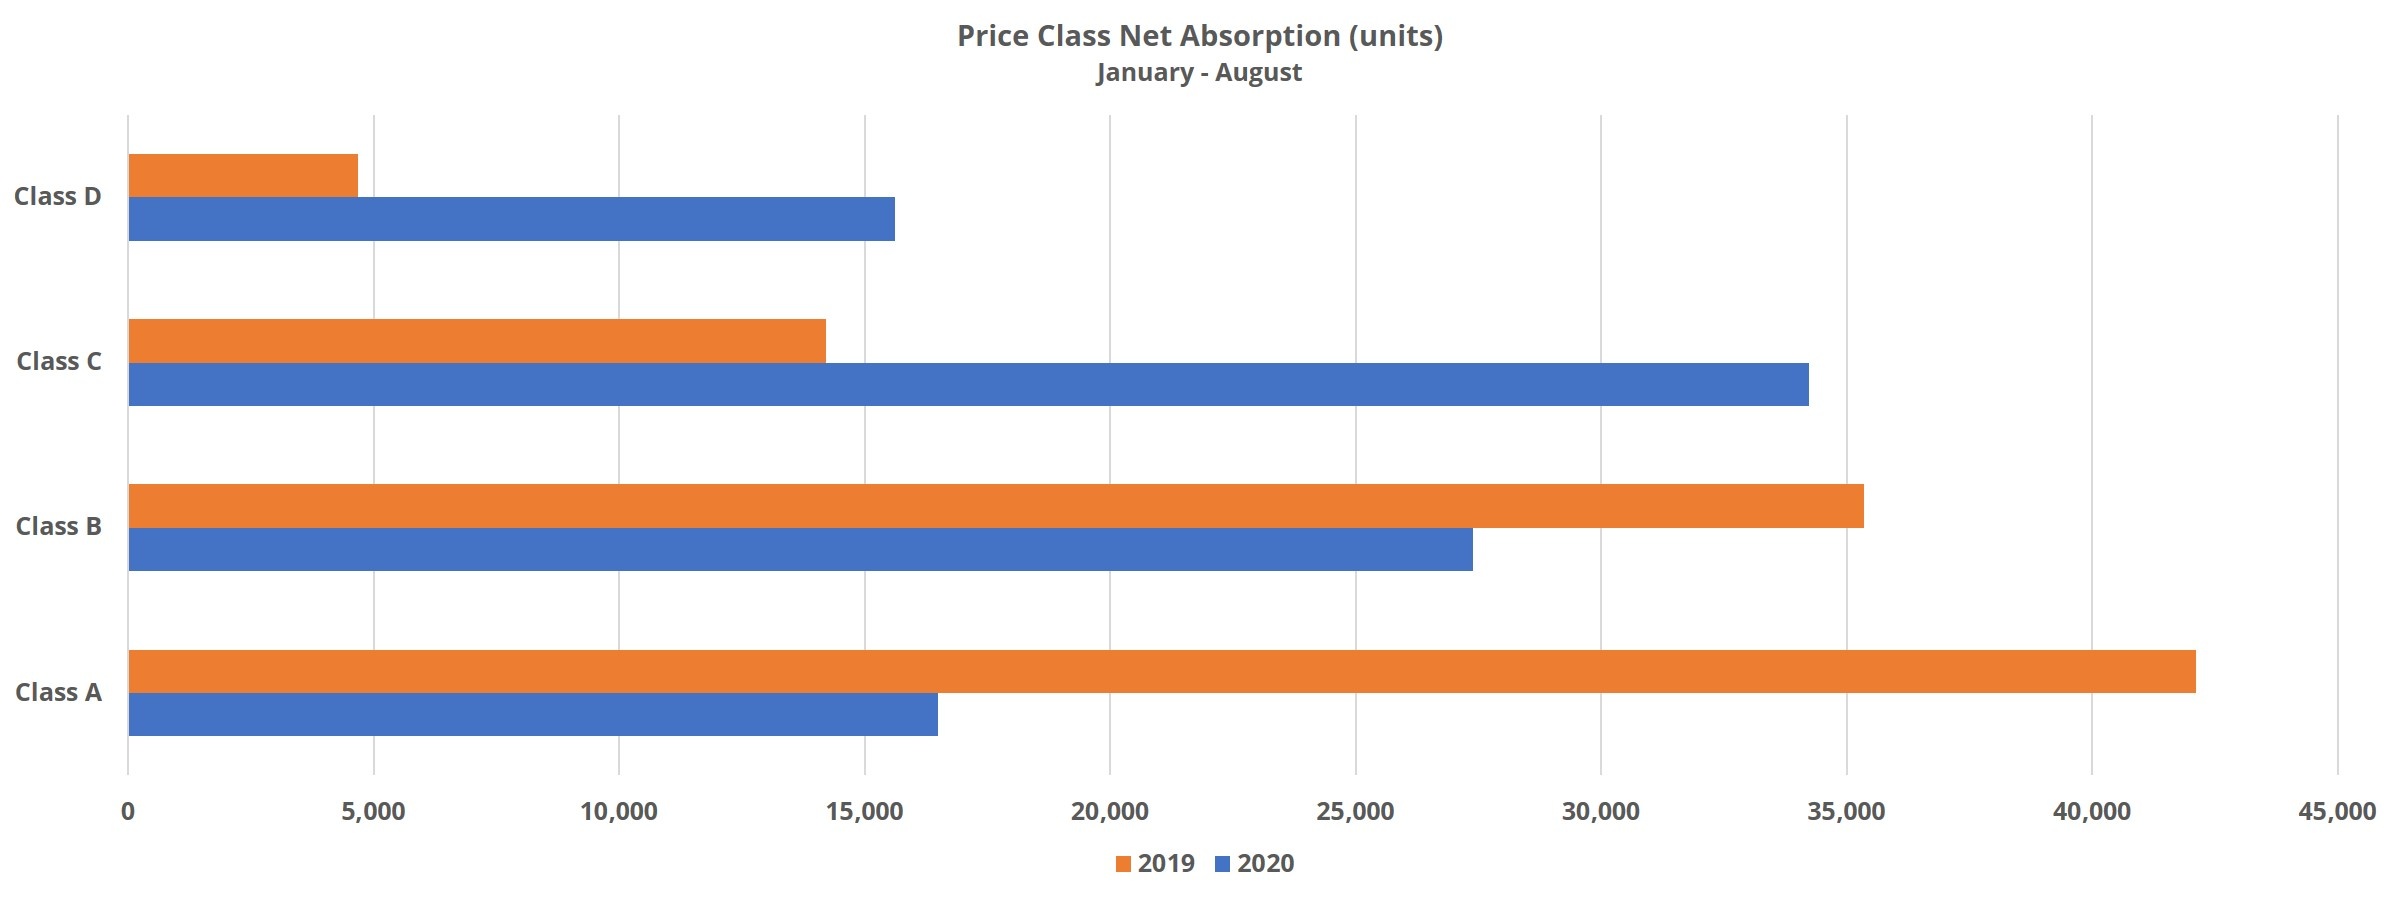
Net absorption fell by 23% for Class B properties during the summer months, down to about 28,000 units overall. Once again, markets like the Bay Area and Los Angeles – Orange County in California were among the hardest hit along with New York, Washington DC and Chicago. The Chicago area suffered a net loss of almost 800 rented Class B units.
In the lower two price tiers, as with the smaller markets, demand significantly outperformed last year. Class C net absorption was 140% higher, moving from about 14,000 units last summer to around 34,000 units this summer. Class D properties saw an even larger jump, gaining almost 16,000 net rented units compared to only about 4,700 last year.
Markets like Atlanta, Austin, Phoenix and Houston saw strong demand in these bottom two tiers, as did areas like Philadelphia and New York that struggled at the top end of the market.
Takeaways
Larger markets tend to be where most new supply is built. Even in more normal circumstances, this increase in competition from the influx of new units has an effect on average occupancy and average effective rent not dealt with to the same degree in smaller areas. It should be no surprise then that larger markets struggled through the summer as new supply barely slowed at all while demand continued to falter.
Even so, when referring to lackluster performance in these markets, it is mostly just a handful of markets that are driving those results. It is no coincidence that of the five Tier One markets with negative net absorption from June through August, none rank lower than Seattle at sixth out of 33 for market average effective rent.
There was a clear move toward affordability during the summer months this year. Demand skyrocketed for Class C and D properties, receded for Class B properties and fell off a cliff for Class A properties.
The extent to which the summer’s results seem more glass half full or glass half empty has a lot to do with your focus in the industry. Large markets and more expensive, mostly newer properties failed to rebound in what is typically a strong part of the year for multifamily. Because large markets are the driving force behind nationwide numbers, a handful or so dramatically impacted the numbers downward.
On the other side of the coin, demand was up in two of the four price tiers and in markets of all sizes outside the 33 largest. This is not to say the difficulties of the new economic environment are behind us, but rather that the picture is not as dire as top-line numbers may indicate.
To learn more about the data behind this article and what ALN Apartment Data has to offer, visit https://alndata.com.


Sign up to receive our stories in your inbox.
Data is changing the speed of business. Investors, Corporations, and Governments are buying new, differentiated data to gain visibility make better decisions. Don't fall behind. Let us help.


Sign up to receive our stories in your inbox.
Data is changing the speed of business. Investors, Corporations, and Governments are buying new, differentiated data to gain visibility make better decisions. Don't fall behind. Let us help.