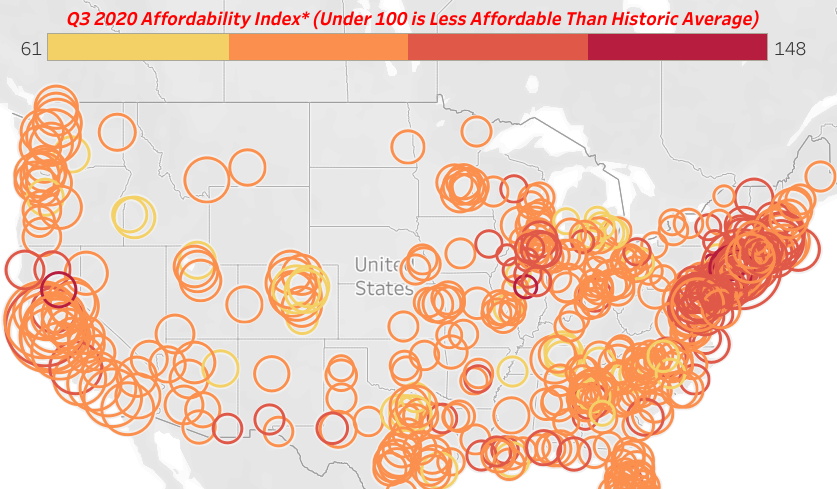
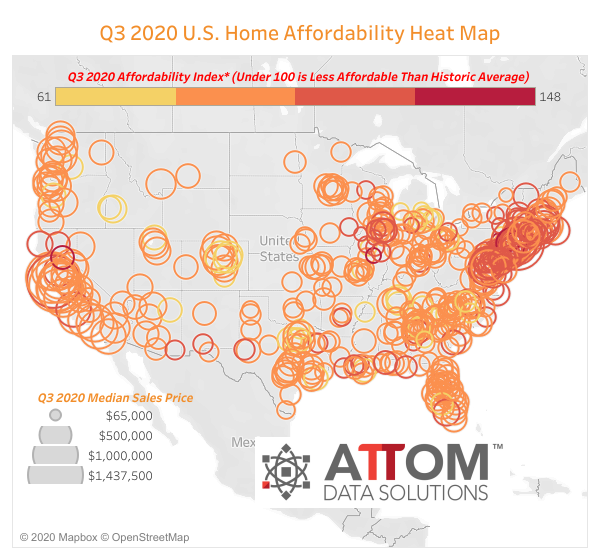
ATTOM Data Solutions, curator of the nation’s premier property database and first property data provider of Data-as-a-Service (DaaS), today released its third-quarter 2020 U.S. Home Affordability Report, showing that median home prices of single-family homes and condos in the third quarter of 2020 are less affordable than historical averages in 63 percent of counties with enough data to analyze, up from 54 percent a year ago.
The report determined affordability for average wage earners by calculating the amount of income needed to make monthly house payments — including mortgage, property taxes and insurance — on a median-priced home, assuming a 20 percent down payment and a 28 percent maximum “front-end” debt-to-income ratio. That required income was then compared to annualized average weekly wage data from the Bureau of Labor Statistics (see full methodology below).
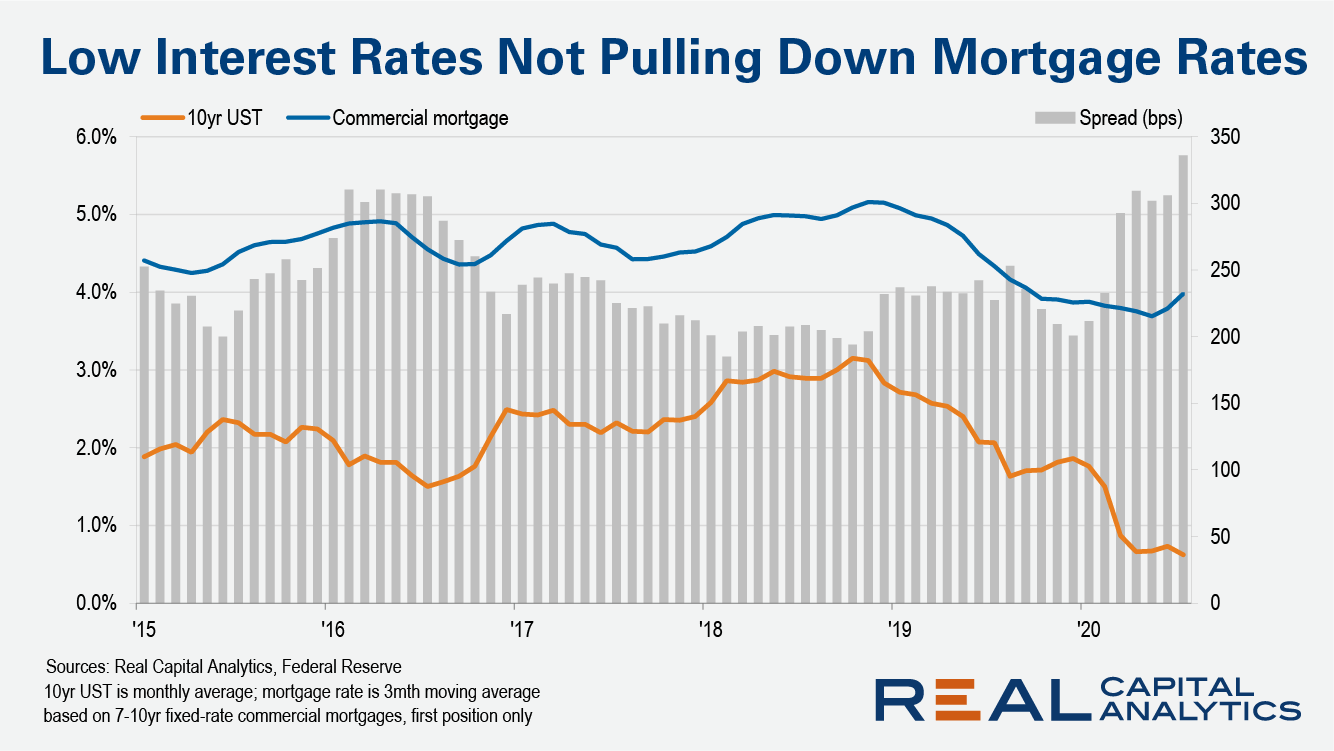
Compared to historical levels, 308 of the 487 counties analyzed in the third quarter are now less affordable, up from 262 of the same group of counties in the third quarter of 2019. The fallback has come as spikes in single-family home prices – occurring despite economic troubles related to the ongoing Coronavirus pandemic – have outpaced the impact of increasing wages and declines in mortgage rates to historic lows.
Amid those trends, costs associated with median-priced homes are unaffordable for average wage earners in 61 percent of the counties in the report during the third quarter of 2020. That means that those expenses consume more than 28 percent of average wages from county to county across the nation.
“In a year when nothing is normal, owning a single-family home has become less affordable to average wage earners across the U.S., despite conditions that would seem to point the opposite way,” said Todd Teta, chief product officer with ATTOM Data Solutions. “Wage are up and mortgage rates are down to rock-bottom levels, which should work in favor of home buyers. On top of that, the American economy has suffered greatly since the Coronavirus pandemic began surging over the Winter – a plight that normally would drop home demand and home prices. But those same low mortgage rates, along with other factors, have led a lot of buyers into the market chasing a reduced supply of homes. The result is price hikes have raced past the impact of wages and mortgage rates.”
The largest of the 299 counties in the report where the median home price is not affordable for average wage earners in the third quarter of 2020, based on the 28-percent benchmark, include Los Angeles County, CA; Maricopa County (Phoenix), AZ; San Diego County, CA; Orange County, (outside Los Angeles), CA, and Miami-Dade County, FL.
The 188 counties with affordable median-priced homes in the third quarter of 2020 for average local wage earners (39 percent of the 487 counties analyzed) include Cook County (Chicago), IL; Harris County (Houston), TX; Philadelphia County, PA; Hillsborough County (Tampa), FL and Cuyahoga County, (Cleveland), OH.
Home prices up at least 10 percent in majority of country
Median home prices in the third quarter of 2020 are up by at least 10 percent from the third quarter of 2019 in 252, or 52 percent, of the 487 counties included in the report. Counties are included if they have a population of at least 100,000 and at least 50 single-family home and condo sales in the third quarter of 2020.
Among the 42 counties with a population of at least 1 million, the biggest year-over-year gains in median prices during the third quarter of 2020 are in Philadelphia County, PA (up 20 percent); Franklin County (Columbus), OH (up 16 percent); Contra Costa County (outside San Francisco), CA (up 15 percent); Maricopa County (Phoenix), AZ (up 14 percent) and Mecklenburg County (Charlotte), NC (up 14 percent).
Price appreciation outpacing wage growth in almost 90 percent of markets
Home price appreciation is outpacing average weekly wage growth in the third quarter of 2020 in 425 of the 487 counties analyzed in the report (87 percent), with the largest counties including Los Angeles County, CA; Cook County (Chicago), IL; Harris County (Houston), TX; Maricopa County (Phoenix), AZ, and San Diego County, CA.
Average annualized wage growth is outpacing home price appreciation in the third quarter of 2020 in only 62 of the 487 counties in the report (13 percent), including Kings County (Brooklyn), NY; Queens County, NY; New York County (Manhattan), NY; Bronx County, NY, and Honolulu County, HI.
More than 28 percent of wages needed to buy a home in almost two-thirds of markets
Major ownership costs on the median-priced home in the third quarter of 2020 consume more than 28 percent of the average wages of local workers in 299 of the 487 counties analyzed in this report (61 percent). Those counties that require the greatest percentage are Marin County, CA (outside San Francisco) (105.7 percent of annualized weekly wages needed to buy a home); Santa Cruz County, CA, (outside San Jose) (88.7 percent); Kings County (Brooklyn), NY (86 percent); Monterey County, CA, (outside San Francisco) (83.7 percent) and Maui County, HI (78.7 percent).
Aside from Kings County, NY, counties with a population of at least 1 million where home ownership consumes more than 28 percent of average local wages include Orange County, CA (outside Los Angeles) (68.5 percent); New York County (Manhattan), NY (66.8 percent); Alameda County (Oakland), CA (64.8 percent) and Queens County, NY (63.7 percent).
A total of 188 counties in the report (39 percent) require no more than 28 percent of their annualized weekly wages to buy a typical home in the third quarter of 2020. Counties requiring the smallest percent include Baltimore City/County, MD (12 percent of annualized weekly wages needed to buy a home); Calhoun County (Battle Creek), MI (13.6 percent); Rock Island County (Davenport), IL (13.6 percent); Luzerne County (Wilkes-Barre), PA (13.7 percent) and Richmond County (Augusta), GA (14 percent).
Among 42 counties in the report with a population of at least 1 million, those where home ownership typically consumes no more than 28 percent of average local wages include Cuyahoga County (Cleveland), OH (18.4 percent); Philadelphia County, PA (18.4 percent); Mecklenburg County (Charlotte), NC (24 percent; Fulton County (Atlanta), GA (24.6 percent) and Cook County (Chicago), IL (24.9 percent).
Average wages needed to afford median-priced home exceeds $75,000 in a quarter of markets
An annual wage of more than $75,000 is needed in the third quarter of 2020 to afford the typical home in 114, or 23 percent, of the 487 markets in the report.
The highest annual wages required to afford the typical home are in New York County (Manhattan), NY ($308,015); San Francisco County, CA ($292,474); San Mateo County (outside San Francisco), CA ($289,064); Marin County (outside San Francisco), CA ($284,052) and Santa Clara County (San Jose), CA ($251,534).
Counites with the lowest annual wages required to afford a median-priced home in the third quarter of 2020 include Luzerne County (Wilkes-Barre), PA ($22,104); Trumbull County, OH (outside Youngstown) ($22,599); Richmond County (Augusta), GA ($23,923); Calhoun County (Battle Creek), MI ($25,768) and Montgomery County, AL.
Two-thirds of markets less affordable than historic averages
Among the 487 counties analyzed in the report, 308 (63 percent) are less affordable in the third quarter of 2020 than their historic affordability averages, up from 54 percent of counties in both the previous quarter and the third quarter of 2019.
Counties with at least 1 million people that are less affordable than their historic averages (indexes below 100 are considered less affordable compared to their historic averages) include Los Angeles County, CA; Harris County (Houston), TX; Maricopa County (Phoenix), AZ; San Diego County, CA and Miami-Dade County, FL.
Among counties with at least 1 million people, those where the affordability indexes have declined the most since the third quarter of 2019 are Philadelphia County, PA (index down 10 percent); Franklin County (Columbus), OH (down 8 percent); Contra Costa County, CA (outside San Francisco) (down 6 percent); Dallas County, TX (down 6 percent) and Broward County (Fort Lauderdale), FL (down 6 percent).
The biggest annual decreases among other counties include Cumberland County (Fayetteville), NC (down 24 percent); St. Louis County, MO (down 22 percent); Rapides Parish (Alexandria), LA (down 20 percent); Fairfield County (Stamford), CT (down 17 percent) and Cumberland County (Vineland), NJ (17 percent).
Counties with the worst affordability indexes are Lackawanna County (Scranton), PA (index of 61); Genesee County (Flint), MI (65); Muskegon County, MI (69); Saginaw County, MI, (72) and Canyon County, ID (outside Bose) (76).
Remaining markets more affordable than historic averages
Among the 487 counties in the report, 179 (37 percent) are more affordable than their historic affordability averages in the third quarter of 2020, down from 46 percent in both the second quarter of 2020 and the third quarter of last year.
Counties with a population greater than 1 million that are more affordable than their historic averages (indexes of more than 100 are considered more affordable compared to their historic averages) include New York County (Manhattan), NY (index of 114); Suffolk County (Long Island), NY (113); Montgomery County, MD (outside Washington, D.C.) (113); Cook County (Chicago), IL (111) and Fairfax County, VA (outside Washington, D.C.) (110).
Counties with the best affordability indexes in the third quarter of 2020 are Luzerne County (Wilkes-Barre), PA (index of 148); Macon County (Decatur), IL (136); Sussex County, NJ (outside New York City) (131); Butte County (Chico), CA (130) and Schuylkill County, PA (outside Allentown) (130).
Counties with at least 1 million people that have seen the biggest annual improvement in their affordability indexes from the third quarter of last year include Kings County (Brooklyn), NY (up 17 percent); Queens County, NY (up 8 percent); New York County (Manhattan), NY (up 7 percent); Bronx County, NY (up 4 percent) and Montgomery County, MD (outside Washington, DC) (up 2 percent).
The biggest quarterly gains among other counties include Luzerne County (Wilkes-Barre), PA (index up 50 percent); Richmond County (Staten Island), NY (up 24 percent); Baltimore City/County MD (up 21 percent); Broome County (Binghamton), NY (up 18 percent) and Ector County (Odessa), TX (up 17 percent).
To learn more about the data behind this article and what Attom Data Solutions has to offer, visit https://www.attomdata.com/.


Sign up to receive our stories in your inbox.
Data is changing the speed of business. Investors, Corporations, and Governments are buying new, differentiated data to gain visibility make better decisions. Don't fall behind. Let us help.


Sign up to receive our stories in your inbox.
Data is changing the speed of business. Investors, Corporations, and Governments are buying new, differentiated data to gain visibility make better decisions. Don't fall behind. Let us help.