
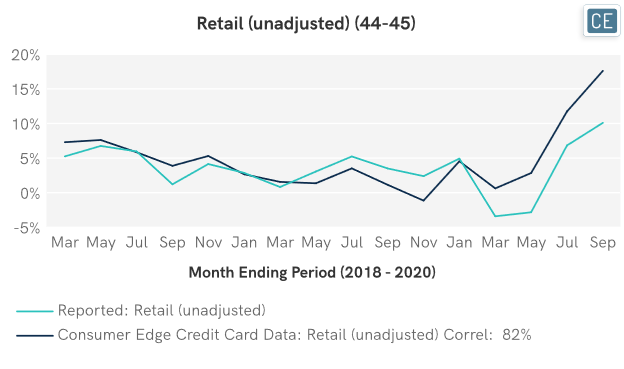
Consumer Edge credit card data has been very effective in predicting Macro-level economic growth trends. For the unadjusted Retail sales number that the Census Bureau reports every month, government data accelerated +730 bps and CE data caught this acceleration with data delivered well in advance of the report. Pent-up demand may be a key driver of this acceleration, as the September growth rate was higher than even any 2019 monthly growth rates.
Macro Credit Card vs. Census Data
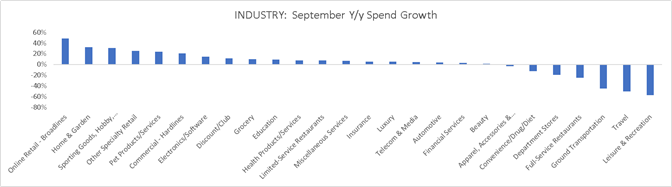
However, the boost in consumer spending did not hit all industries equally. Consumer Edge recently launched enhanced industry mappings with additional granularity, allowing us to track 26 different industries (though not all are included in the Census “Retail” definition) and for companies to see how they are performing versus those industry aggregates. Online Broadlines sales from multicategory e-commerce players grew the most in September at almost 50% y/y. This was followed by growth in Home & Garden and Sporting Goods, Hobby, Toy & Game at over 30% each. Although it may not be surprising that Travel saw close to the largest spend declines with sales cut by more than half y/y in September, it might be more unexpected that Leisure & Recreation saw an even more dramatic dropoff at almost -60% less spend in September 2020 than September 2019.
Industry Growth
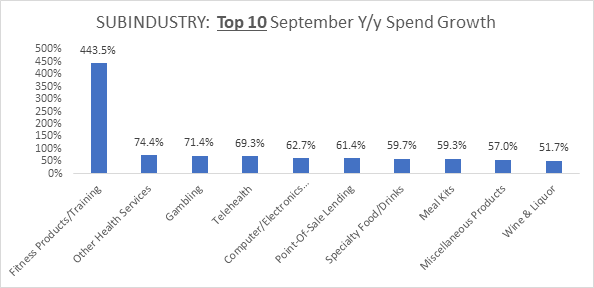
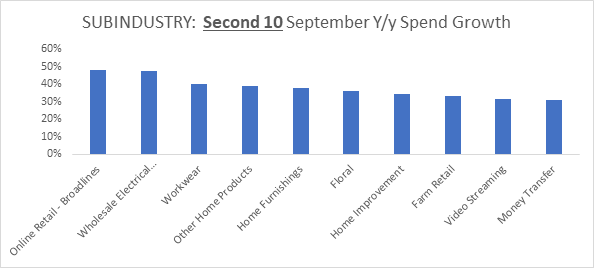
A deeper analysis into subindustry growth provides further insight. Consumer Edge’s recent enhancements now allow companies to compare growth rates across 125 different subindustries, benchmarking their own performance against a narrower set of competitors and seeing a broader range of potential growth categories for expansions/partnerships. Wellness seems to be a large driver of current consumer spending growth, with three of four largest growth subindustries in September wellness-adjacent: Fitness Products/Training (444% y/y spend growth), Other Health Services (74% y/y spend growth), and Telehealth (69% y/y spend growth). Consumers substituting online or at-home options for the declining Leisure & Recreation industry appears to be a big driver as well – in addition to the shift into the at-home products offered in Fitness Products/Training, there was also a shift into Gambling (71% y/y spend growth), which includes many online gaming options and does not include businesses such as casinos with a lodging component. Once the data is defined at this level of granularity, it is interesting to note that Online Retail – Broadlines doesn’t even make it into the Top 10 Subindustries in terms of y/y spend growth.
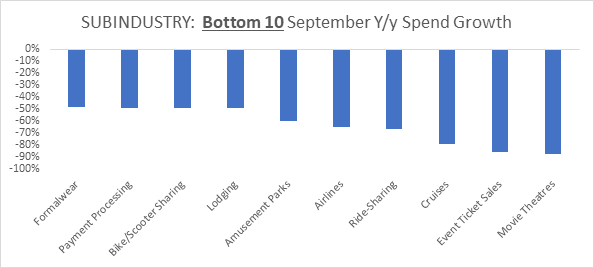
The subindustries showing the sharpest y/y declines are largely concentrated in in-person entertainment and travel such as Movie Theatres (-88% y/y spend decline), Event Ticket Sales (-86% y/y spend decline), and Cruises (-79% y/y spend decline). However, two interesting unrelated subindustries in the top 10 y/y spend decliners are Payment Processing (-48% y/y spend decline), which is likely linked to devastating sales drops and closures for small businesses, and Formalwear, which is a physical good casualty of declining attendance at events.
Subindustry Growth
 Understanding how overall economic spending is trending, as well as which industries and subindustries are seeing growth and declines in spend over time, can be a useful tool for companies. This information in CE Vision allows them to track their own sales levels versus benchmarks, to evaluate where they may be outperforming or underperforming competitors. It also allows them to see which sectors of the economy are showing the strongest growth, which may help inform decisions about new category entries or potential partnerships with complementary businesses in up-and-coming subindustries.
To learn more about the data behind this article and what Consumer Edge Research has to offer, visit www.consumer-edge.com.


Sign up to receive our stories in your inbox.
Data is changing the speed of business. Investors, Corporations, and Governments are buying new, differentiated data to gain visibility make better decisions. Don't fall behind. Let us help.


Sign up to receive our stories in your inbox.
Data is changing the speed of business. Investors, Corporations, and Governments are buying new, differentiated data to gain visibility make better decisions. Don't fall behind. Let us help.