National home prices increased 7.3% year over year in October 2020, according to the latest CoreLogic Home Price Index (HPI®) Report. The October 2020 HPI gain was up from the October 2019 gain of 3.5% and was the highest year-over-year gain since April 2014. The pandemic has shifted home buyer interest toward detached rather than attached homes as detached homes have more living area and tend to be located in less densely populated neighborhoods. Prices of single-family detached homes posted an annual increase of 7.9% in October, compared with a 4.5% annual price rise in attached homes.
Figure 1: Home Prices Typically Fall During Recessions, But Prices Up in 2020
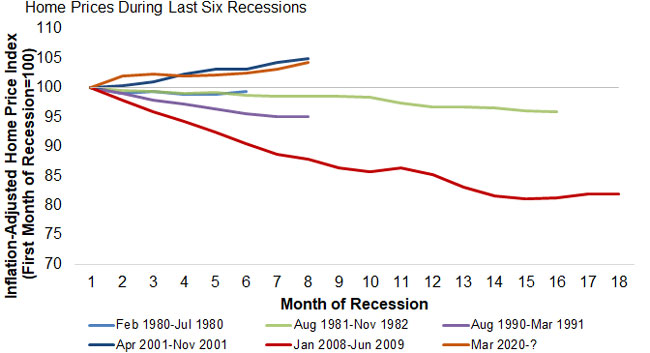
The economic downturn that started in March 2020 is predicted to slow the HPI increase to 1.9% by October 2021, which would be the lowest increase in annual home prices since March 2012. Figure 1 shows movements in the inflation-adjusted HPI[1] for the six most recent recessions starting from the first month and through the end of each recession. Numbers below 100 indicate falling home prices, which has been a feature of four of the six recessions. However, at seven months in, the 2020 recession is following the path of the 2001 recession, which is the only other one of the six with increasing home prices. The worst of the six recessions was the Great Recession that started in 2008, which was characterized by excess supply of homes for sale, which is not the case in today’s tight-supply housing market.
Figure 2: Home Prices Accelerate at All Price Levels
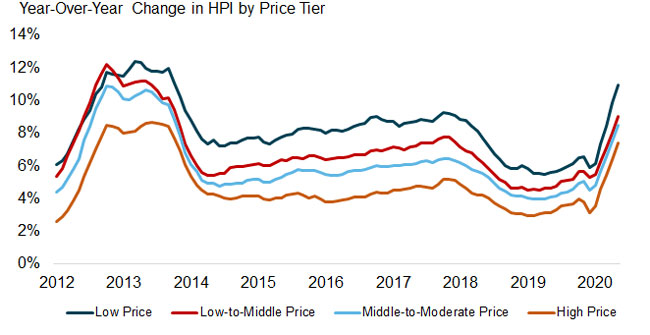
CoreLogic analyzes four individual home-price tiers that are calculated relative to the median national home sale price[2]. Home price growth has accelerated for all four price tiers this year to the highest rates since 2014. The lowest price tier increased 10.9% year over year in October 2020, compared with 9% for the low- to middle-price tier, 8.5% for the middle- to moderate-price tier, and 7.4% for the high-price tier.
Figure 3: All States Showed Annual Increases in HPI in October
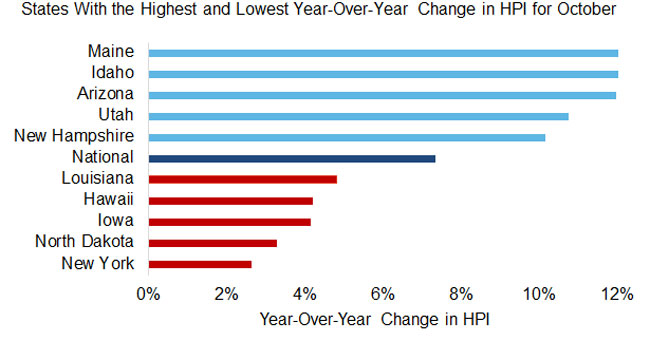
Figure 3 shows the year-over-year HPI growth in October 2020 for the 5 highest- and lowest-appreciating states. All states showed annual increases in HPI in October, and Maine led the states in appreciation with annual appreciation of 14.9%. At the low end, New York saw an increase in home prices of 2.6%.
© 2020 CoreLogic, Inc. All rights reserved
[1] The Consumer Price Index (CPI) Less Shelter was used to create the inflation-adjusted HPI. It is important to adjust the HPI for inflation to compare recessions, especially since two of the recessions occurred during very high inflation periods.
[2] The four price tiers are based on the median sale price and are as follows: homes priced at 75% or less of the median (low price), homes priced between 75% and 100% of the median (low-to-middle price), homes priced between 100% and 125% of the median (middle-to-moderate price) and homes priced greater than 125% of the median (high price).
To learn more about the data behind this article and what CoreLogic has to offer, visit https://www.corelogic.com/.


Sign up to receive our stories in your inbox.
Data is changing the speed of business. Investors, Corporations, and Governments are buying new, differentiated data to gain visibility make better decisions. Don't fall behind. Let us help.


Sign up to receive our stories in your inbox.
Data is changing the speed of business. Investors, Corporations, and Governments are buying new, differentiated data to gain visibility make better decisions. Don't fall behind. Let us help.