Source: https://www.corelogic.com/blog/2020/12/us-for-sale-home-supply-tightened-during-pandemic.aspx
After the pandemic took hold in the U.S. in early 2020, stay-at-home orders and uncertainty in the economy delayed listings from going live on the market. The typical spring home buying season was pushed into summer in 2020 and continued into fall. Meanwhile, low interest rates motivated home buyers. As a result of low inventory and strong demand, the national supply of homes for sale fell to 2.2 months in October, the lowest since 2000, only about one fifth of the October 2010 level.
Figure 1: Tightest Supply Since 2000
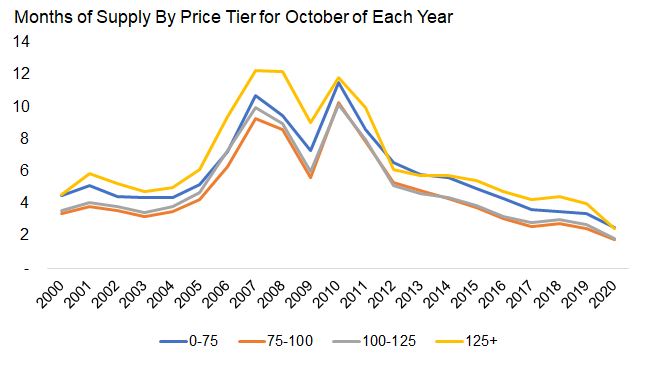
Figure 1 breaks out the months of supply of for-sale homes for October of each year into four price tiers: low price (0-75 percent of the median list price), low-to-middle price (75-100 percent of the median list price), middle-to-moderate price (100-125 percent of the median list price) and high price (125 percent or more of the median list price). Supply is lowest for the low-to-middle and middle-to-moderate price tiers and highest for the high and low-price tiers.
The level of supply fell at all price levels in October 2020 from a year earlier. Here’s how each price tier’s months of supply in October 2020 compares with previous years:
Figure 2: Homes Sold Fast
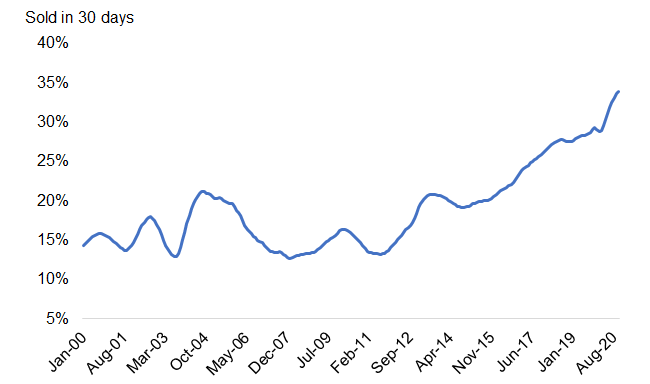
Figure 3: Inventory Low
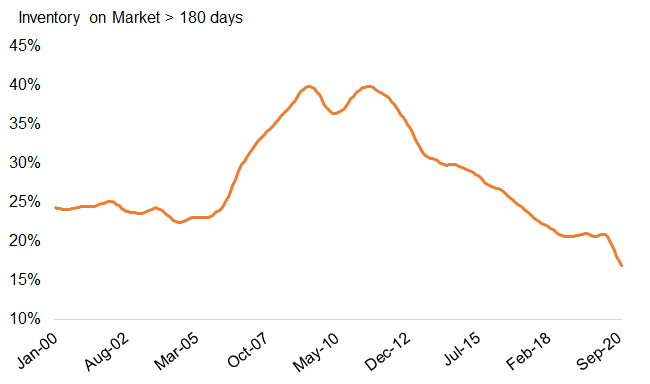
With demand strong and supply tight, many homes didn’t spend long on the market in 2020. Figure 2 shows that over the past two years the share of homes selling within 30 days of the initial list date[1] has been at the highest level since 2000. In October 2020, the share selling within 30 days was 33.9%, higher than the pre-crisis peak of 21.2% in August 2004 and almost triple the level during the January 2008 trough. Figure 3 shows the share of the for-sale inventory that was on the market for more than 180 days. In October 2020, that share was 16.9%, which was 3.7 percentage points lower than in October 2019, less than half of the July 2011 peak of 39.9%.
Figure 4: Supply is Down is Most Large Metros
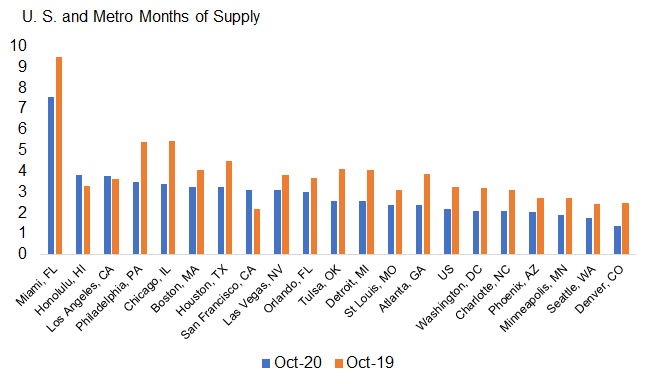
Figure 4 shows the months of supply in the U.S.[1] and selected metropolitan areas in October 2020 and October 2019. Nationwide, the inventory decreased 18.5% year-over-year, with the supply at 2.2 months in October 2020 compared with 3.2 months in October 2019. Out of 20 metropolitan areas, 17 showed declines in months’ supply in October 2020 compared with a year earlier. Chicago had the largest drop in supply, decreasing 2.1 months, from 5.5 in October 2019 to 3.4 in October 2020.
For-sale inventory hit a low in 2020 as many owners postponed listing their homes and buyers were motivated by low interest rates. This inventory shortage has intensified upward pressure on home price appreciation as consumers compete for the limited number of homes on the market.
To learn more about the data behind this article and what CoreLogic has to offer, visit https://www.corelogic.com/.


Sign up to receive our stories in your inbox.
Data is changing the speed of business. Investors, Corporations, and Governments are buying new, differentiated data to gain visibility make better decisions. Don't fall behind. Let us help.


Sign up to receive our stories in your inbox.
Data is changing the speed of business. Investors, Corporations, and Governments are buying new, differentiated data to gain visibility make better decisions. Don't fall behind. Let us help.