
Source: https://www.advan.us/blog.php
GameStop Corp (NYSE: GME) has been the focus of the investment community for the last couple days and for a justifiable reason. A lot has been written about the technicals of the trade and the various market participants, how they affect the supply and demand and drive the stock price. But we have decided to spin it a different way and look at the fundamentals of the issuer.
This is our second blogpost about GME, our first one back in October 2019 explored the misconceptions that can result from using location data incorrectly.
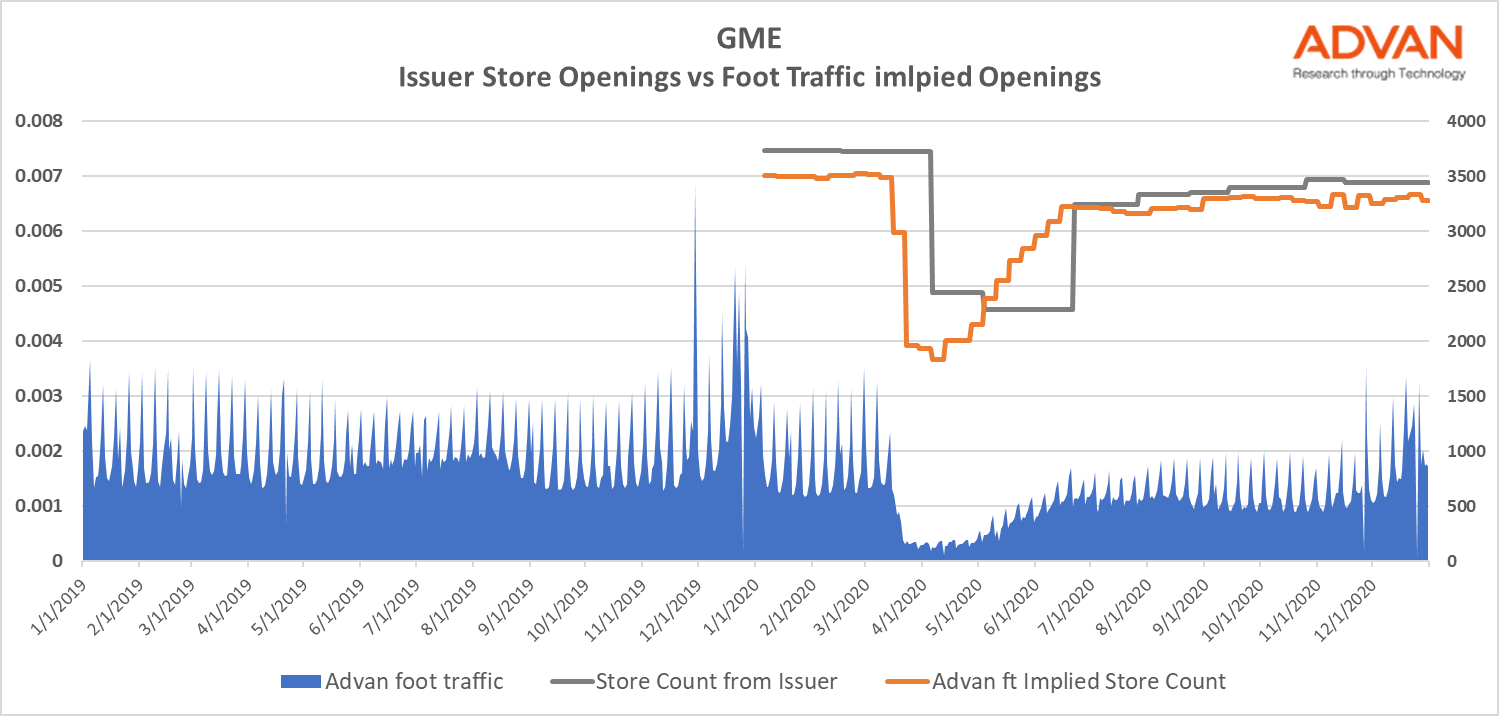
In order to analyze the fundamentals of the business we looked at the foot traffic (unique visitors to all operational stores) of the retailer since 2019. The blue shaded line in the chart represents the daily foot traffic. Patterns such as the weekly spikes are due to the fact that more shoppers visit GME stores during the weekend than on weekdays. In addition to this, the seasonality around the holidays can be easily seen (more traffic in December, for example, and a big spike on Black Friday). The chart also clearly shows us the exact dates when all stores are closed, such as New Year’s day, when the traffic goes to zero. From a macro perspective, the most predominate observation is the big drop during the COVID period and the slow recovery starting in May 2020. Note that foot traffic has not returned to 2019 levels yet. For instance, the whole month of December 2020 saw 33.68% less foot traffic than the same month in 2019.
By using foot traffic as the key input in our proprietary algorithm, we can define whether a store is open or closed at any given time. Put simply: if there are visitors in the store then we know the store is open, if there are no visitors then we know it is closed. The reality is slightly more complex than this since we don’t simply look at the visitors alone for a given day but we compare them with its historical foot traffic patterns to better define whether the store is open or close.
There are many reasons a store could be closed, for example the retailer may be renovating the property, perhaps there was an incident on the store that led to its temporary closing, or the retailer may have decided to entirely shut down an unprofitable location. In 2020, the most common scenario was temporary store closings due to COVID 19.
On the chart, the grey and amber lines represent the store counts as reported by the issuer vs the Advan store counts as implied by our foot traffic measurements. Not only is the Advan traffic a more accurate measurement of the stores operating at any given time but it is also a leading indicator. Investors can see in real-time whether the stores are open or closed with much more granular (weekly) updates than those reported by the issuer, which are typically on an approximately quarterly basis.
To learn more about the data behind this article and what Advan has to offer, visit https://advanresearch.com/.


Sign up to receive our stories in your inbox.
Data is changing the speed of business. Investors, Corporations, and Governments are buying new, differentiated data to gain visibility make better decisions. Don't fall behind. Let us help.


Sign up to receive our stories in your inbox.
Data is changing the speed of business. Investors, Corporations, and Governments are buying new, differentiated data to gain visibility make better decisions. Don't fall behind. Let us help.