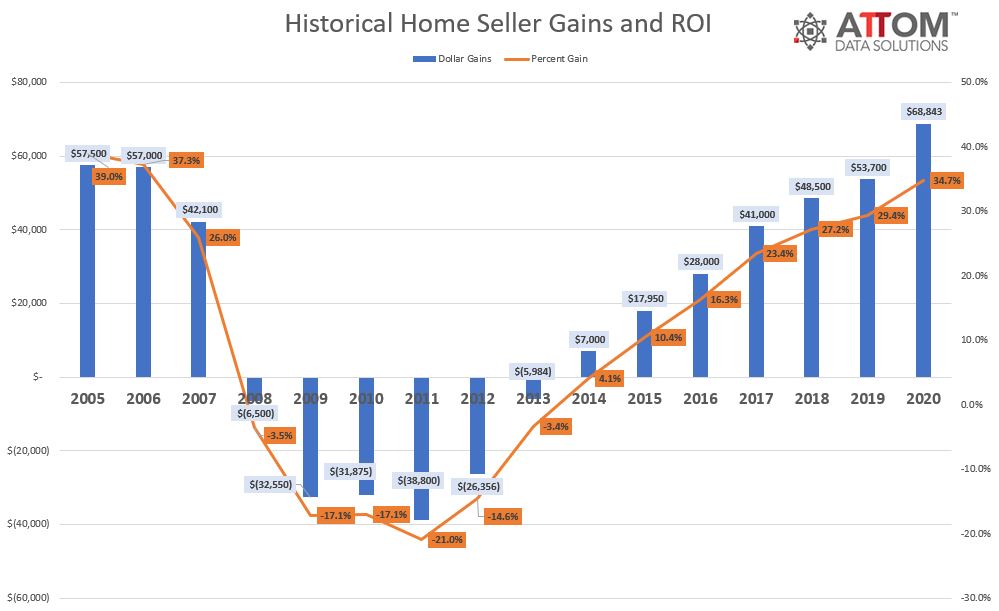
ATTOM Data Solutions, curator of the nation’s premier property database, today released its Year-End 2020 U.S. Home Sales Report, which shows that home sellers nationwide in 2020 realized a home-price gain of $68,843 on the typical sale, up from $53,700 in 2019 and $48,500 two years ago. Profits rose in more than 90 percent of housing markets with enough data to analyze and the latest figure, based on median purchase and resale prices, marked the highest level in the United States since at least 2005.
The $68,843 profit on median priced single-family homes and condos represented a 34.7 percent return on investment compared to the original purchase price, up from 29.4 percent last year and 27.2 percent in 2018, to the highest average home-seller return on investment since 2006.
Both raw profits and ROI have improved nationwide for nine straight years. And last year’s gain in ROI – up more than five percentage points – marked the largest annual increase since 2017. Profits shot up as the national median home price rose 12.8 percent in 2020 to $266,250 – a record high.
The combination of rising profits and record prices came during a year when the national housing market fended off damage that afflicted wide swaths of the U.S. economy after the Coronavirus pandemic of 2020 began spreading across the country in February. Unemployment rose to levels not seen since the Great Depression as millions of businesses temporarily or permanently closed or cut back. But a housing market boom that began in 2012 continued into its ninth year as a spate of buyers relatively unaffected financially by the pandemic – including a cluster looking to escape virus-prone urban areas – chased a declining supply of houses and pushed prices ever higher.
“Last year marked a unique year in the history of home prices and profits in the United States. A once-in-a-century health crisis tore through much of the nation’s economy but seemed to have the opposite effect on the housing market,” said Todd Teta, chief product officer at ATTOM Data Solutions. “Demand remained strong as people who could afford the space and relative safety of single-family homes did just that, aided by super-low mortgage rates and a strong stock market. But they went after a narrowing supply of housing stock, so prices soared and so did seller profits. While it’s unclear how long that will last, in the annals of history, there will be few years recorded as better for sellers and more challenging for buyers.”
Among 132 metropolitan statistical areas with a population greater than 200,000 and sufficient sales data, those in western states continued to reap the highest returns on investment, with concentrations on or near the West Coast. The top 10 metro areas with the highest ROIs on typical home sales were all in the West, led by in San Jose, CA (87.3 percent return on investments); Seattle, WA (72.1 percent); Salem, OR (69.6 percent); Spokane, WA (69.2 percent) and San Francisco, CA (68.2 percent).
Prices rise at least 10 percent in more than half the country as most markets hit new highs
The U.S. median home price increased 12.8 percent in 2020, hitting an all-time annual high of $266,250. The annual home-price appreciation in 2020 outpaced the combined increases of 4.4 percent in 2019 and the 4.8 percent increase in 2018. The increase in 2020 topped all annual gains since at least 2006 in the United States.
Since the U.S. housing market began recovering in 2012 from the Great Recession of the late 2000s, the national median home price has risen 72.3 percent.
All 132 metropolitan statistical areas with a population of 200,000 or more and sufficient home price data saw median prices increase in 2020, while 69 saw prices spike at least 10 percent. Those with the biggest year-over-year increases in median home prices were Bridgeport, CT (up 21.4 percent); Myrtle Beach, SC (up 20.5 percent); Crestview-Fort Walton Beach, FL (up 19.6 percent); Boise, ID (up 18.7 percent) and Hilton Head, SC (up 18.3 percent).
The largest median-price increases in metro areas with a population of at least 1 million in 2020 came in Milwaukee, WI (up 15.3 percent); Memphis, TN (up 15.1 percent); Phoenix, AZ (up 14.9 percent); Birmingham, AL (up 13.7 percent) and Seattle, WA (up 12.9 percent).
Home prices in 2020 reached new peaks in 129 of the 132 metros (97 percent) analyzed, including New York, NY; Los Angeles, CA; Chicago, IL; Dallas, TX and Houston, TX.
The smallest gains among the 132 metro areas were in Worcester, MA (up 1.9 percent); Harrisburg, PA (up 2 percent); Pittsburgh, PA (up 3.3 percent); Boston, MA (up 3.5 percent) and Daphne-Fairhope, AL (up 4.1 percent).
Profit margins increase in more than 90 percent of nation
Profit margins on typical home sales rose in 121 of the 132 metro areas with sufficient data to analyze in 2020 (92 percent).
The largest annual increases in investment returns came in Mobile, AL (margin up 181.1 percent); Augusta, GA (up 112.8 percent); Huntsville, AL (up 84.4 percent); Davenport, IA (up 75.6 percent) and New Haven, CT (up 73.4 percent).
Among metro areas with a population of at least 1 million in 2020, the largest annual ROI increases were in Birmingham, AL (up 71.5 percent); Hartford, CT (up 56.9 percent); Cleveland, OH (up 52.2 percent); Rochester, NY (up 49.9 percent) and St. Louis, MO (up 45.7 percent).
The biggest annual decreases in investment returns in 2020 came in Honolulu, HI (down 11.8 percent); Greeley, CO (down 8.9 percent); Miami, FL (down 7.7 percent); Cape Coral, FL (down 7.4 percent) and San Francisco, CA (down 5.7 percent).
Aside from Miami and San Francisco, the only metro areas with a population of at least 1 million and declining profit margins in 2020 were Pittsburgh, PA (down 4.1 percent); Denver, CO (down 3.3 percent) and Dallas, TX (down 0.9 percent).
Homeownership tenure hits another record nationwide
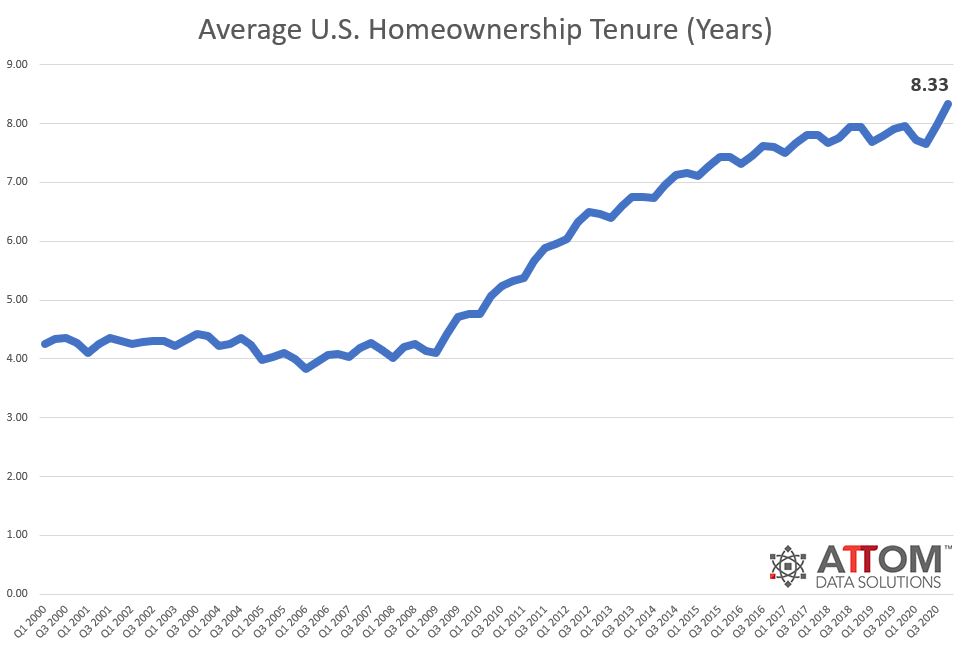
Homeowners who sold in the fourth quarter of 2020 had owned their homes an average of 8.33 years, up from 7.98 years in the previous quarter and 7.96 years in the fourth quarter of 2019. The latest figure represented the longest average home-seller tenure since at least the first quarter of 2000, the earliest period of available data. Tenures were up, year over year, in 73, or 68 percent, of the 107 metro areas with a population of at least 200,000 and sufficient historical data.
As in the third quarter of 2020, the top tenures for home sellers in the fourth quarter of 2020 were all in Connecticut: Bridgeport, CT (13.15 years); Norwich, CT (12.98 years); Torrington, CT (12.83 years); New Haven, CT (12.47 years) and Hartford, CT (12.23 years).
Counter to the national trend, 34 of the 107 metro areas (32 percent) posted a year-over-year decrease in average home-seller tenure, led by Madera, CA (down 10 percent); Champaign, IL (down 9 percent); Salem, OR (down 9 percent); Boston, MA (down 8 percent) and Cincinnati, OH (down 8 percent.
Cash sales at 13-year low in 2020
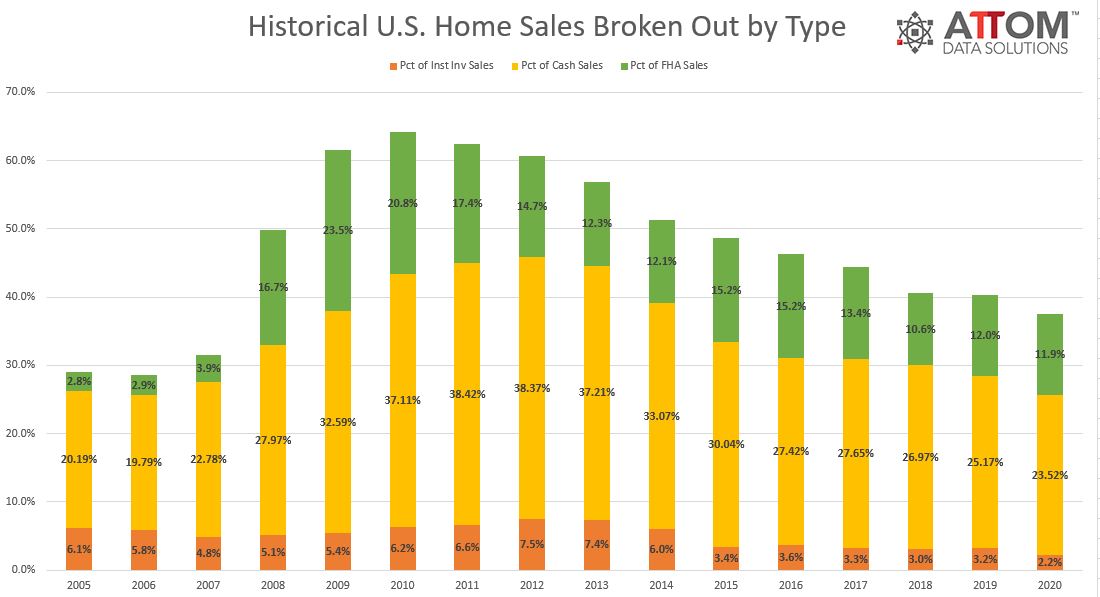
Nationwide, all-cash purchases accounted for 23.5 percent of single-family home and condo sales in 2020, the lowest level since 2007. The latest figure was down from 25.2 percent in 2019 and 27 percent in 2018, and was well off the 38.4 percent peaks in 2011 and 2012.
Among metropolitan statistical areas with a population of at least 200,000 and sufficient cash-sales data, those where cash sales represented the largest share of all transactions in 2020 were the same as in 2019: Macon, GA (48.7 percent of sales); Naples, FL (47.2 percent); Chico, CA (46 percent); Fort Smith, AR (43 percent) and Montgomery, AL (41.8 percent).
U.S. distressed sales share at 15-year low
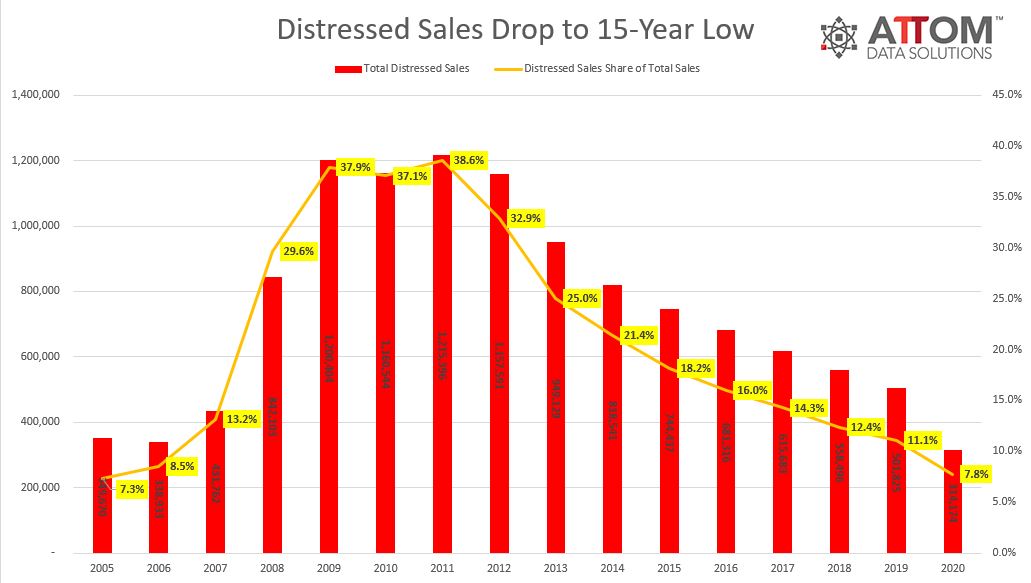
Distressed home sales — including bank-owned (REO) sales, third-party foreclosure auction sales and short sales — accounted for 7.8 percent of all U.S. single-family home and condo sales in 2020, down from 11.1 percent in 2019 and 12.4 percent in 2018. The latest figure was less than one-quarter of the peak of 38.6 percent in 2011 and marked the lowest point since 2005.
States where distressed sales comprised the largest portion of total sales in 2020 were Connecticut (15.3 percent of sales), Rhode Island (14.7 percent), Delaware (13.8 percent), Illinois (12.6 percent) and Maryland (12.6 percent). Those with the lowest were Utah (2.1 percent), Maine (2.2 percent), Idaho (2.6 percent), Montana (3.2 percent) and Mississippi (3.5 percent).
Among 196 metropolitan statistical areas with a population of at least 200,000 and with sufficient data, those where distressed sales represented the largest portion of all sales in 2020 were Chico, CA (18 percent of sales); Atlantic City, NJ (17.6 percent); Peoria, IL (16.8 percent); New Haven, CT (16.2 percent) and Norwich, CT (16.2 percent).
Those with the smallest shares were Provo, UT (1.8 percent of sales); Salt Lake City, UT (1.9 percent); Ogden, UT (2.1 percent); Savannah, GA (2.3 percent) and San Jose, CA (2.9 percent).
Among 53 metropolitan statistical areas with a population of at least 1 million, those with the highest levels of distressed sales in 2020 were Hartford, CT (15.5 percent of sales); Providence, RI (14.9 percent); Baltimore, MD (13.9 percent); Cleveland, OH (13.5 percent) and Chicago, IL (12.2 percent).
Aside from San Jose and Salt Lake City, metro areas with at least 1 million people that had the lowest shares were Austin, TX (3.1 percent of sales); San Francisco, CA (3.6 percent) and Seattle, WA (3.8 percent).
Institutional investing at lowest level this century
Institutional investors nationwide accounted for 2.2 percent of all single-family home and condo sales in 2020 – the lowest level since at least 2000. The latest figure was down from 3.2 percent in 2019 and 3 percent in 2018.
Among metropolitan statistical areas with a population of at least 200,000 and sufficient institutional-investor sales data, those with the highest levels of institutional-investor transactions in 2020 were Memphis, TN (7 percent of sales); Atlanta, GA (6.8 percent); Laredo, TX (6.2 percent); Fort Wayne, IN (6.2 percent) and Montgomery, AL (6.1 percent).
FHA sales remain low as portion of all transactions
Nationwide, buyers using Federal Housing Administration (FHA) loans accounted for 11.9 percent of all single-family home and condo purchases in 2020, down from 12 percent in 2019 but up from 10.6 percent in 2018. Still, the 2020 percentage marked the second-lowest annual level since 2008.
Among metropolitan statistical areas with a population of at least 200,000 and sufficient FHA-buyer data in 2020, those with the highest share of purchases made with FHA loans again were in Texas. They were led by McAllen, TX (31.5 percent of sales); El Paso, TX (26.6 percent); Beaumont, TX (26.6 percent); Amarillo, TX (24.9 percent); and Visalia, CA (24.7 percent).
Report methodology
The ATTOM Data Solutions U.S. Home Sales Report provides percentages of distressed sales and all sales that are sold to investors, institutional investors and cash buyers, a state and metropolitan statistical area. Data is also available at the county and zip code level upon request. The data is derived from recorded sales deeds, foreclosure filings and loan data. Statistics for previous quarters are revised when each new report is issued as more deed data becomes available.
Definitions
All-cash purchase: sale where no loan is recorded at the time of sale and where ATTOM has coverage of loan data.
Homeownership tenure: for a given market and given quarter, the average time between the most recent sale date and the previous sale date, expressed in years.
Home seller price gains: the difference between the median sales price of homes in a given market in a given quarter and the median sales price of the previous sale of those same homes, expressed both in a dollar amount and as a percentage of the previous median sales price.
Institutional investor purchases: residential property sales to non-lending entities that purchased at least 10 properties in a calendar year.
REO sale: a sale of a property that occurs while the property is actively bank owned (REO).
Short sale: a sale of a property where the sale price is less than (short) the combined amount of loans secured by the property.
Third-party foreclosure auction sale: a sale of a property that occurs at the public foreclosure auction (trustee’s sale or sheriff’s sale) in which the property is sold to a third-party buyer and does not transfer back to the foreclosing bank.
To learn more about the data behind this article and what Attom Data Solutions has to offer, visit https://www.attomdata.com/.


Sign up to receive our stories in your inbox.
Data is changing the speed of business. Investors, Corporations, and Governments are buying new, differentiated data to gain visibility make better decisions. Don't fall behind. Let us help.


Sign up to receive our stories in your inbox.
Data is changing the speed of business. Investors, Corporations, and Governments are buying new, differentiated data to gain visibility make better decisions. Don't fall behind. Let us help.