ATTOM Data Solutions’ new Q4 2020 U.S. Home Equity and Underwater Report shows there were 17.8 million residential properties in the U.S. considered equity-rich in the fourth quarter of 2020. According to the report, the combined estimated amount of loans secured by those properties was 50 percent or less of their estimated market value.
ATTOM’s latest home equity and underwater analysis reported that the count of equity-rich properties in Q4 2020 represented 30.2 percent, or about one in three, of the 59 million mortgaged homes in the U.S. That figure was up from 28.3 percent in Q3 2020, 27.5 percent in Q2 2020 and 26.7 percent in Q4 2019.
The Q4 2020 report also showed that 3.2 million, or one in 18, mortgaged homes in Q4 2020 were considered seriously underwater. The combined estimated balance of loans secured by those properties was at least 25 percent more than their estimated market value. That figure represented 5.4 percent of all U.S. properties with a mortgage, down from 6 percent in Q3 2020, 6.2 percent in Q2 2020 and 6.4 percent in Q4 2019.
Also according to ATTOM’s latest home equity and underwater analysis, six of the 10 states with the biggest gains in the share of equity-rich homes from Q3 to Q4 2020 were in the West. The report noted the top five included California, where the portion of mortgaged homes considered equity-rich rose from 39.7 percent in Q3 2020 to 46.1 percent in Q4 2020, Idaho (up from 39.5 percent to 42.7 percent), Montana (up from 31.9 percent to 34.8 percent), Arizona (up from 29.4 percent to 32.3 percent) and Vermont (up from 45.1 percent to 47.8 percent).
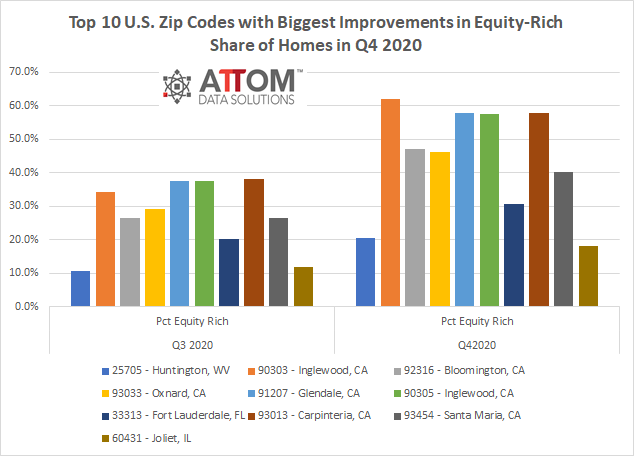
In this post, we dig deep into the data behind the Q4 report to uncover the top 10 U.S. zip codes with the biggest gains in the share of equity-rich homes from Q3 2020 to Q4 2020. Among those zips with 2,000 or more outstanding mortgages in Q4 2020, the top 10 with the biggest improvements in equity-rich share of homes include: 25705 in Huntington, WV (up from 10.5 percent to 20.6 percent); 90303 in Inglewood, CA (up from 34.4 percent to 62.1 percent); 92316 in Bloomington, CA (up from 26.4 percent to 47.0 percent); 93033 in Oxnard, CA (up from 29.2 percent to 46.3 percent); 91207 in Glendale, CA (up from 37.6 percent to 57.8 percent); 90305 in Inglewood, CA (up from 37.6 percent to 57.5 percent); 33313 in Fort Lauderdale, FL (up from 20.1 percent to 30.7 percent); 93013 in Carpinteria, CA (up from 38.1 percent to 57.8 percent); 93454 in Santa Maria, CA (up from 26.6 percent to 40.3 percent); and 60431 in Joliet, IL (up from 12.0 percent to 18.1 percent).
ATTOM’s Q4 2020 home equity and underwater analysis also reported that five of the 10 states with the biggest declines from Q3 2020 to Q4 2020 in the percentage of homes considered seriously underwater were in the South. They were led by West Virginia, (share of homes seriously underwater down from 13.8 percent to 11.4 percent), California (down from 3.7 percent to 2.4 percent), Mississippi (down from 12.6 percent to 11.4 percent), Arkansas (down from 11.7 percent to 10.7 percent) and New Jersey (down from 6.7 percent to 5.7 percent).
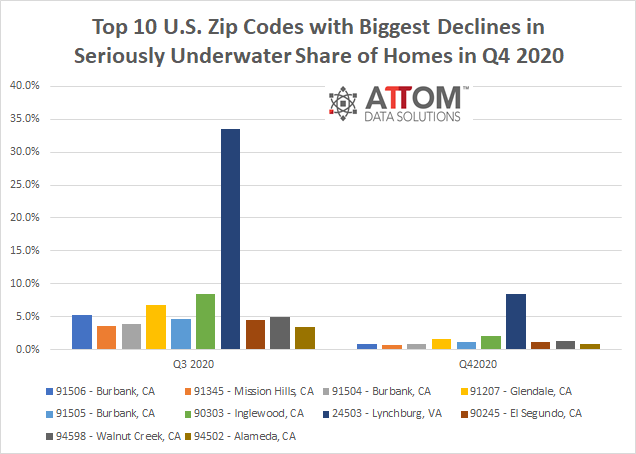
In this post, again we dig deep into the data behind the Q4 report to uncover the top 10 U.S. zip codes with the biggest declines from Q3 2020 to Q4 2020 in the percentage of homes considered seriously underwater. Among those zips with 2,000 or more outstanding mortgages in Q4 2020, the top 10 with the biggest declines in seriously underwater share of homes include: 91506 in Burbank, CA (down from 5.3 percent to .9 percent); 91345 in Mission Hills, CA (down from 3.6 percent to .8 percent); 91504 in Burbank, CA (down from 3.9 to .9 percent); 91207 in Glendale, CA (down from 6.7 percent to 1.6 percent); 91505 in Burbank, CA (down from 4.7 percent to 1.1 percent); 90303 in Inglewood, CA (down from 8.4 percent to 2.1 percent); 24503 in Lynchburg, VA (down from 33.5 percent to 8.4 percent); and 90245 in El Segundo, CA (down from 4.4 percent to 1.1 percent); 94598 in Walnut Creek, CA (down from 5.0 percent to 1.3 percent); and 94502 in Alameda, CA (down from 3.4 percent to .9 percent).
Want to learn more about equity-rich and seriously underwater property trends in your area? Contact us to find out how!
To learn more about the data behind this article and what Attom Data Solutions has to offer, visit https://www.attomdata.com/.


Sign up to receive our stories in your inbox.
Data is changing the speed of business. Investors, Corporations, and Governments are buying new, differentiated data to gain visibility make better decisions. Don't fall behind. Let us help.


Sign up to receive our stories in your inbox.
Data is changing the speed of business. Investors, Corporations, and Governments are buying new, differentiated data to gain visibility make better decisions. Don't fall behind. Let us help.