
OVERVIEW
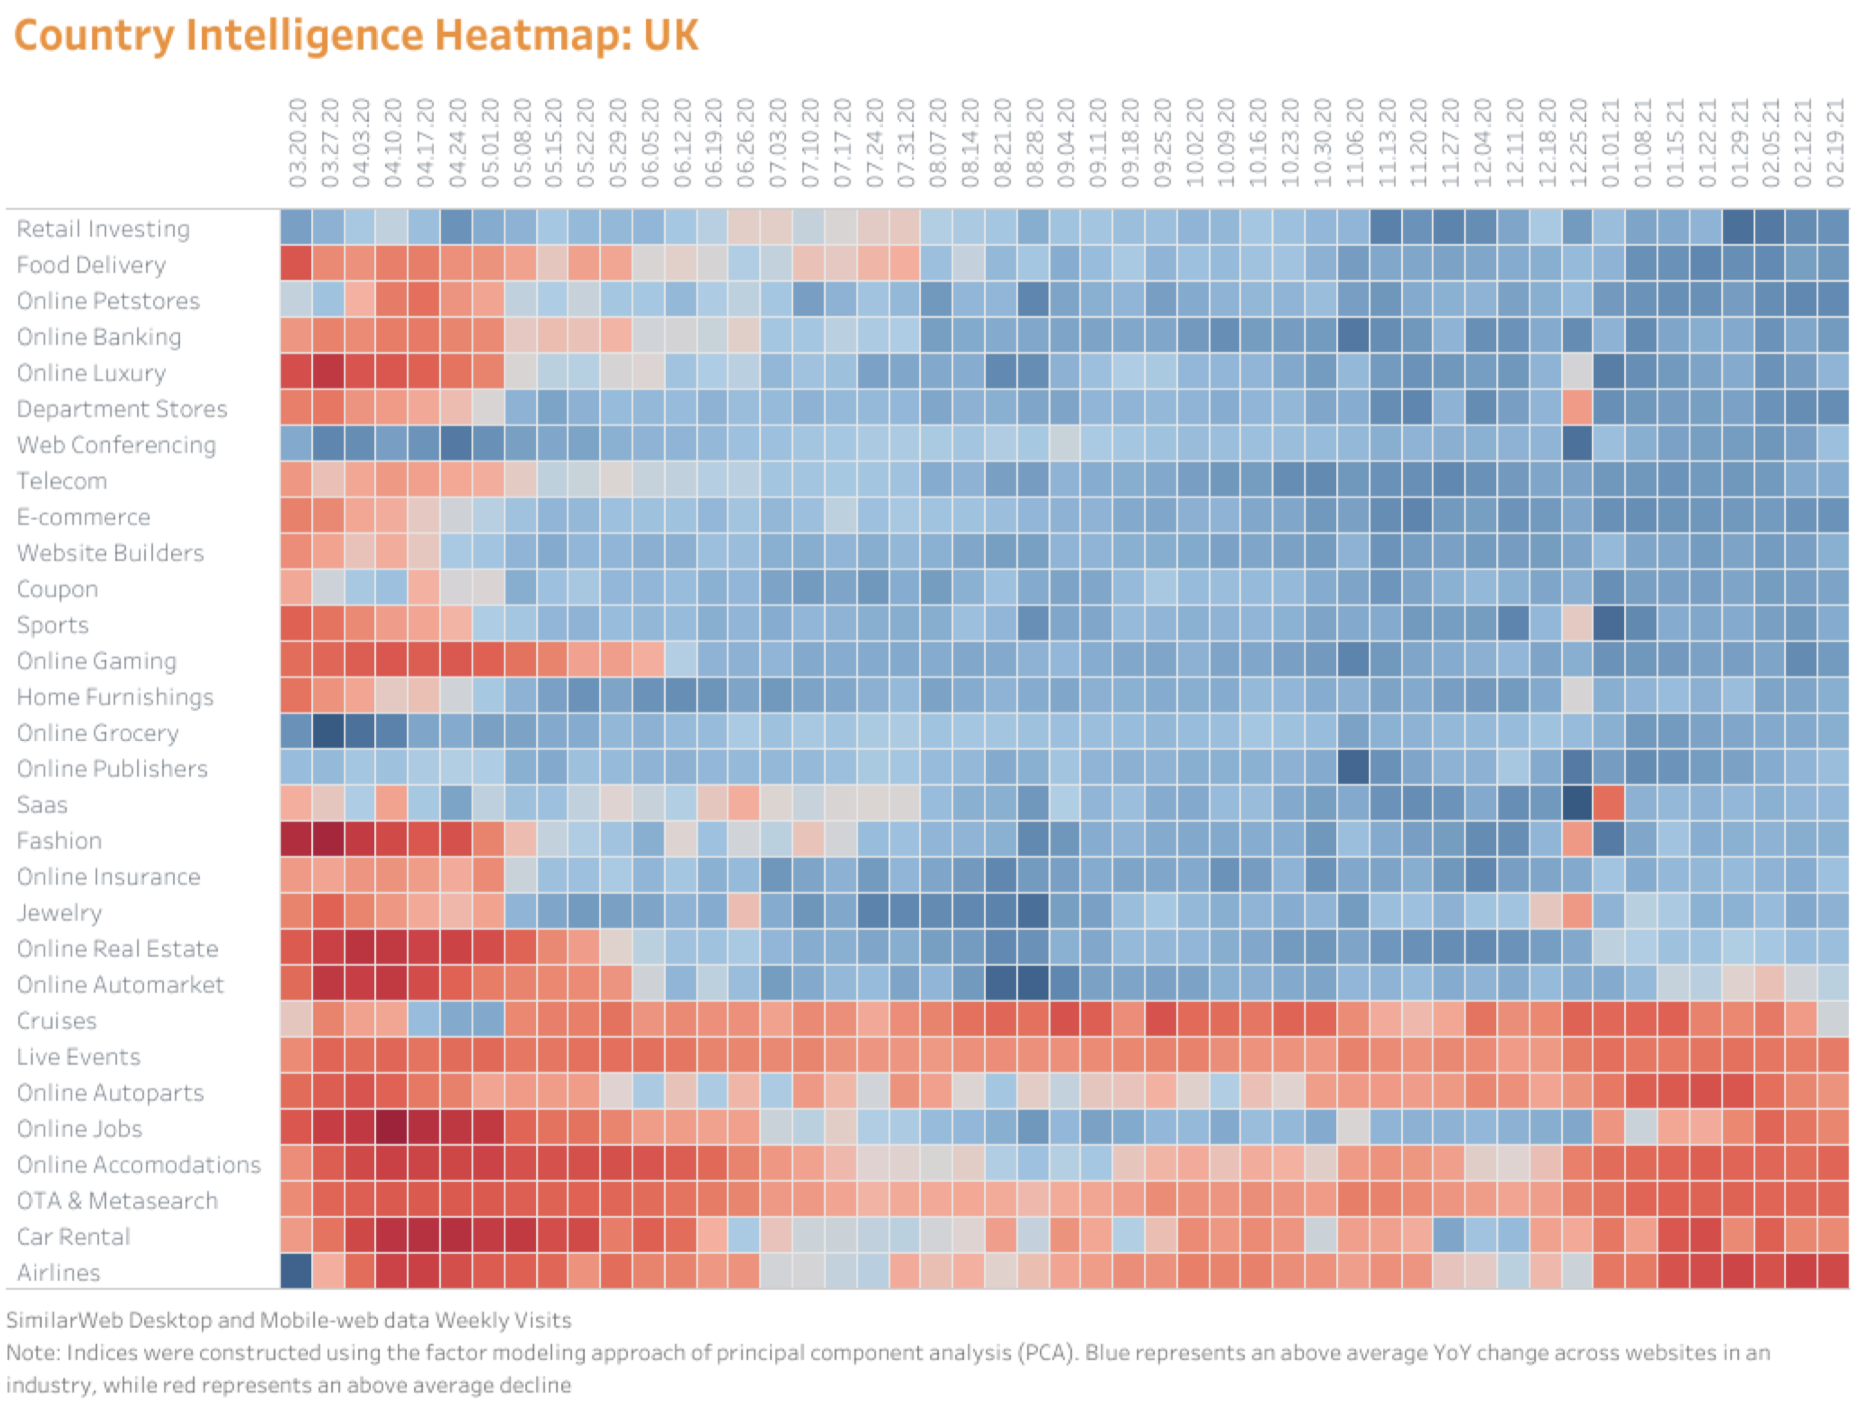
Digital Heat is an easy-to-use heatmap to help you quickly identify at scale which industries and companies are most impacted by the current economic environment. The report tracks in near real-time year-over-year (YoY) weekly website traffic trends.
On a macro level, it highlights directional trends – industries that are poised to benefit, and those that remain vulnerable. On a micro level, this monitor can help isolate differences within an industry.
This report helps analysts, traders, portfolio managers, and chief investment officers with idea generation and risk management.
KEY CHANGES THIS WEEK
CONTENTS
MACRO VIEW
What’s Changed?
SimilarWeb Industry Heatmap
Weekly Website Visits YoY Heatmap
MICRO VIEW
What’s Driving the Change?
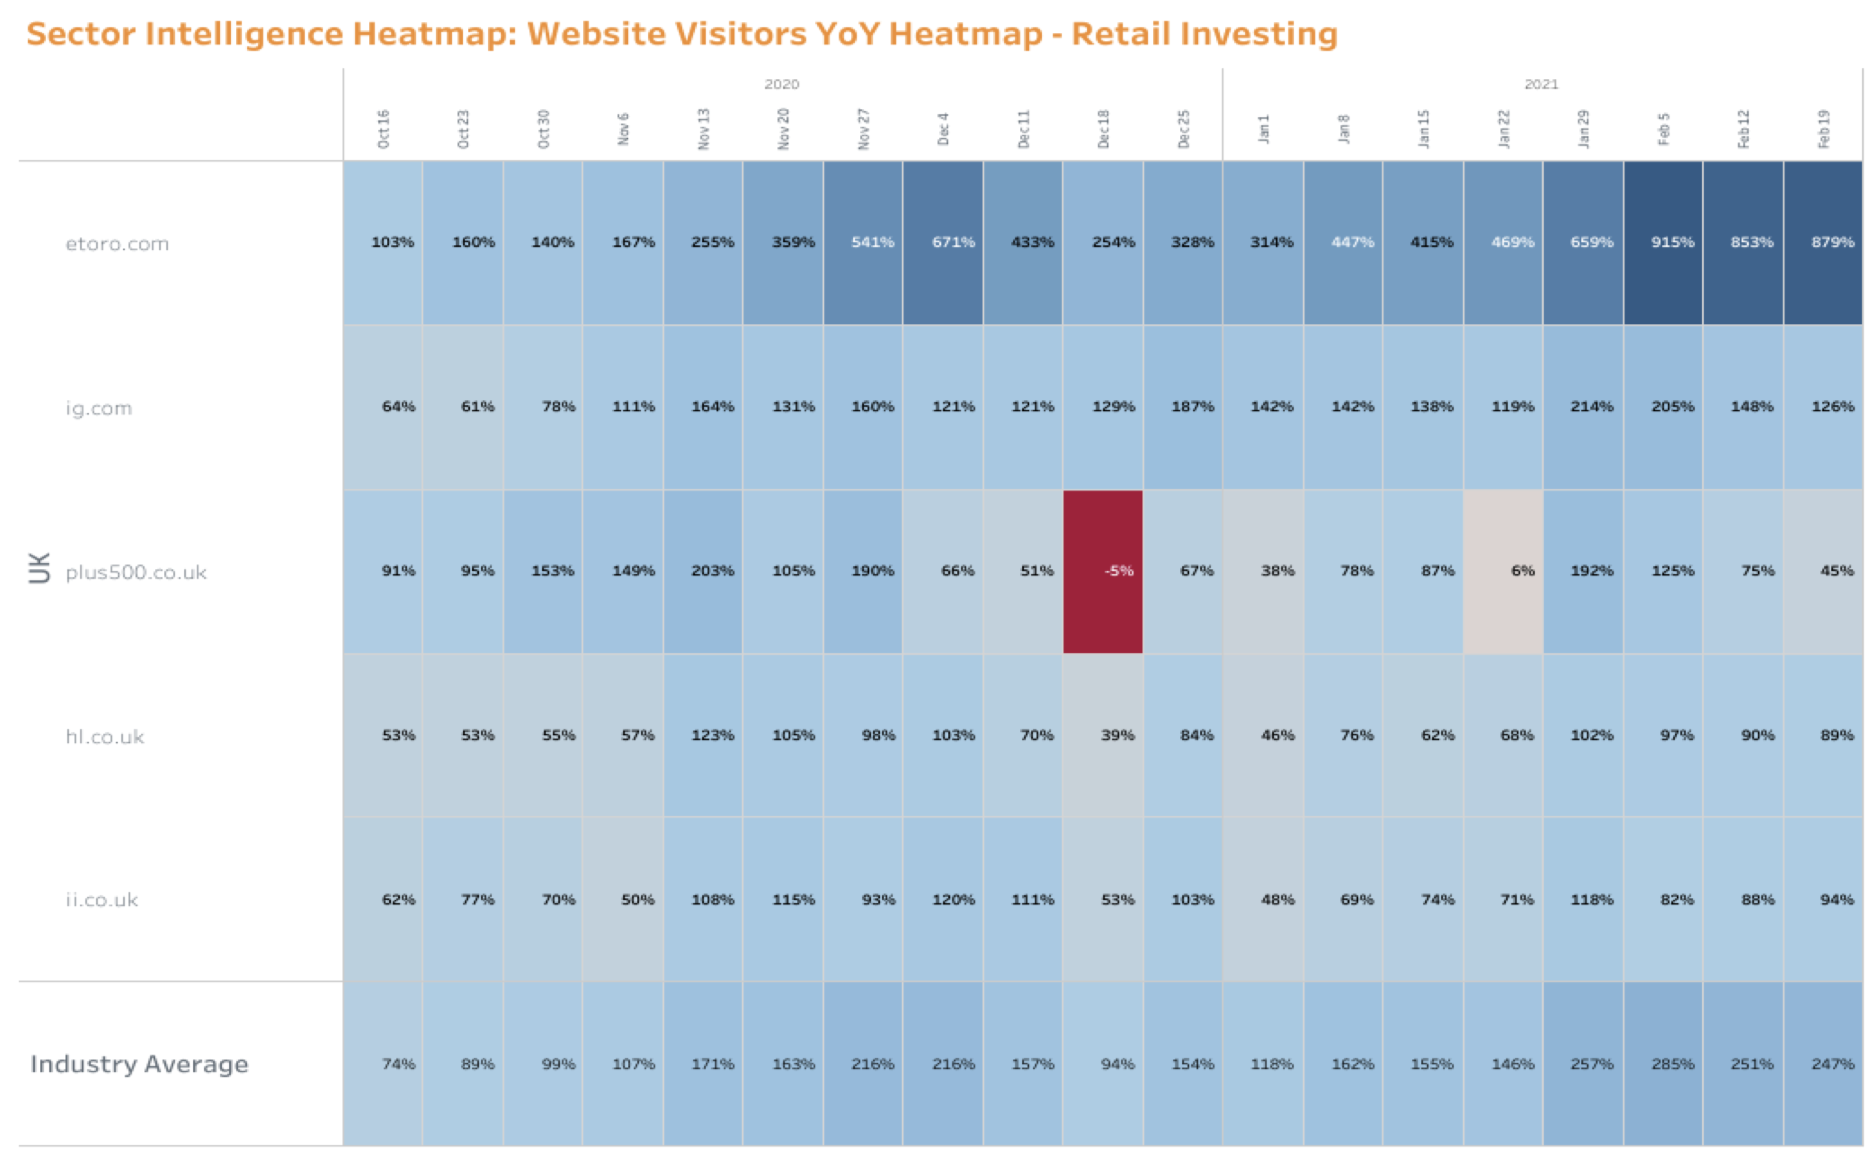
Retail investing
Weekly Website Visits YoY Heatmap
Looks like the Robinhood GameStop saga inspired U.K. retail investors to trade as well. The industry has been experiencing growth for some time now, but in the week ending Jan. 29 industry average traffic growth jumped 111 percentage points (ppt) to 257%.
While traditional retail investing sites in the U.K. such as hl.co.uk saw improved growth (>300% in the week ending January 29) from this investing frenzy, etoro.com appears to have won over the U.K. retail investors. Reaching an incredible 915% YoY growth in the week ending Feb. 4, etoro.com successfully continues to engage its users.
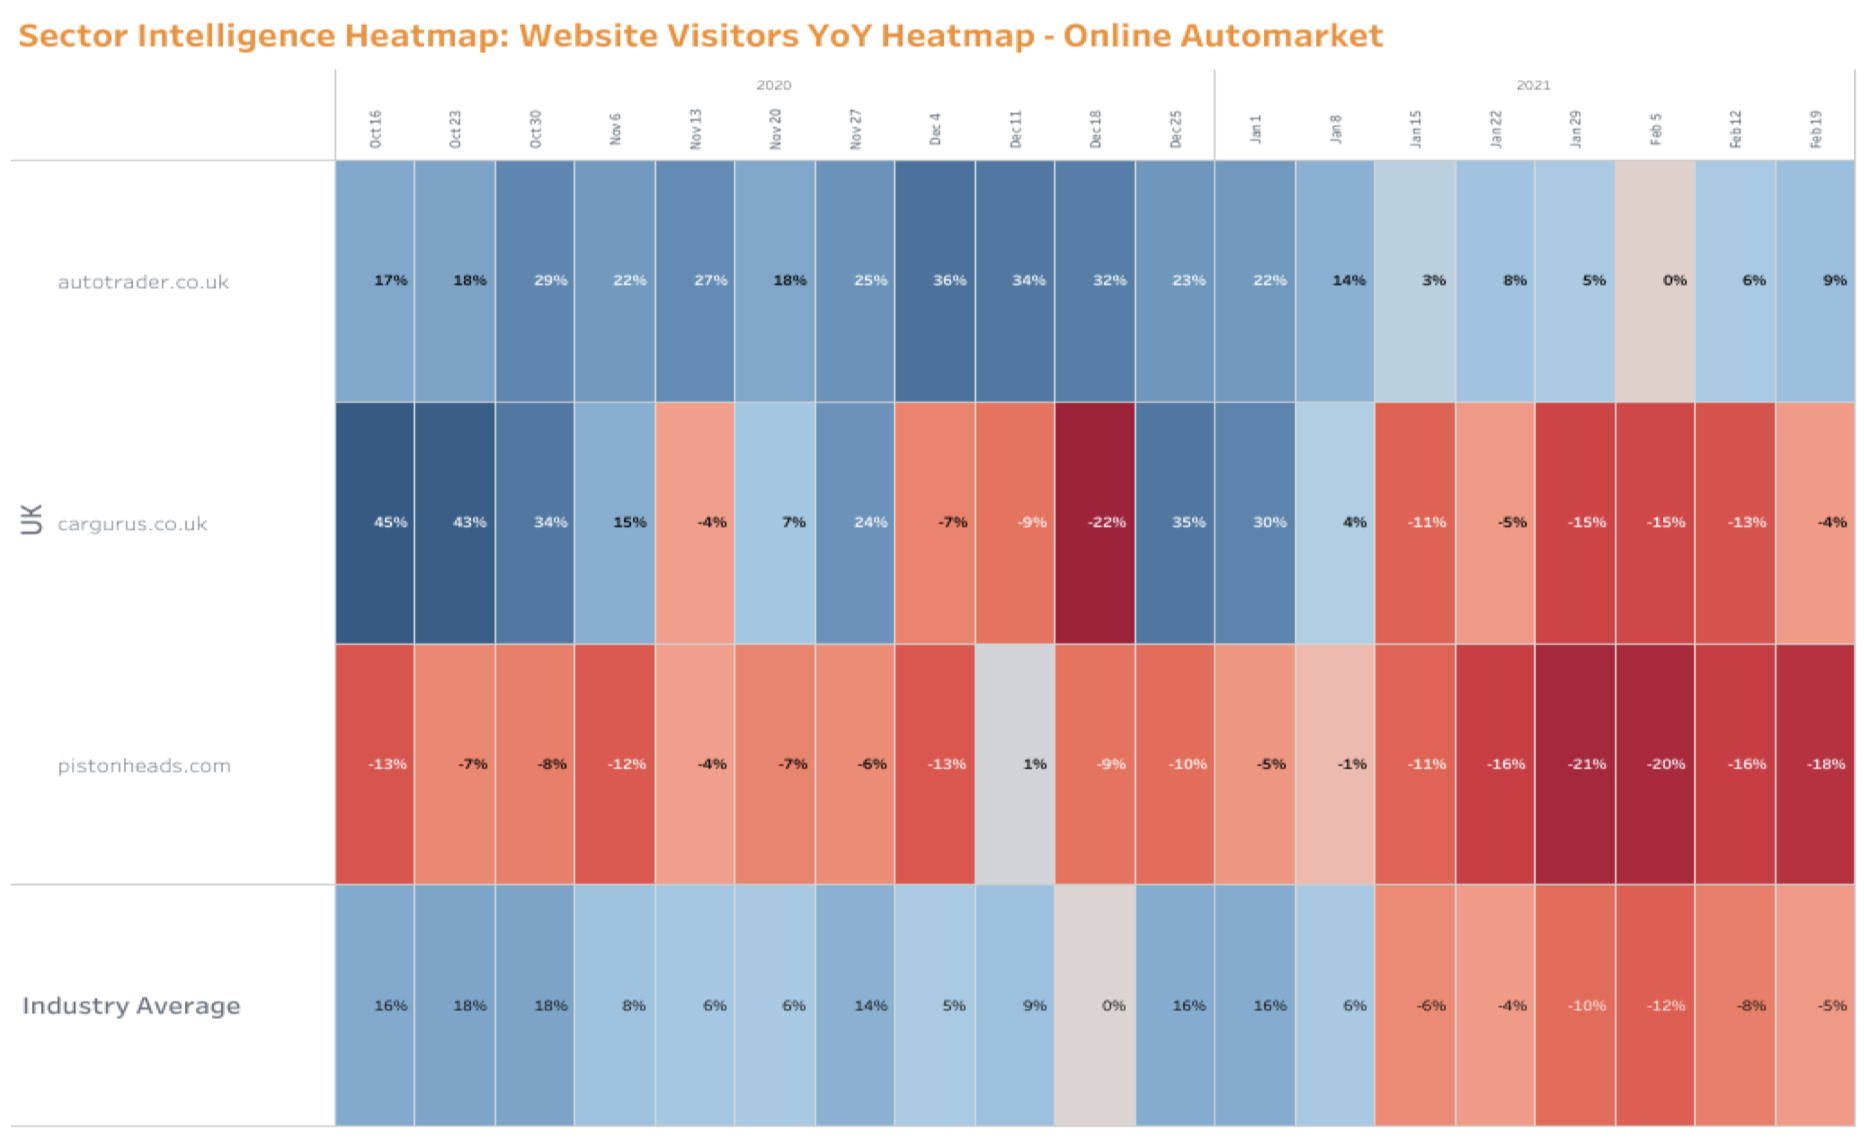
Online Automarket
Weekly Website Visits YoY Heatmap
Following weeks of positive growth, the U.K.’s online automarket industry inflected into negative YoY traffic growth, peaking at -12% in the week ending Feb. 4. Driving the decline is pistonheads.com with the strongest YoY decline, while autotrader.com has managed to maintain positive to flat YoY growth.
This report contains a select subset of our digital market monitor offerings.
Appendix - How To Read The Maps
Digital Heat comprises of three distinct maps:
Cross-Industry Heatmaps
These heatmaps display normalized indices based on statistical factor modeling. These indices summarize the relative performance of either a sector or an industry over time. Blue cells represent an above average growth rate and red cells represent a below average decline.
**Industry Analysis Heatmap
**These heatmaps represent the YoY growth rates of websites within an industry over time. Blue cells represent a high YoY growth rate, and red cells represent a YoY reduction.
To learn more about the data behind this article and what Similarweb has to offer, visit https://www.similarweb.com/.


Sign up to receive our stories in your inbox.
Data is changing the speed of business. Investors, Corporations, and Governments are buying new, differentiated data to gain visibility make better decisions. Don't fall behind. Let us help.


Sign up to receive our stories in your inbox.
Data is changing the speed of business. Investors, Corporations, and Governments are buying new, differentiated data to gain visibility make better decisions. Don't fall behind. Let us help.