
Source: https://www.similarweb.com/corp/blog/investor/digital-heat-is-online-retail-already-out-of-fashion/
Thanks to the coronavirus vaccine rollout, the market is shifting once again. So what does that mean for the industries most influenced by the pandemic lockdowns? This report delves into online trends in sectors and industries from SaaS to travel.
How are we doing this? Digital Heat, an easy-to-use heatmap to help you quickly identify at scale which industries and companies are most impacted by the current economic environment. The report tracks in near real-time year-over-year (YoY) weekly website traffic trends.
Key takeaways
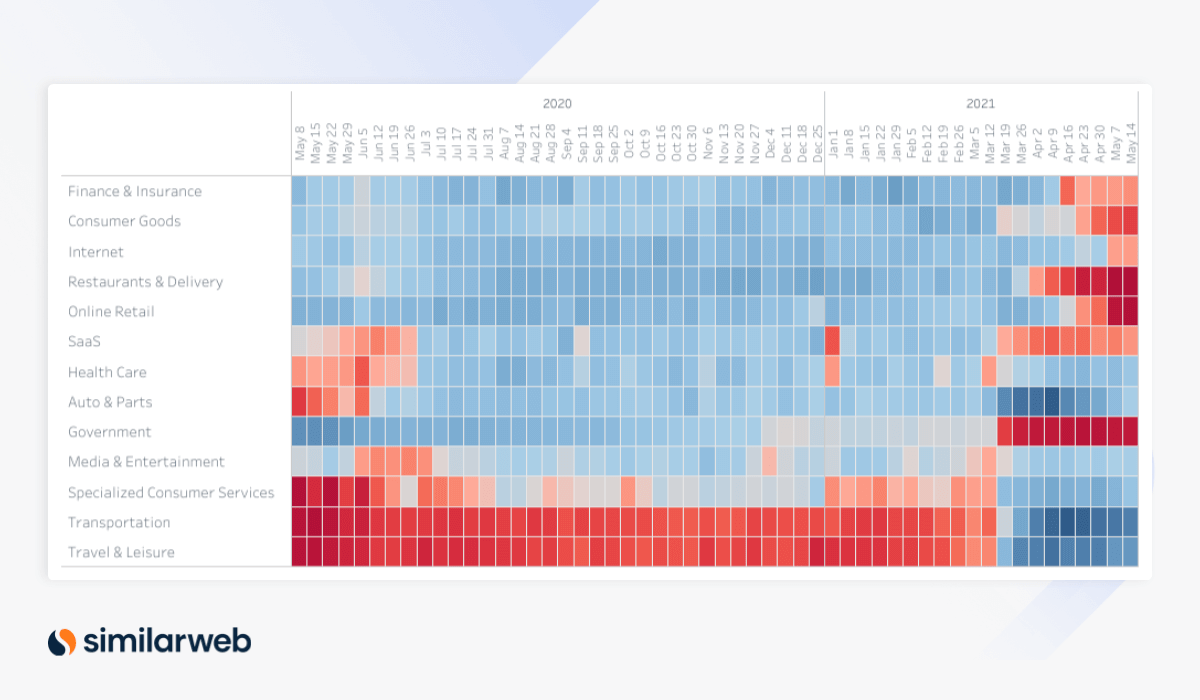
U.S. macro view: Key changes this month
Last month we saw the travel & leisure and transportation sectors start to pick up in terms of their YoY growth. And this momentum has continued into May. Meanwhile YoY growth in traffic to SaaS sites and online retail sites, spaces that benefited from the pandemic, dropped in recent weeks and is now below average.
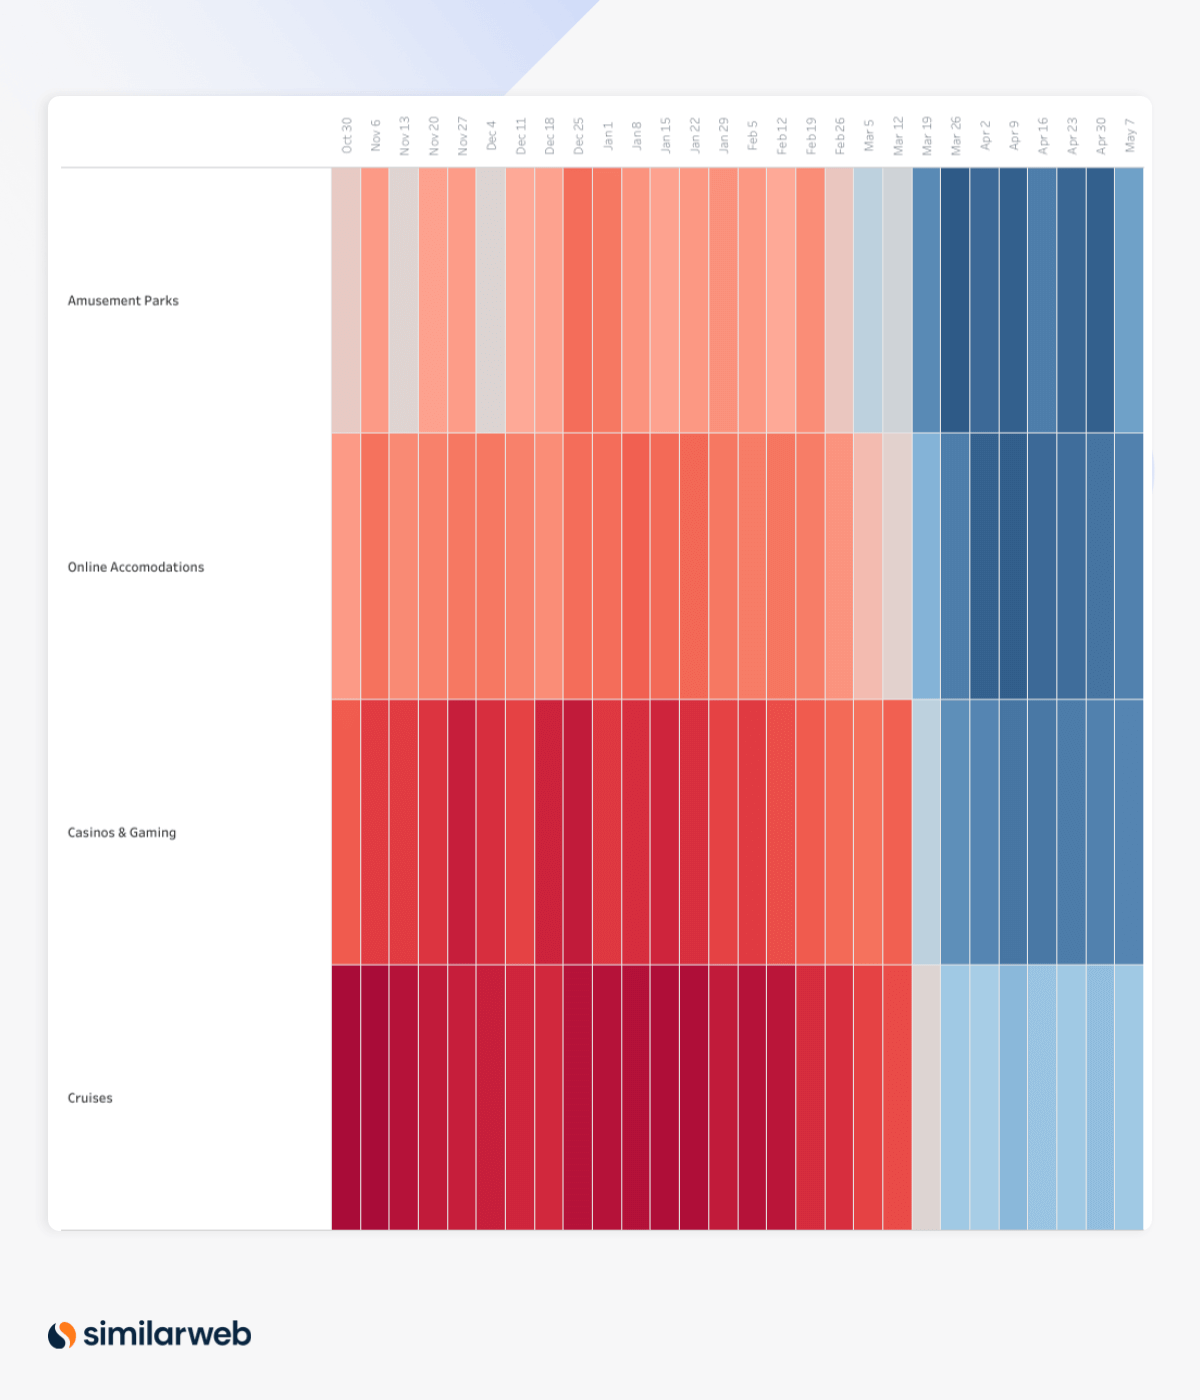
U.S. micro view: Travel surge continues
As the U.S. continues the vaccine rollout, Americans are turning to travel for a well-deserved break from the disruption of the past year and a half. Within the sector, online accommodation sites are seeing the strongest growth, while cruise sites are seeing the weakest growth – although still above average.
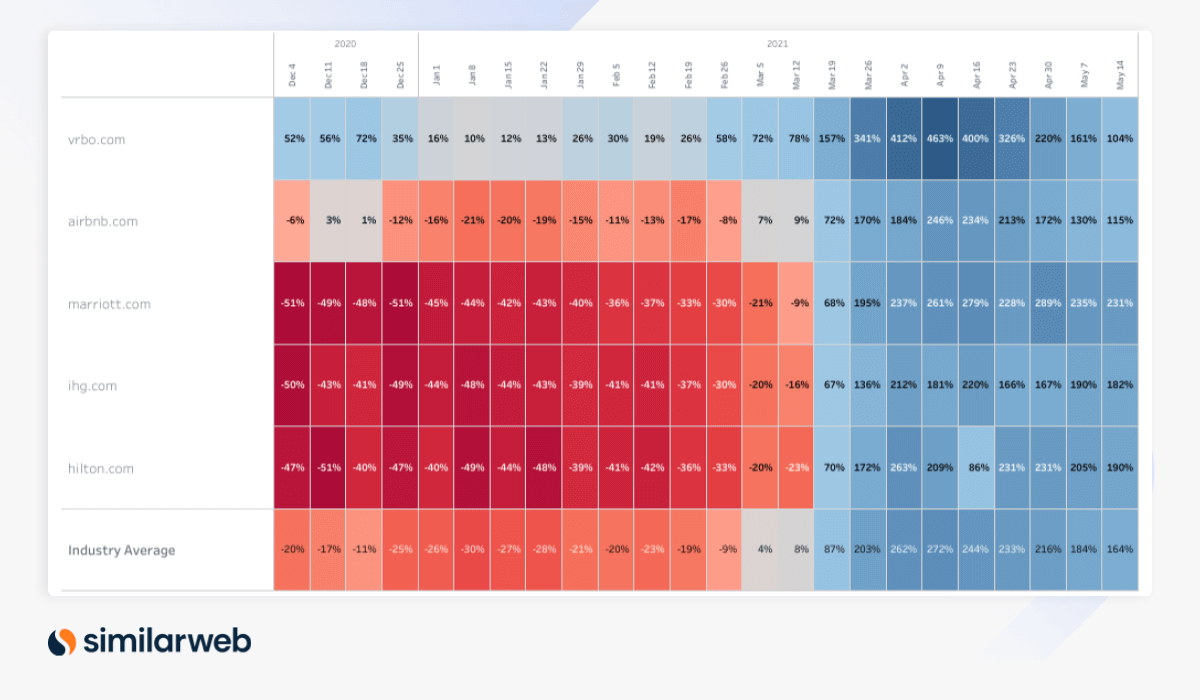
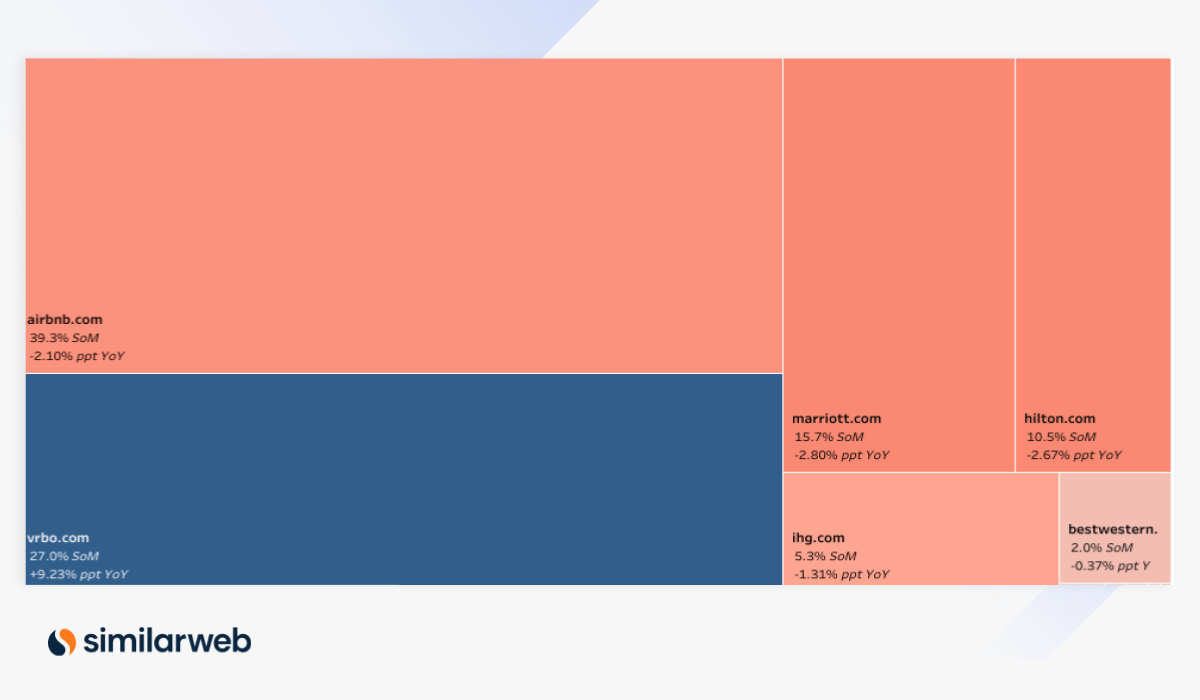
The industry average YoY traffic growth to online accommodation sites was 164% in the week ending May 14. Marriot.com is seeing the strongest traffic growth in the sector, more than 200% YoY, but a declining share of online market (SoM). Meanwhile, vrbo.com, which is seeing the weakest YoY traffic growth in the industry (albeit still greater than100%) has seen a 9.23 percentage point (ppt) increase in SoM YoY, taking its share up to 27%. The only site with a bigger SoM is airbnb.com, at 39.3%.
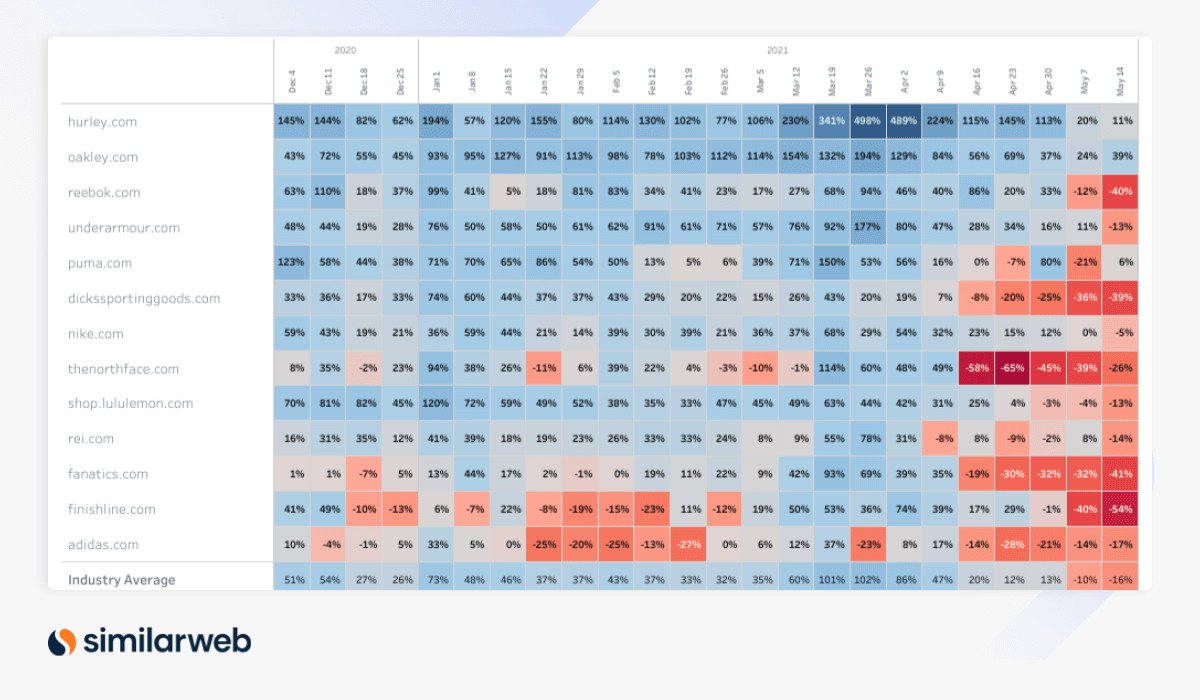
U.S. micro view: Sportswear trend fades
Traffic to sports & athleisure sites had been seeing strong traffic growth, reaching levels greater than 100% YoY as recently as March 2021. At the beginning of May there was an inflection, with the industry average YoY traffic growth going negative in the first week of May (-10%), with this trend continuing into the second week of the month (-16%).
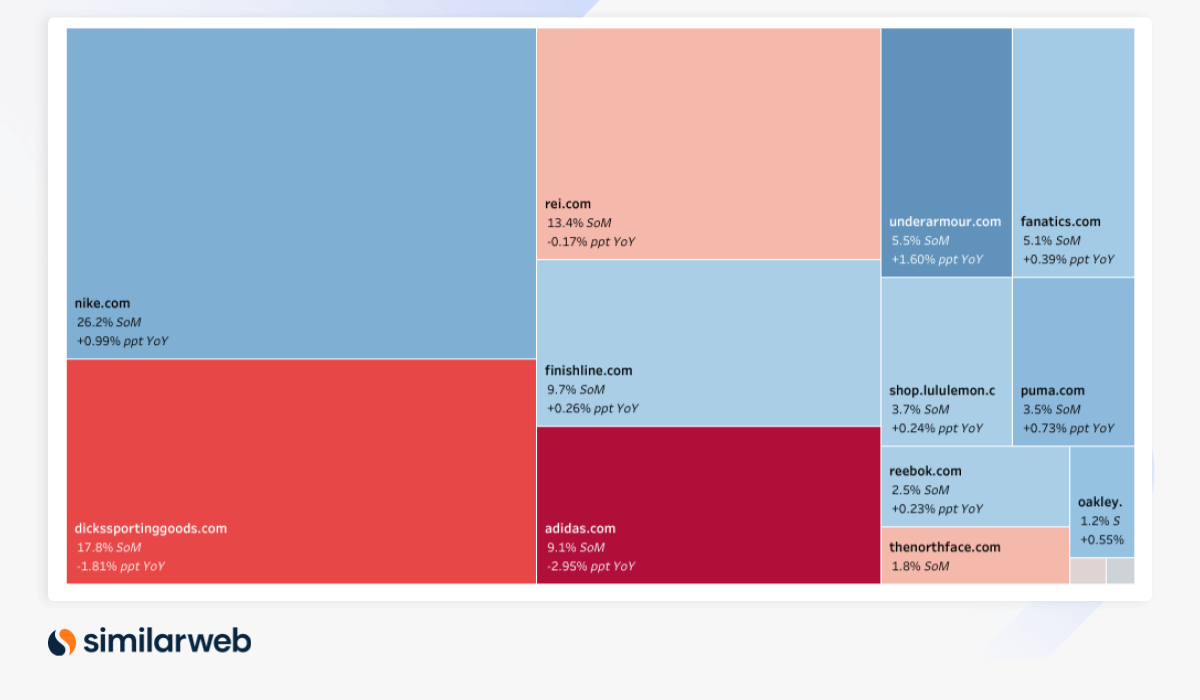
Dickssportinggoods.com is seeing both YoY traffic and its SoM decrease. At present, it accounts for 17.8% SoM, down 1.81 ppt YoY. And adidas.com is suffering from the same trend. While nike.com is seeing YoY traffic decline to a lesser extent than the other players, allowing it to grow its SoM. Nike.com’s SoM is currently 26.2%, up 0.99 ppt YoY.
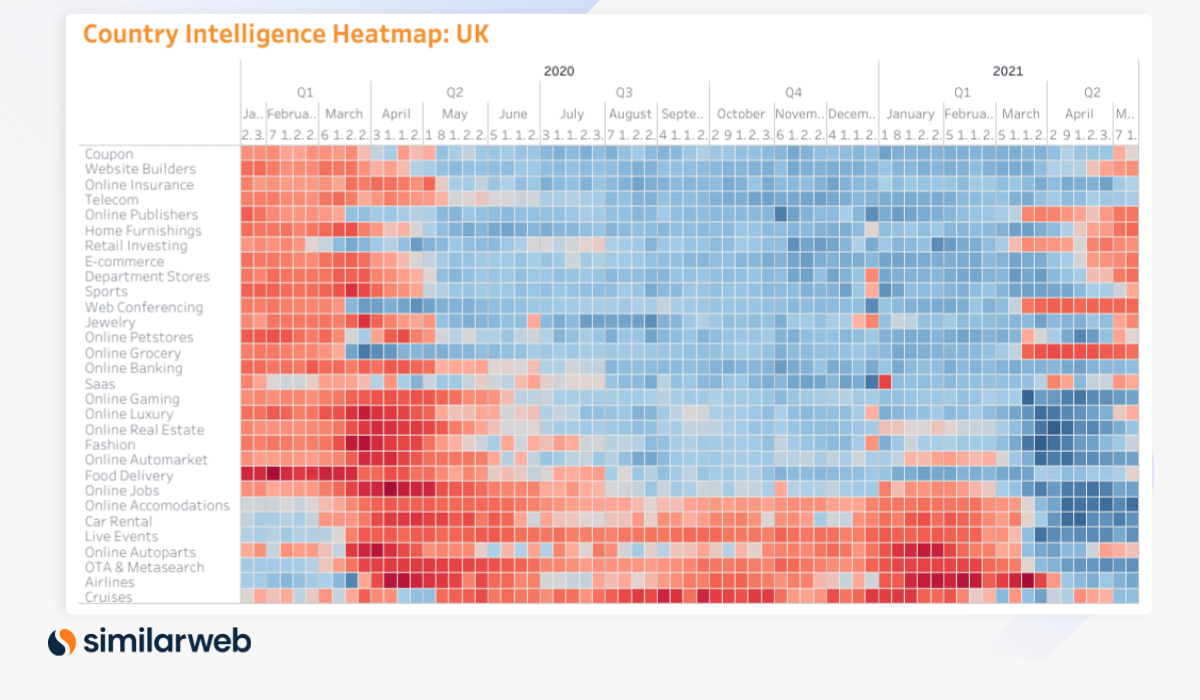
U.K. macro view: What’s changed?
Meanwhile In the U.K. YoY growth in traffic to home furnishing, eCommerce, and department store sites inflected into the negative in late April. And traffic to OTA & metasearch sites, and airlines sites, that inflected to positive in late March/early April, is continuing to see strong growth.
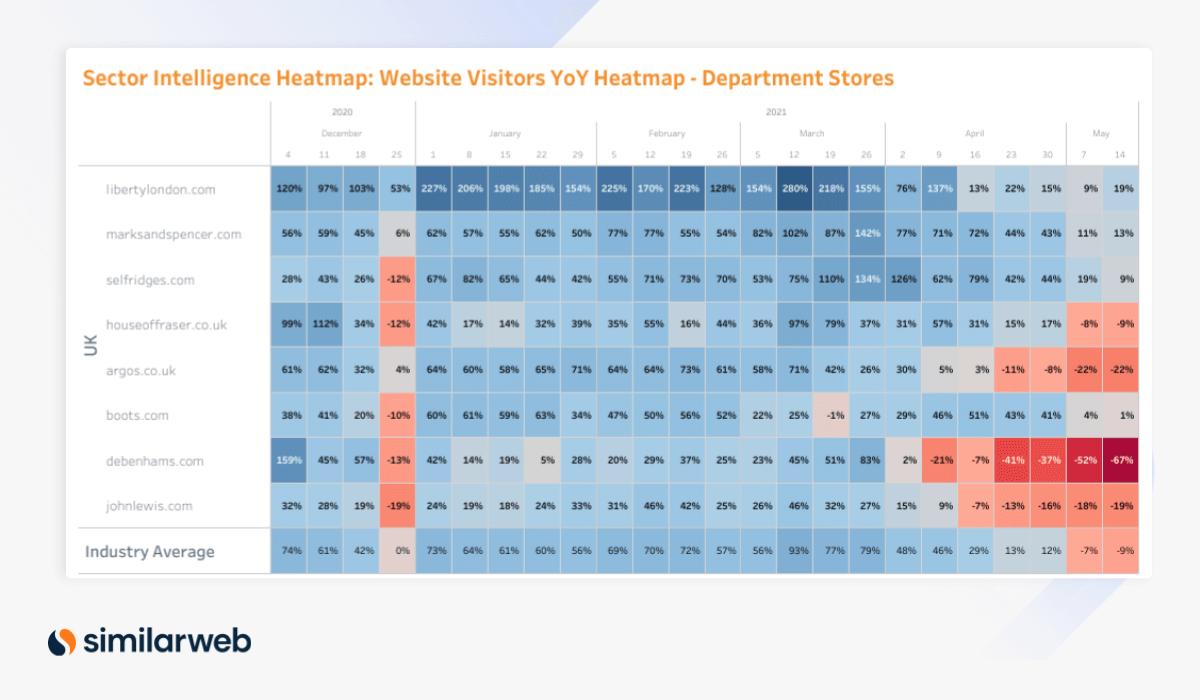
U.K. micro view: Traffic to department store sites declines
Following many months of YoY growth, traffic to department store sites saw an inflection at the beginning of May, and the positive growth trend turned negative. Debenhams.com is suffering the most with -67% YoY growth in the week ending May 14. Other players including houseoffraser.co.uk, argos.co.uk, and johnlewis.com are also seeing negative YoY growth, although to a lesser extent.
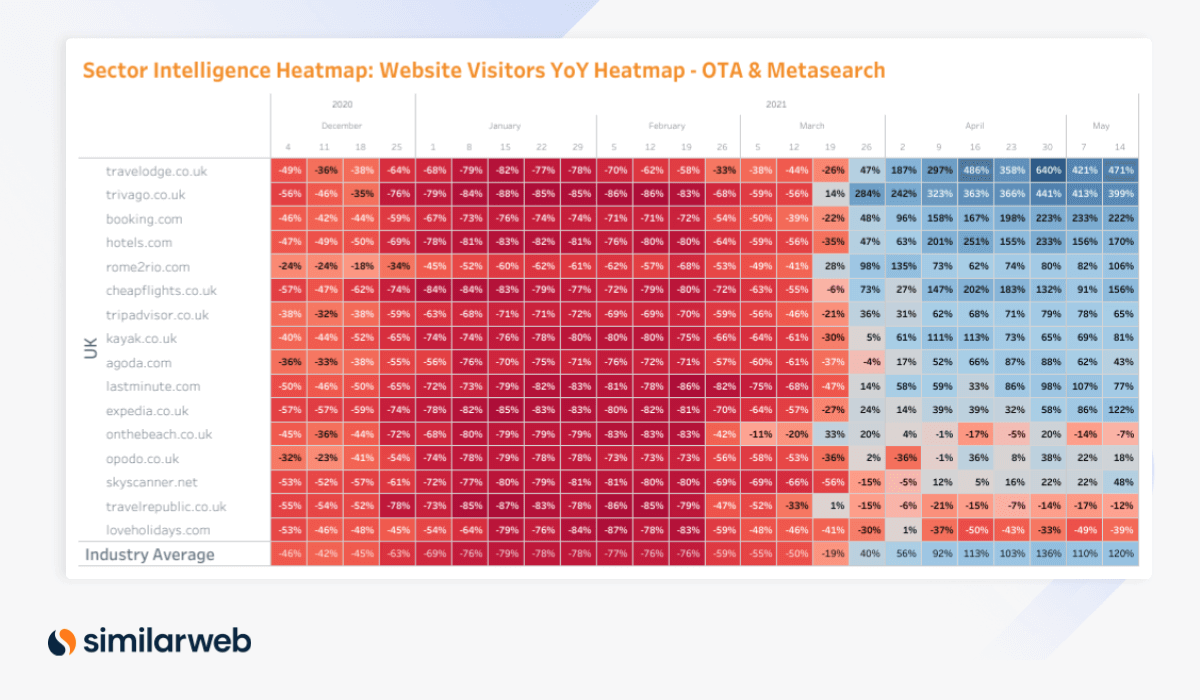
U.K. micro view: OTA & metasearch soars
At the end of March, traffic growth YoY to OTA & metasearch sites turned positive after months of strong negative growth. From -19% YoY traffic growth in the week ending March 19, the industry average saw 120% YoY growth in the week ending May 14.
Booking.com and expedia.co.uk have been seeing triple-figure YoY traffic growth numbers in recent weeks.
Appendix – How to read the maps
Cross-Industry Heatmaps
These heatmaps display normalized indices based on statistical factor modeling. These indices summarize the relative performance of either a sector or an industry over time. Blue cells represent an above-average growth rate and red cells represent a below-average decline.
Industry Analysis Heatmap
These heatmaps represent the YoY growth rates of websites within an industry over time. Blue cells represent a high YoY growth rate, and red cells represent a YoY reduction.
To learn more about the data behind this article and what Similarweb has to offer, visit https://www.similarweb.com/.


Sign up to receive our stories in your inbox.
Data is changing the speed of business. Investors, Corporations, and Governments are buying new, differentiated data to gain visibility make better decisions. Don't fall behind. Let us help.


Sign up to receive our stories in your inbox.
Data is changing the speed of business. Investors, Corporations, and Governments are buying new, differentiated data to gain visibility make better decisions. Don't fall behind. Let us help.