Year-over-Year Trends
The industry achieved stronger 2-year sales for the second consecutive month in April. Same-store sales growth was 6.8% on a 2-year basis in April, an improvement of 4.6 percentage points from the 2.3% 2-year growth reported for March. This is optimistic news for the industry as April became the best month for restaurants based on sales growth in over three years.
Although sales have recovered to pre-pandemic levels, 2-year same-store traffic growth was -4.2% in April. Despite the 4.9 percentage point improvement from the previous month’s result, restaurant traffic growth is far from positive territory. Most of restaurant sales growth can be attributed to unusually large growth in average guest checks.
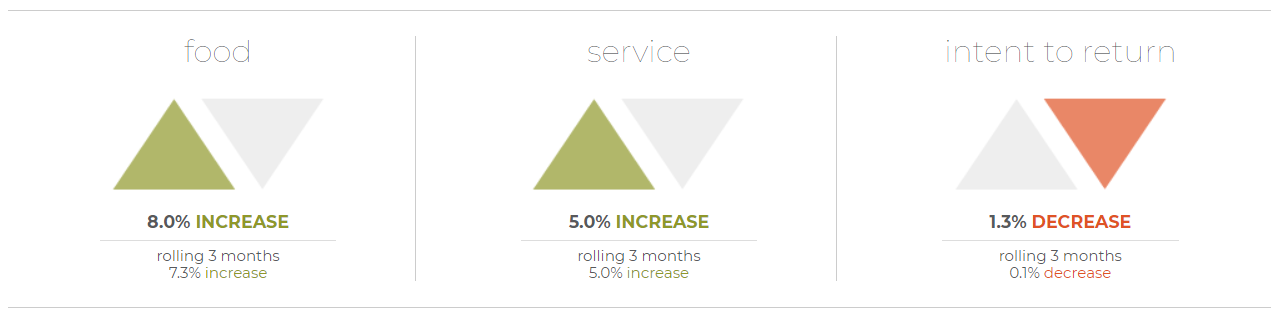
The data suggests the sales improvements are supported by restaurants meeting or exceeding the expectations of most restaurant guests. The percentage of positive restaurant online reviews and comments primarily centered around “food” improved by 8 percentage points compared to April of 2019. Furthermore, since August of 2020, over 50% of all food-centered reviews were classified as positive each month after a significant dip at the beginning of the pandemic.
Similarly, the percentage of positive reviews and comments centered around restaurant “service” improved by 5 percentage points over the last two years. Guests have been a bit more forgiving on “service” than “food”. It was only March through April 2020 when less than 50% of service-centered reviews and comments were classified as positive. Every month since June, over 50% of “service” reviews were classified as positive.
The strong sentiment on “food” and “service” notwithstanding, guests are not as enthusiastic about their “intent to return” as they were two years ago. Reviews based on guest “intent to return” became less positive by 1.3 percentage points compared to April 2019.
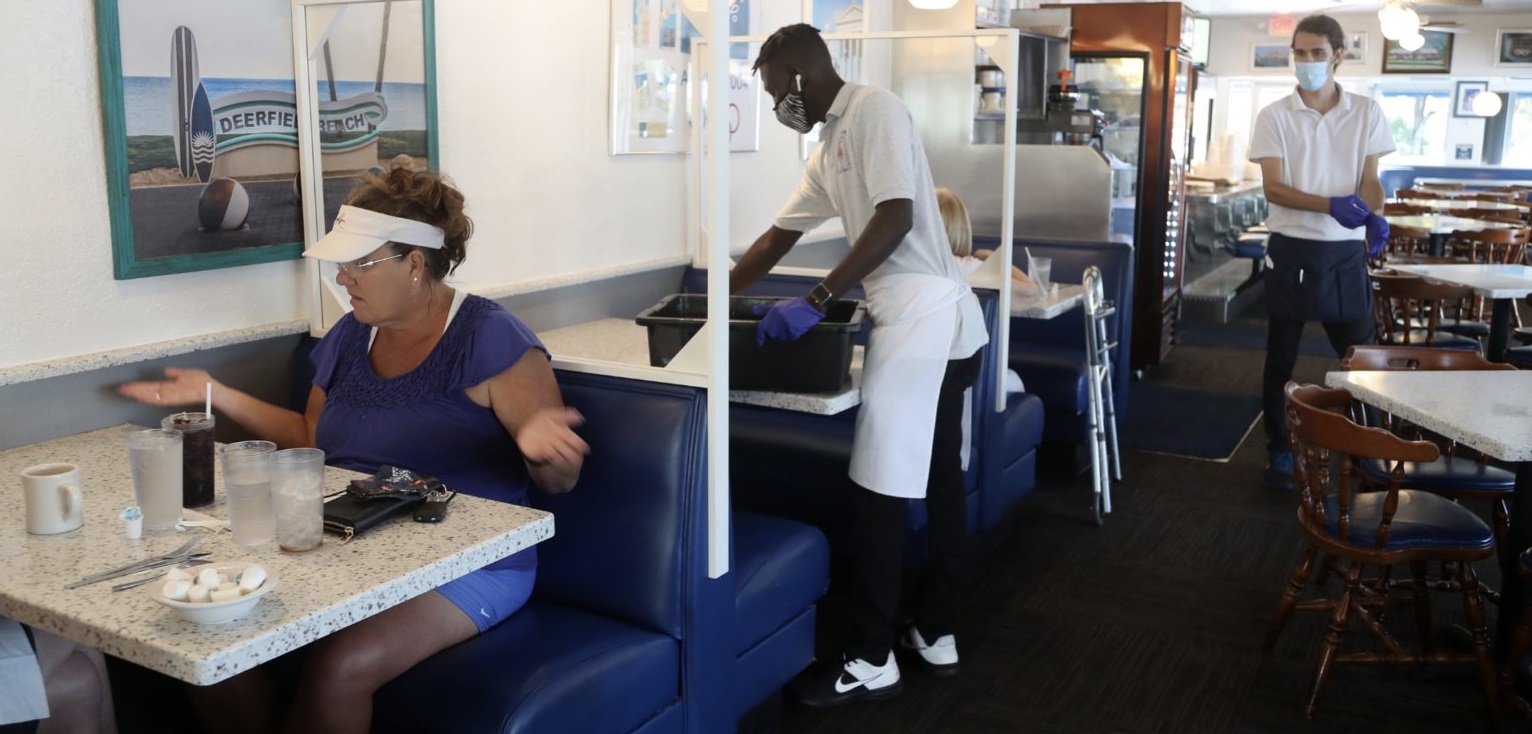
As sales and traffic improved during the first quarter, especially in comparison to the downturn the industry experienced during the fourth quarter of 2020, restaurants faced increased challenges to execution, especially considering the staffing shortage confronting the industry. More people are venturing out to restaurants, and that means juggling the incremental dine-in traffic with the off-premise orders that continue to capture a large share of all sales.
In the case of full-service restaurants, which rely much more on the dine-in experience than their limited-service counterparts, the traffic improvements during the first three months of the year came with an erosion of “ambiance” net sentiment in comparison to the previous quarter.
A key factor in this decline in “ambiance” sentiment in full-service restaurants seems to be based on guests’ perception of how clean restaurants are. “Cleanliness”, a subcomponent of ambiance, suffered a drop in its net sentiment* of almost 10 percentage points compared to Q4 2020. “Cleanliness” comments often focused on surfaces such as tables and floors, high contact items like plates, cups and silverware, as well as the restroom. In many cases, guests made a point of reminding the restaurant that their expectations of “clean” are heightened because of the pandemic and expressed their fears that what they perceived as unclean could be a sign of bigger cleanliness issues throughout the restaurant beyond what they could see.
In the case of limited-service restaurants, which have been performing much better from a sales and traffic perspective throughout the pandemic but continue to see dine-in sales down by a larger margin, Q1 of 2021 did not represent as big of a ramp up in terms of execution. As a result, limited-service suffered less of a negative impact in their net sentiment during the quarter.
Limited-service restaurants continued facing incredibly low net sentiment based on “service”. “Service” had the largest percentage of negative mentions in limited-service during the quarter (the other attributes measured are “food”, “beverage”, “ambiance” and “value”).
Common negative mentions related to “service” in limited-service included callouts of specific staff members who were rude or had a bad attitude. Another sore spot was speed of service, with guests commonly complaining of unusually long wait times. In many other cases guests were not as nuanced in their descriptions: they simply complained of plain and simple “bad service”. With most restaurants operating with less staff than their pre-COVID norms, it is not surprising to hear that employees simply are not able to deliver prompt, friendly service every time.
*Net sentiment is a value representing the percentage of positive mentions minus the percentage of negative mentions for a specific attribute of the restaurant experience.
Top DMAS
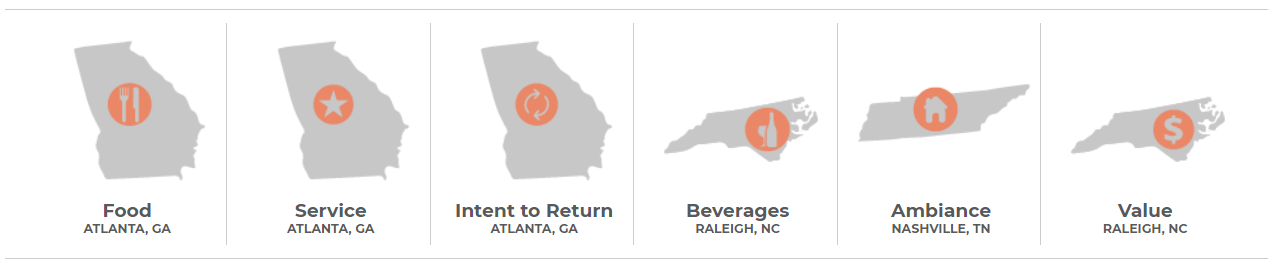
Bottom DMAS
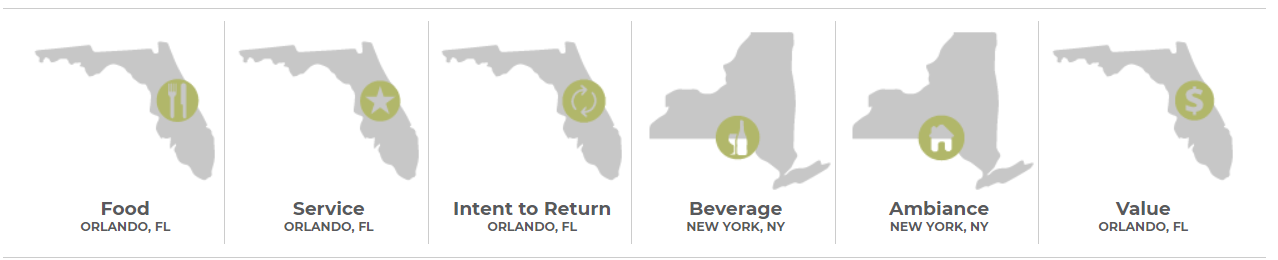
As is common, Orlando retained its position at the top of guest sentiment among the largest markets in the country based on many of the attributes of the restaurant experience. During April, Orlando’s restaurant guests expressed the most positive sentiment based on restaurant “food”, “service”, “value” and “intent to return”. This market is also one of the top performing based on same-store traffic growth over the last three months.
Among the strongest in “food” sentiment during April were also Tampa, Sacramento, Denver and New York. In fact, New York’s restaurant sentiment has emerged as extremely positive after the pandemic, after not being strong in the period before COVID. During April the New York DMA had the most positive sentiment based on restaurant “beverage” and “ambiance”. It was also among the top 4 markets in the country based on restaurant “value” and “intent to return” during the month. This recent positivity bodes well for restaurants in New York, which were hit hard by the pandemic.
COVID also continues to have an impact on restaurants in “ambiance”, especially as it relates to “cleanliness”. The 5 DMAs in the country which have had the biggest losses in restaurant traffic compared to the same period in 2019 are San Francisco, Sacramento, Los Angeles, New York and Boston. These are large metropolitan areas that were among the most negatively impacted by the virus. But restaurant operators there have largely taken the right measures to keep employees and guests safe, and people visiting their establishments have noticed and voiced their approval. These five DMAs are also among the top 8 markets with the most positive “ambiance” guest sentiment during April. As we have been pointing out throughout the last year, “clean” remains the new “ambiance”.****
To learn more about the data behind this article and what Black Box Intelligence has to offer, visit blackboxintelligence.com.


Sign up to receive our stories in your inbox.
Data is changing the speed of business. Investors, Corporations, and Governments are buying new, differentiated data to gain visibility make better decisions. Don't fall behind. Let us help.


Sign up to receive our stories in your inbox.
Data is changing the speed of business. Investors, Corporations, and Governments are buying new, differentiated data to gain visibility make better decisions. Don't fall behind. Let us help.