
Talk to any Gen Zer and ask them the last commercial they saw. Chances are they don’t even watch cable.
We’re living in the golden of video content with endless options of digital entertainment available at our fingertips. We can binge-watch, pause whenever we want, watch from anywhere, and even rent the latest blockbuster films before they hit theatres.
Of course, the huge boom of digital streaming options was accelerated by the COVID-19 pandemic. With museums, venues, and other forms of entertainment closed, the number of people streaming entertainment at home skyrocketed. W
Millions of new users flocked to sign up for popular streaming sites like Netflix, Disney+, Hulu, HBO Go, and countless other household names. But with the world reopening, which streaming titans will be able to retain their new users?
In such a competitive industry, benchmarking is key to smart decision-making, user retention, and success. In this article we use market intelligence to analyze key benchmarks from the streaming industry. See who’s winning the video streaming wars, and where opportunities may lie to win viewership from your competitors.
Streaming wars: the current leaderboard
With so many streaming platforms available today, the first step of your benchmarking strategy should be to identify your main competitors. These could be the industry leaders or those companies more similar to you in terms of size, audience demographics, or geography. In this article, we focused on the top 5 industry leaders in terms of traffic share and monthly visits.
And the winner is…youtube.com. The video streaming giant owned 64% of the total traffic share worldwide in May 2021. For reference, netflix.com, it’s closest competitor, owned 4.4%, followed by imdb.com (1.0%), disneyplus.com (0.5%), and hulu.com (0.5%).
Imdb.com not only points viewers in the right direction to the best sites to watch their favorite shows but they also offer their own streaming services. With this tactic, the website earned 535.5 million monthly views in May 2021.
When we look at the top three websites for streaming TV and movies – the impact of COVID-19 becomes even more apparent.
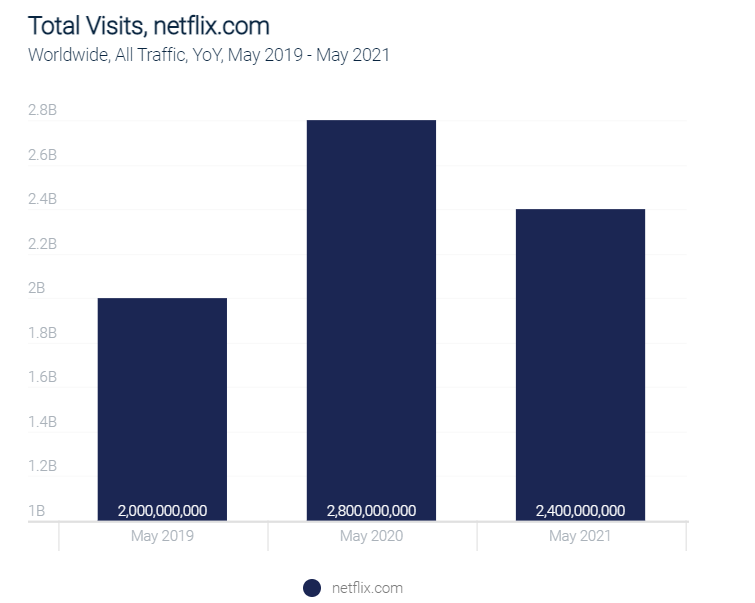
Netflix.com grew 40% percent in 2020, earning 2.8 billion monthly views in May of that year. However, there’s been a slight drop in viewership in May 2021, suggesting that those who signed up for Netflix during the pandemic are either canceling their subscriptions or just aren’t streaming as much.
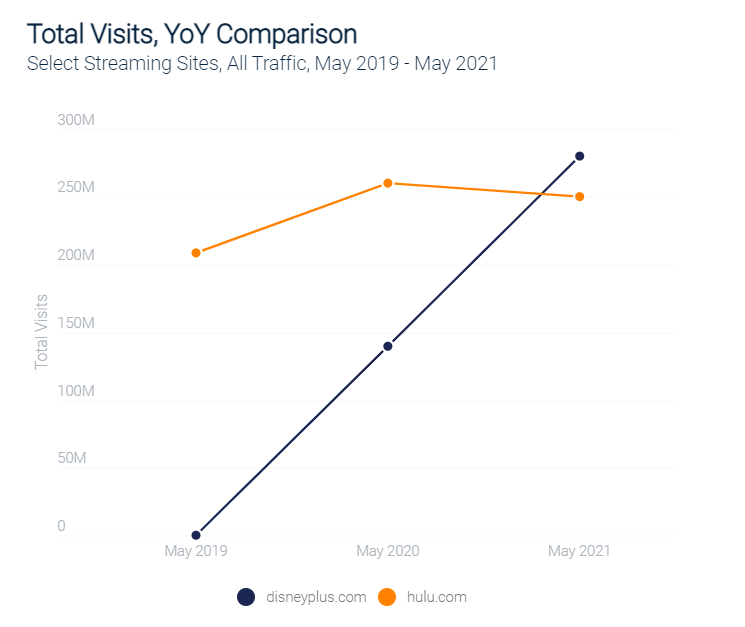
Disneyplus.com experienced the most dramatic growth in terms of total site visits year-over-year (YoY) – surging a whopping 37,000% in 2020. The website was officially launched in November 2019. Site visits climbed another 96% in 2021 YTD. It’s important to note that as of now, Disney is the only streaming company that has maintained this upward track in 2021. Both hulu.com and netflix.com have experienced slight dips in May 2021 compared to the year before.
In addition to these streaming services, other top providers in the U.S. include hbomax.com, peakcocktv.com, and vimeo.com.
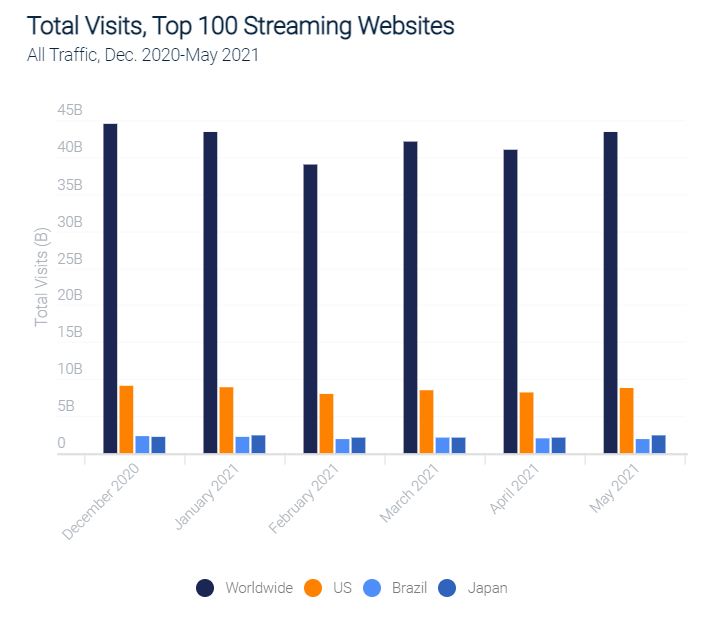
The big picture – Total visits in context
Now that you have a better idea of how the industry leaders are performing, let’s take a look at the average industry benchmarks for streaming sites to give you a broader picture of performance metrics to beat.
Total visits is one of the first website metrics you should evaluate as it will give you a clear view of where you stand in the market.
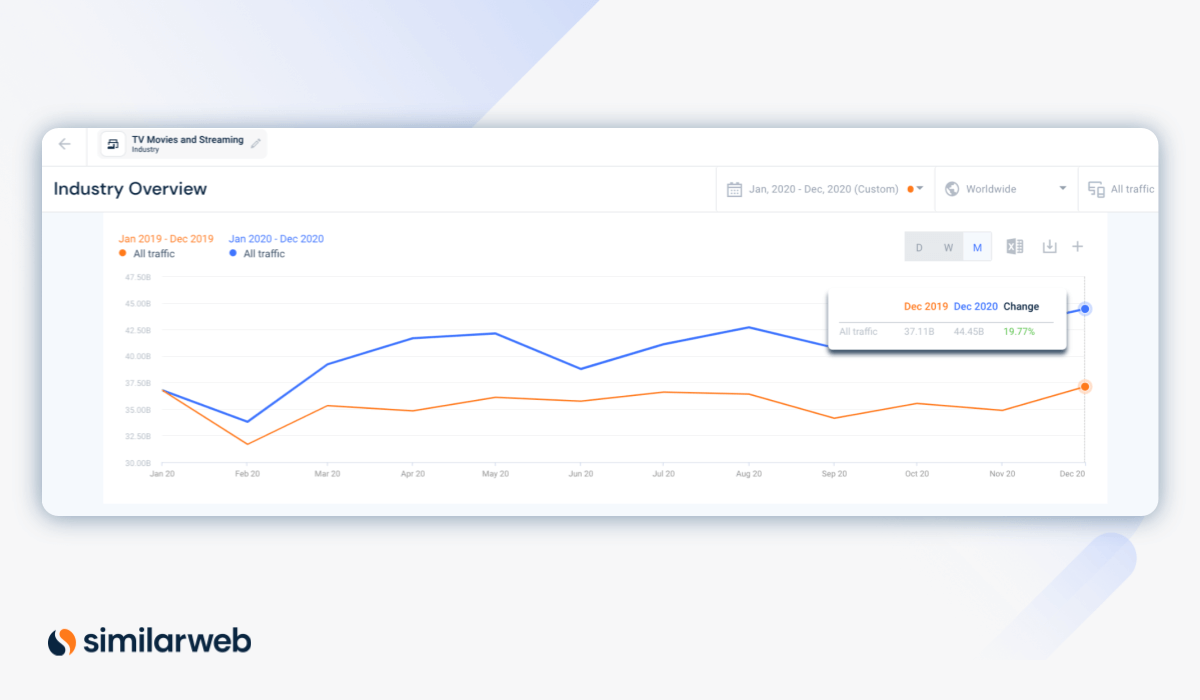
When comparing 2021 to 2020, the top 100 websites in the tv, movie, and streaming category had 43.4% billion total in May 2021, 3% more than the year before (42.1 billion). When looking at a year-over-year timeframe YoY, we can see the growth in traffic to the entire industry experienced amid the pandemic. Worldwide there were 14.5% more monthly views to streaming sites in 2020 than in 2019 (487 billion vs. 425.2 billion).
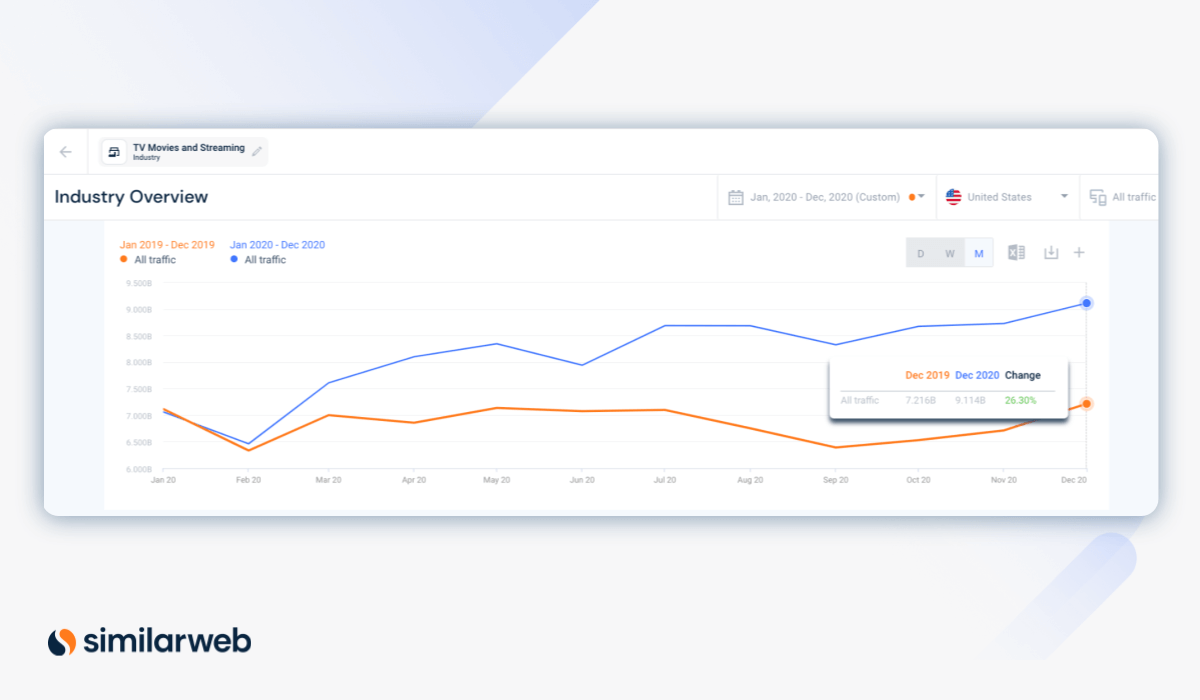
In the United States, streaming websites saw an 18% increase in total visits YoY from 2019 to 2020, rising to 97.8 billion.
In the last six months, we can see total traffic start to level out – this means that while streaming websites are still very popular – there has not been as much growth as we’ve seen in the last year with total visits hovering each month around 40 billion globally, 8.5 billion in the U.S., 2.0 billion in Brazil, and 2.2 billion in Japan.
Sticky streaming – understanding audience loyalty
For online streaming, the sticker your website is, the more your viewers are enjoying your content. If you have a sticky website, your users are happy with the services you offer and your audience is loyal to you.
Website stickiness is calculated by dividing the average number of unique visitors by the average total monthly visits. Remember that a unique visitor is one visiting your site or page within the specified period is counted only once.
Top 100 websites in the category, May 2021, Worldwide:
Top 25 websites in the category, May 2021, Worldwide::
If you have a stickiness level higher than 9%, you can assume that you are providing a better user experience than most of the top competitors in the streaming industry.
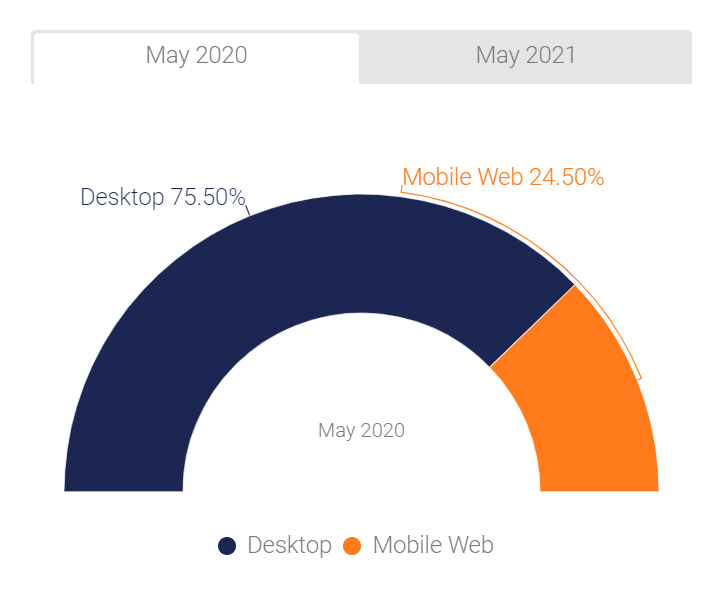
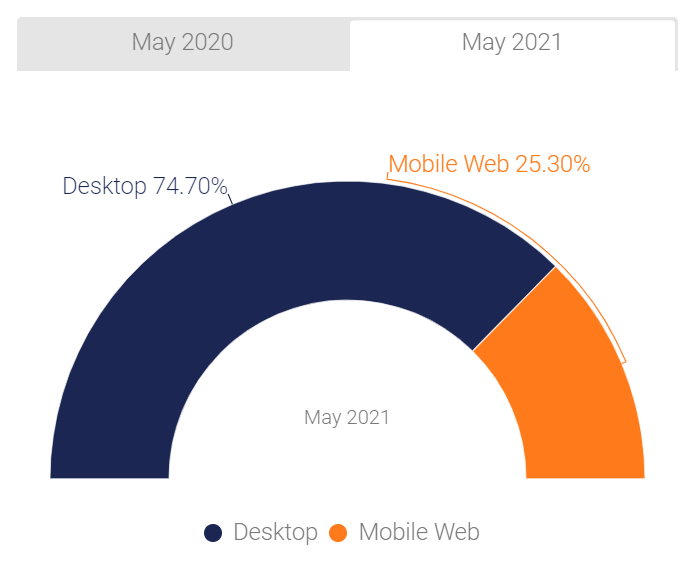
What’s the device split?
Data on device split can help gauge audience streaming preferences. Are your viewers more likely to watch your content at home from a desktop computer, or on-the-go via their mobile devices?
Understanding how your audience consumes your content is key for optimizing your streaming service for peak performance. For online streaming, it makes sense that desktop is the winner as most consumers access these websites when they are relaxing or looking for entertainment while at home, rather than on the move.
Top 100 websites in the category
Top 25 websites in the category:
Top 100 Streaming Sites
Device split: Desktop vs. Mobile
All traffic, Worldwide, May 2020 vs. May 2021
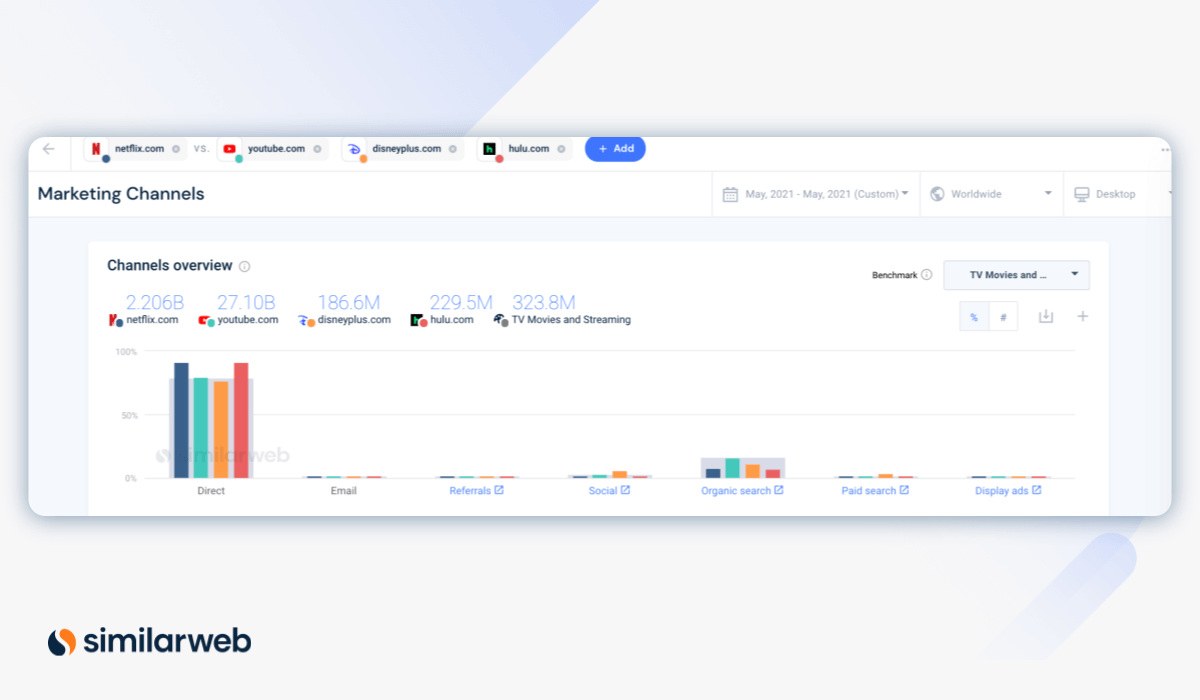
Marketing channels deep dive
There are a variety of ways that users can end up on your streaming site. Whether it’s traditional word-of-mouth, affiliate marketing, paid advertising, or social media sharing, it’s important to understand which marketing channels are bringing the most amount of traffic to your website.
With benchmarking, you can take marketing channel analysis one step further. Pinning your channels’ performance against your competitors will help you plan and implement changes to steal traffic share from your competitors. For example, if you notice that you fall below the industry average for social media, perhaps you’ll want to boost your PPC strategy.
January to May 2021, direct has been the main source of traffic to streaming websites with 78% of the traffic share. Organic search comes in second place at 16.5% and social in third at 2.8%.
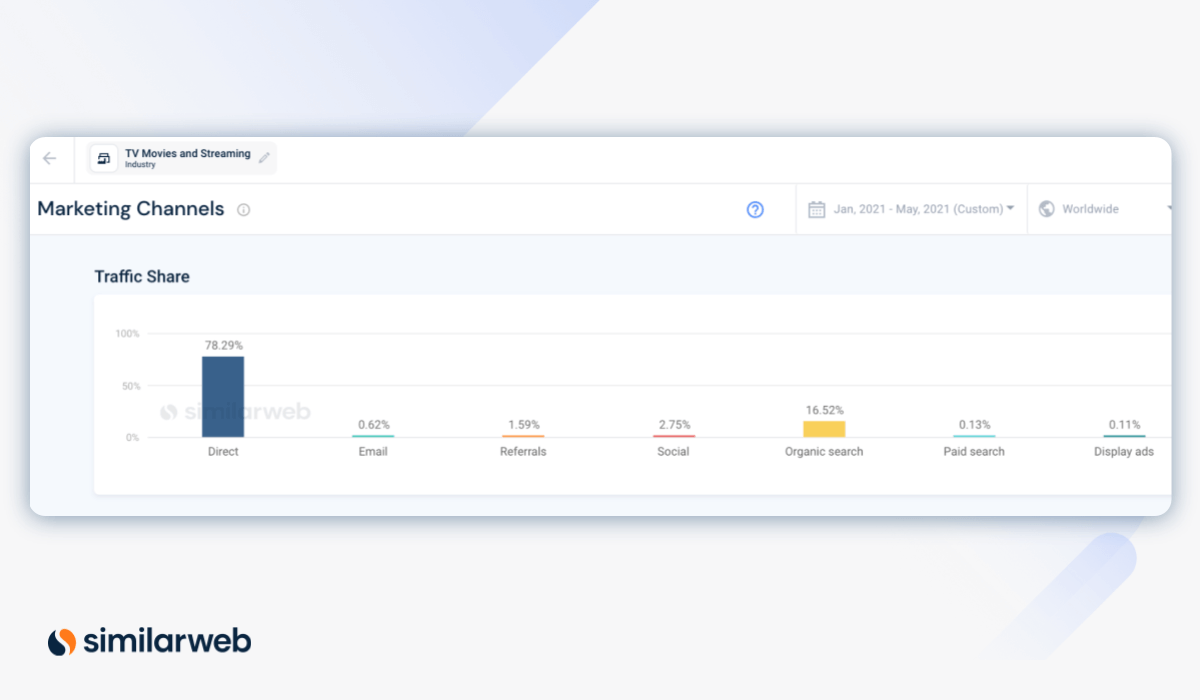
It’s interesting to note that in May 2021 almost all of the top streaming websites scored higher than the industry average for direct traffic. In fact, hulu.com, which had considerably less traffic than youtube.com and netflix.com in May 2021, wins overall for direct traffic – earning 91.4% of its traffic from this channel.
Disneyplus.com, which had the least amount of traffic from this competitive set, performed the best in social (5.9%) and paid search (3.3%),well above its competitors and the industry averages of 2.7% and 0.3% respectively.
Keep users coming back
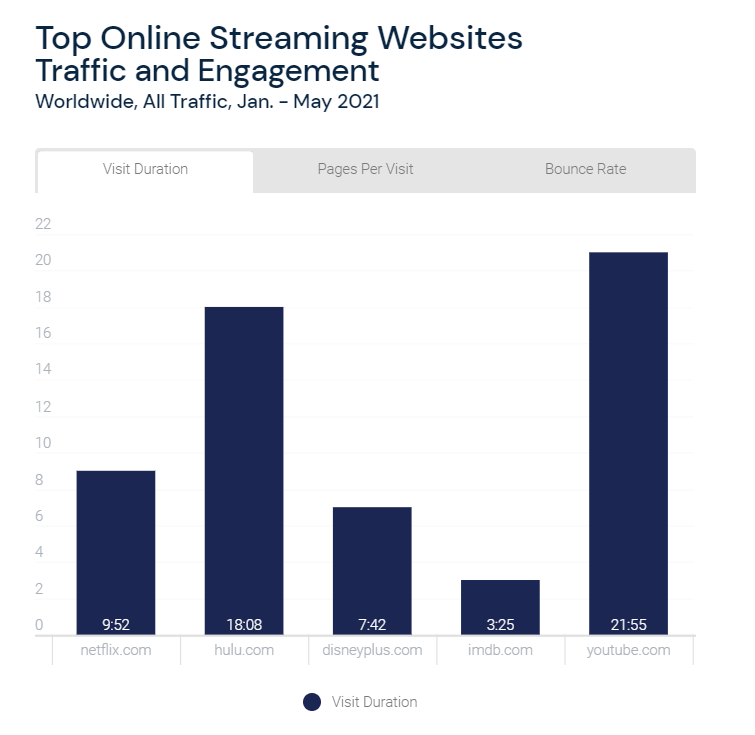
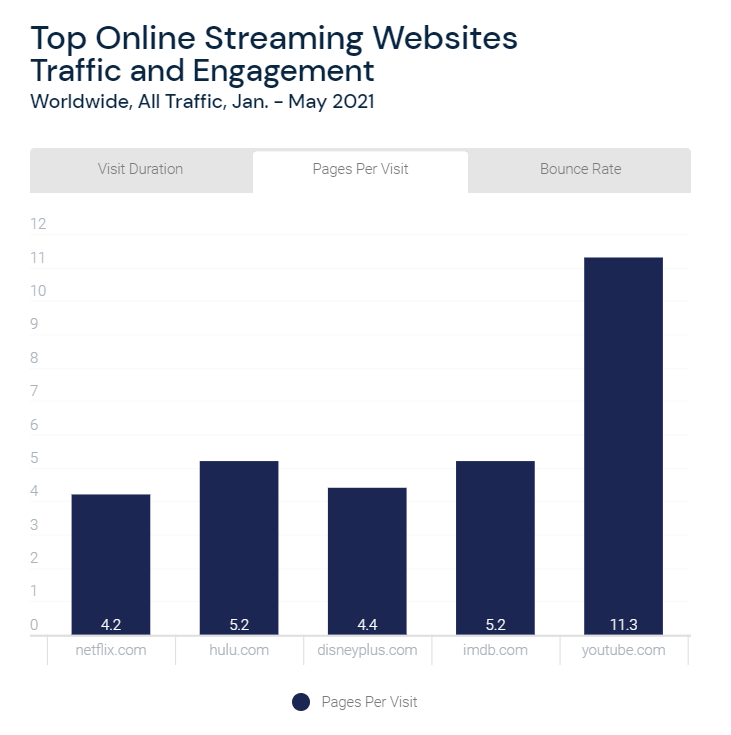
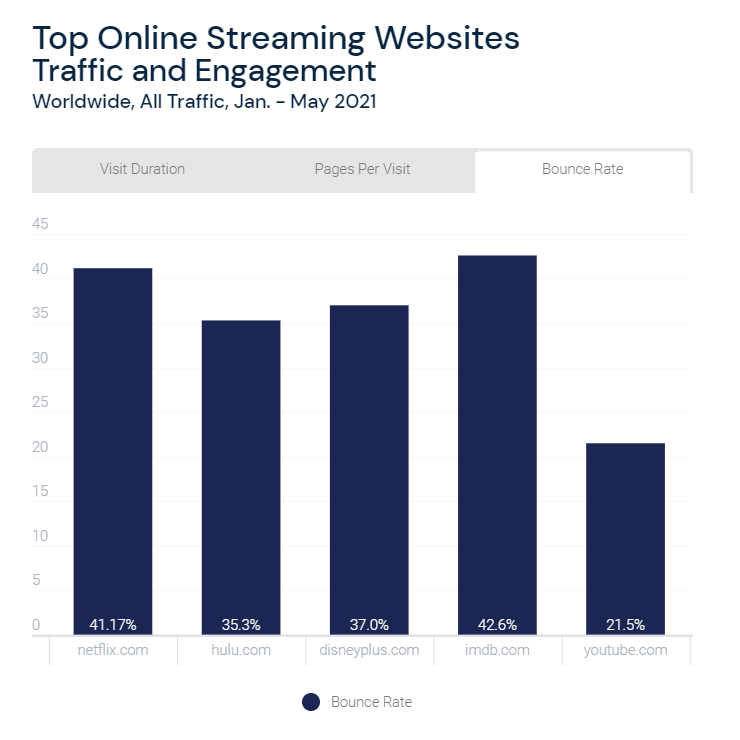
There are three key metrics you should be tracking to measure your visitors’ on-site experience and engagement with your website:
Below are user experience benchmarks for streaming websites globally, as well as in the U.S. and the U.K. (January–May 2021)
Top 100 websites in the category globally, all traffic
Top 100 websites in the category in the U.S., all traffic
Top 100 websites in the category in the U.K.
When looking at the top five websites globally, although netflix.com receives the second-highest number of visits per month, it has some of the lowest engagement rates, falling behind the other industry leaders especially in visit duration and bounce rate. Youtube.com has the best engagement metrics overall, followed by hulu.com.
The average streamer in 2021
One of the final steps of your benchmarking strategy is to figure out who is coming to your website, and if that differs at all from the industry norm. Knowing how your target audience differs (or resembles) your competitors will give you an advantage for any business venture.
With the right data collection, you’ll be able to expand user reach, grow into new markets, and ultimately win consumers away from your competitors.
Ten countries make up approximately 50% of the market share for the top 100 online gaming sites. Streamers in these countries account for 88 billion total visits from January–May 2021.
Top 10 Countries for Streaming Websites
Traffic Share & Average Monthly Visits
Desktop, All Traffic, Jan. - May 2021
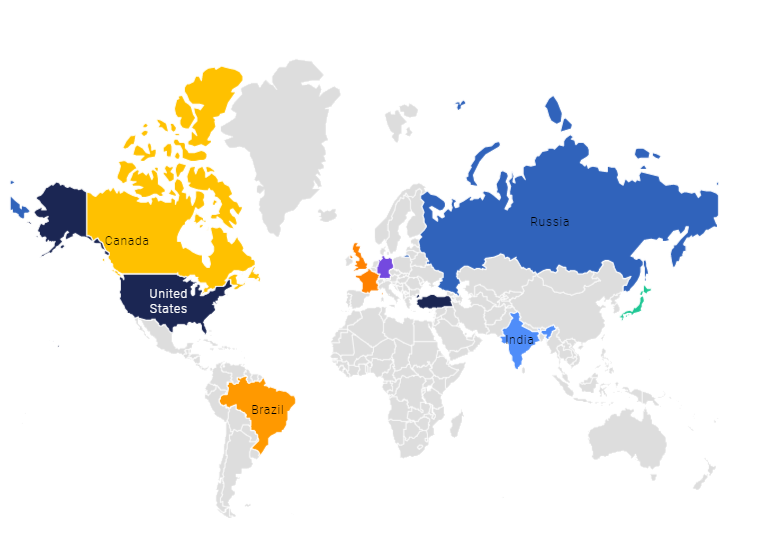
The U.S. is the most popular country for online streaming, owning 20.2% of the total traffic share with 34.1 billion month visits. Russia comes in second with 4.7% of the traffic share and 8.0 billion, and Brazil is the third most active country visiting streaming sites with 4.4% of traffic share and 7.4 billion visits.
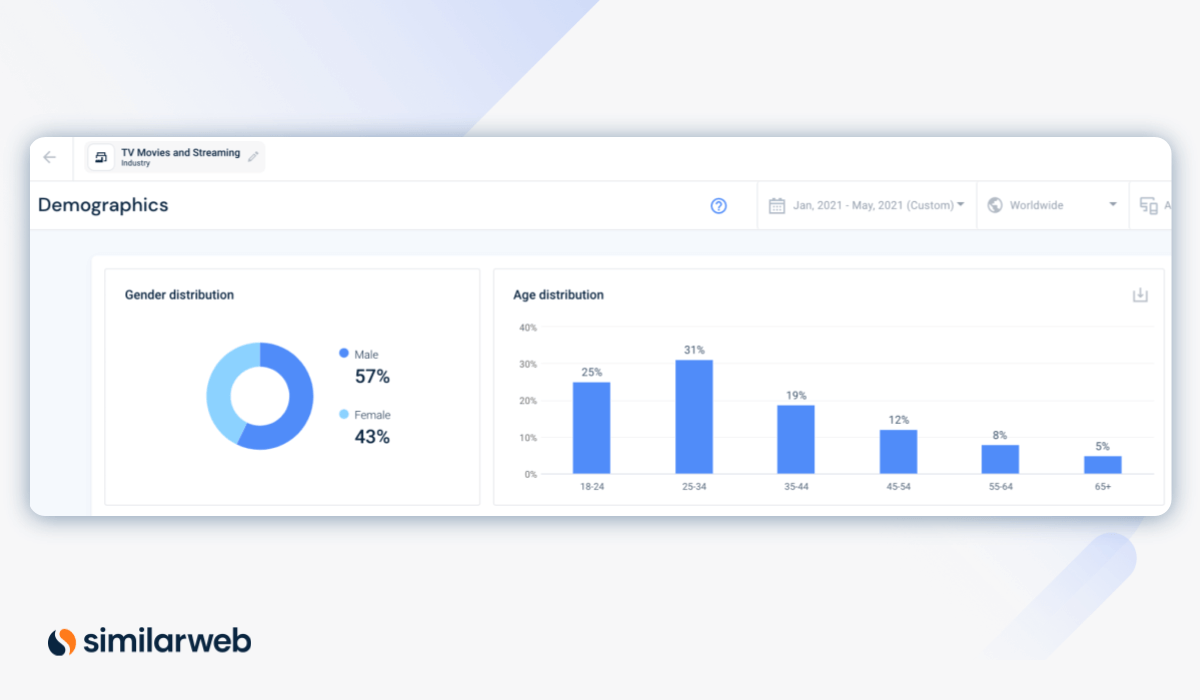
Males are slightly more likely to visit streaming websites than females. And age distribution for this industry tends to skew younger, with 56% falling between 18–34 years old.
Benchmarking with data
With the video streaming wars still raging on, benchmarking can be your key to success. But, in order to benchmark accurately, you’ll need reliable data on the digital world around you.
With Similarweb you’ll have everything you need to edge out the competition, including real-time insights of market trends, user engagement, and industry leaders.
To learn more about the data behind this article and what Similarweb has to offer, visit https://www.similarweb.com/.


Sign up to receive our stories in your inbox.
Data is changing the speed of business. Investors, Corporations, and Governments are buying new, differentiated data to gain visibility make better decisions. Don't fall behind. Let us help.


Sign up to receive our stories in your inbox.
Data is changing the speed of business. Investors, Corporations, and Governments are buying new, differentiated data to gain visibility make better decisions. Don't fall behind. Let us help.