Introduction
Welcome to the August Apartment List National Rent Report. Our national index increased by 2.5 percent from June to July, continuing a months-long trend of rapidly accelerating rent growth. So far in 2021, the national median rent has increased by a staggering 11.4 percent. To put that in context, in the pre-pandemic years from 2017-2019, rent growth from January to July averaged just 3.3 percent. This month’s spike continues to push rents well above where they would be if growth had remained on its pre-pandemic trend.
The data exhibit significant regional variation, and rents remain below pre-pandemic levels in a handful of the nation’s most expensive cities. But even in these markets, rents are quickly bouncing back. In San Francisco, for example, rents are still 14 percent lower than they were in March 2020, but the city has seen prices increase by 17 percent since January of this year. At the other end of the spectrum, many of the mid-sized markets that have seen rents grow rapidly through the pandemic are only continuing to boom – rents in Boise, ID are now up 39 percent since last March. Rent growth in 2021 so far is outpacing pre-pandemic averages in 98 of the nation’s 100 largest cities.
Rent growth heating up across the country
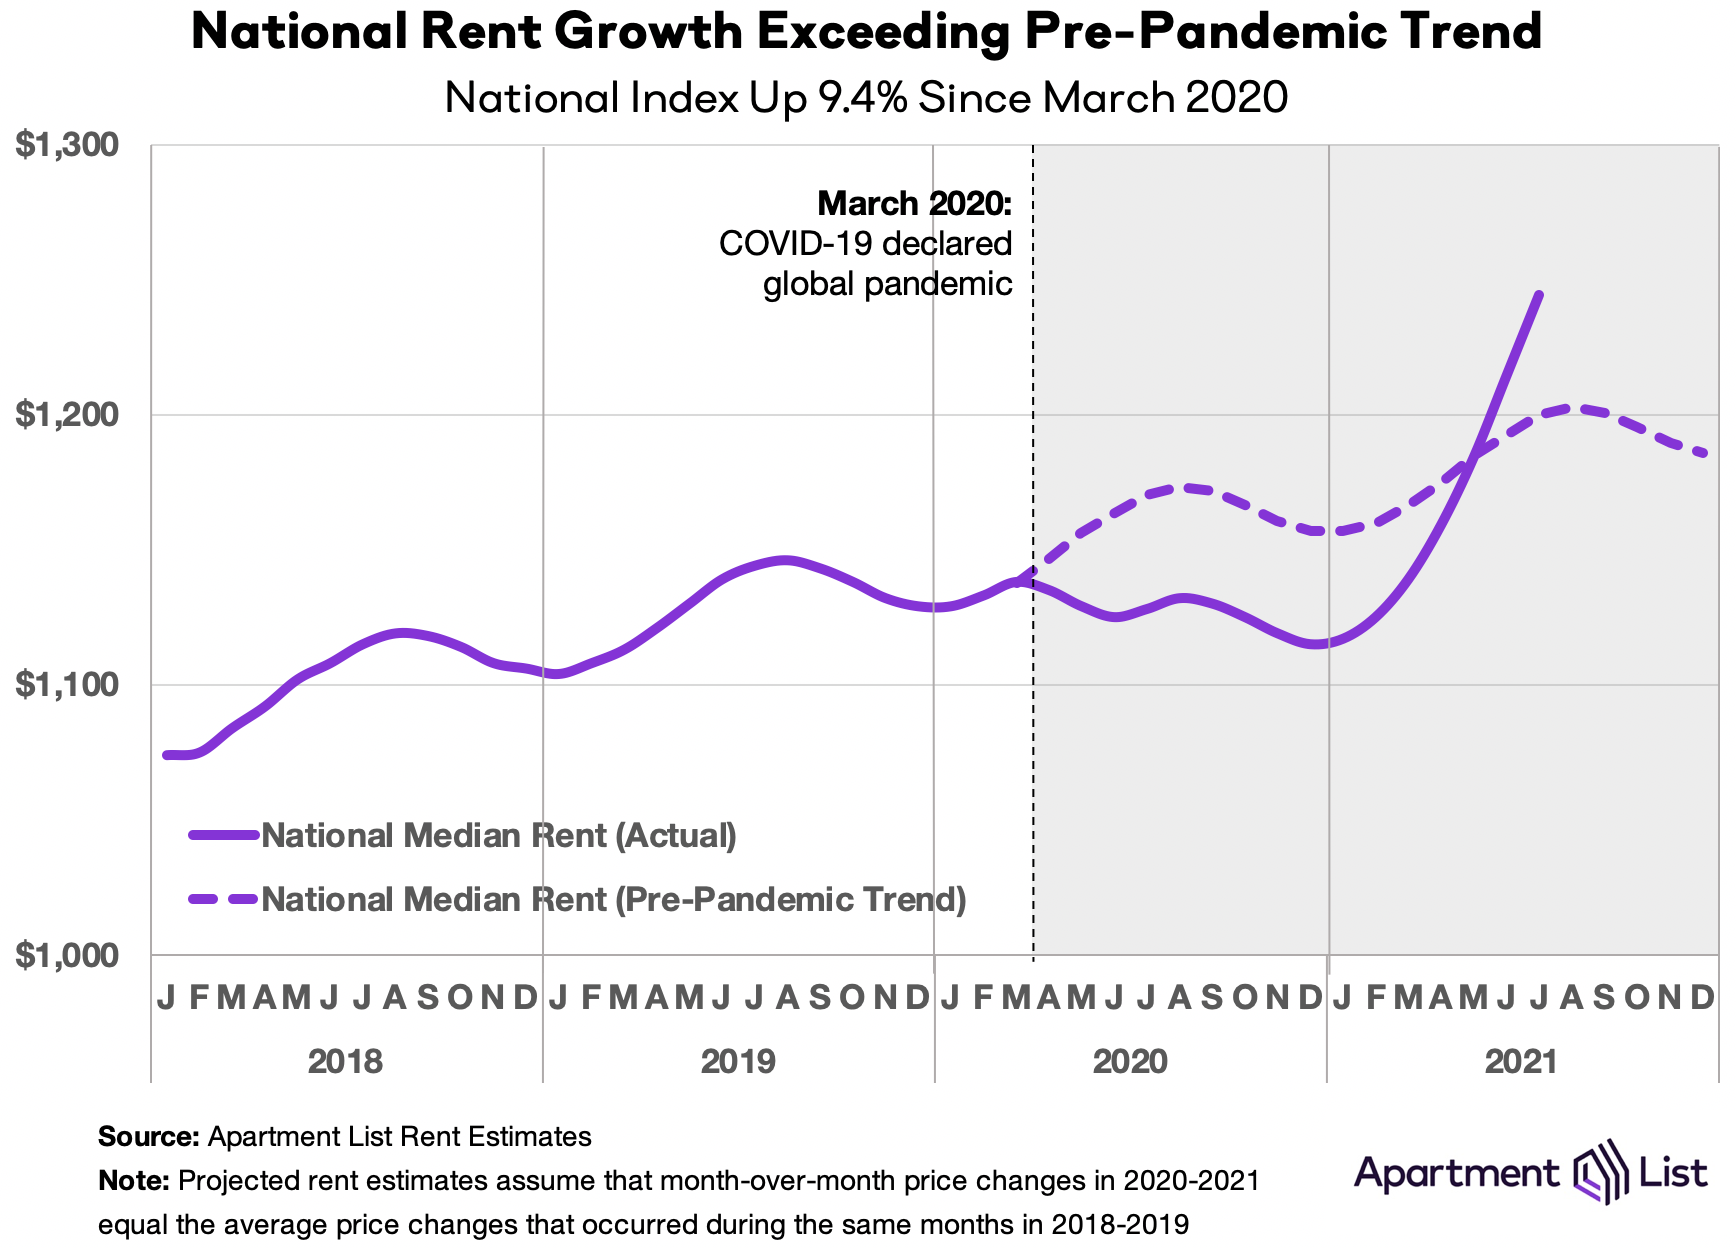
The first half of 2021 has seen the fastest growth in rent prices since the start of our estimates in 2017. Our national rent index has increased by 11.4 percent since January. Prices are up by 10.3 percent compared to this time last year and up 9.4 percent compared to the pre-pandemic level from March 2020. The recent spike has now put actual rents well ahead of the trend they were on prior to the pandemic. The national median rent currently stands at $1,244, which is $44 greater than where we project it would be if rent growth over the past year and a half had been in line with the growth rates we saw in 2018 and 2019.
While our national rent index always masks some regional variation, the current boom in rents is playing out in virtually every major market across the country. For most of 2020, rents were falling precipitously in the nation’s most expensive markets, while affordable mid-sized markets saw rent growth accelerate amid the pandemic. In contrast, 2021 has seen rapid rent growth across the board. In the following chart, each row represents one of the nation’s 100 largest cities, sorted from most-populous at the top to least-populous at the bottom. Each column represents a month, from January 2018 to July 2021, and the color of each cell represents the extent to which rent prices went up (red) or down (blue) in the given city in the given month.
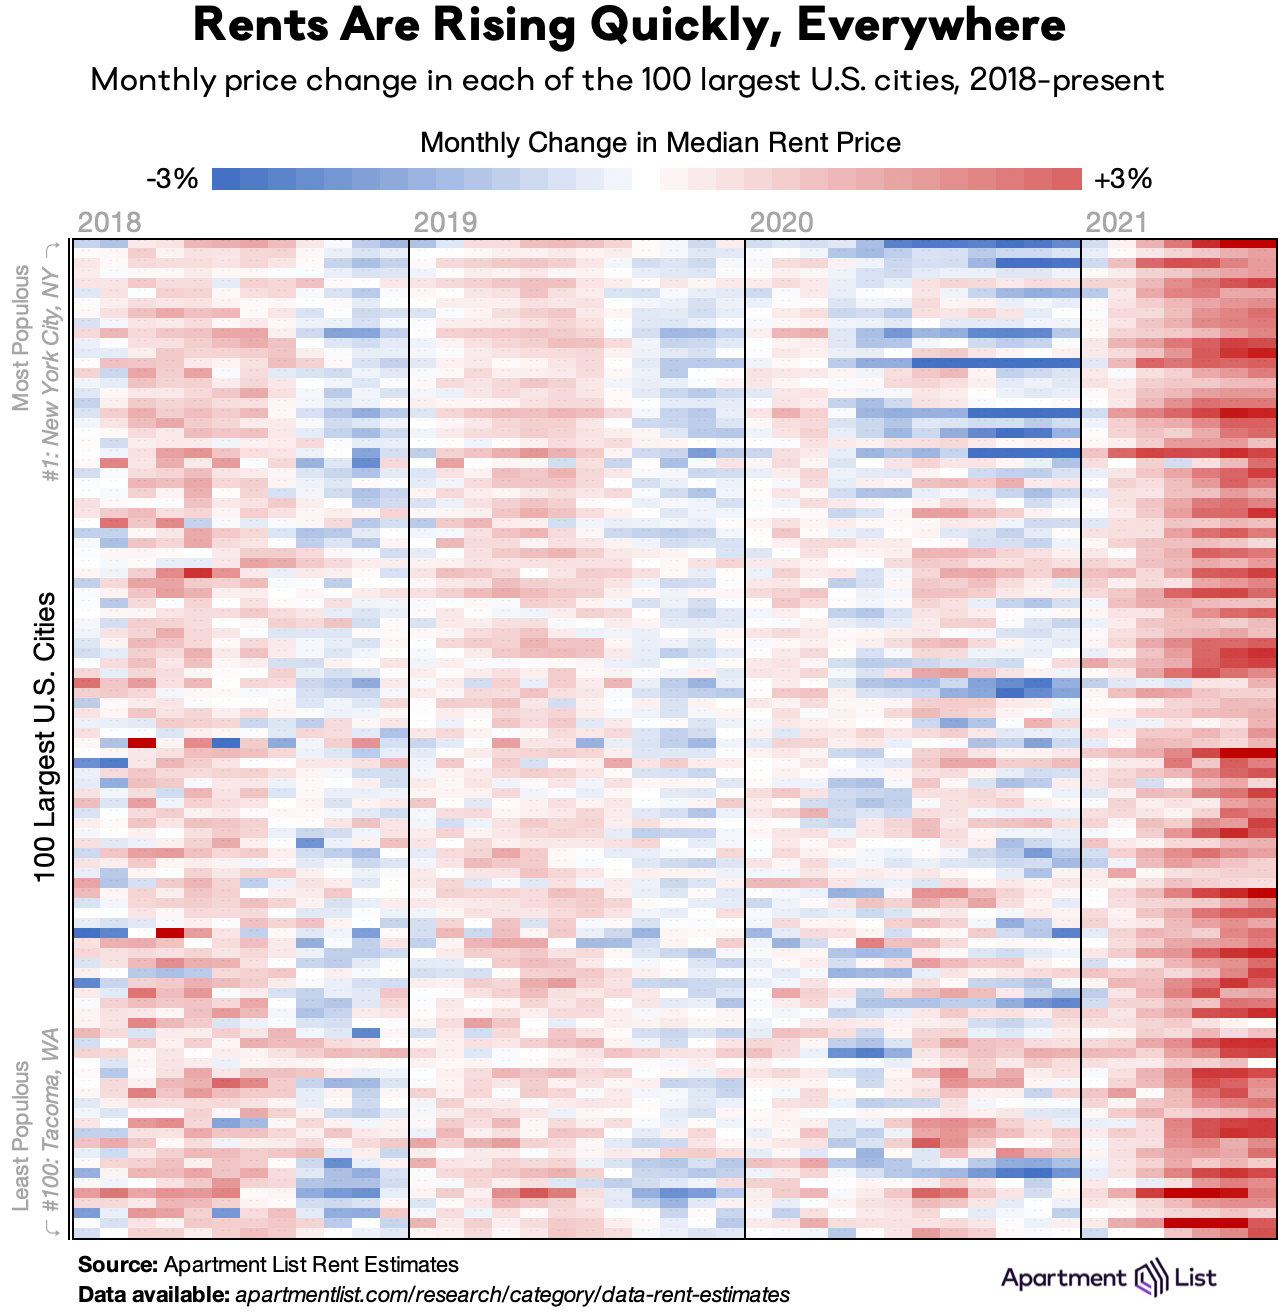
The dark red band on the right side of the chart illustrates that in virtually all of these cities, rents are currently growing faster than they have at any point in recent years. In 98 of the 100 largest cities, rent growth from January to July 2021 is outpacing the average growth from 2017 to 2019 over the same months.
Rents in coastal superstar cities continuing a strong rebound
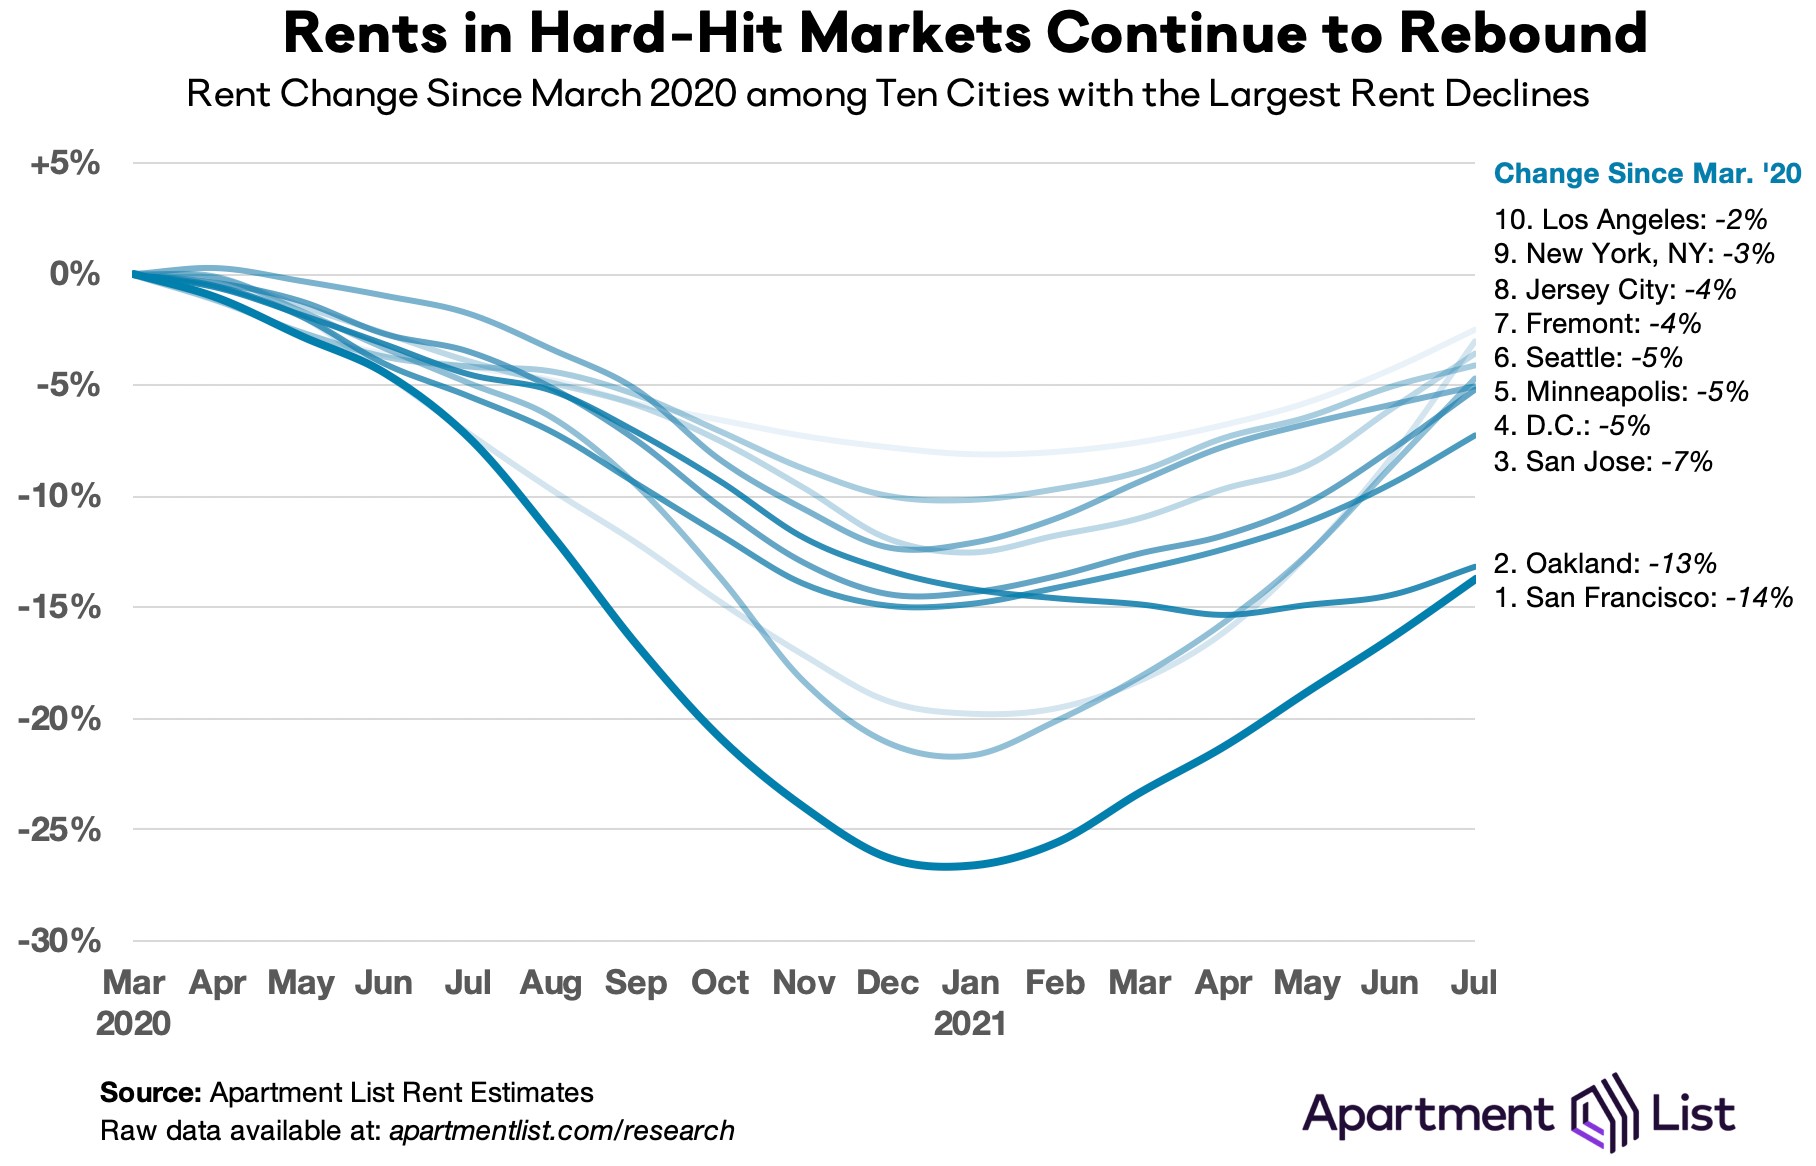
Rents remain below pre-pandemic levels in just 13 of the nation’s 100 largest cities, and even in these markets, prices are rebounding quickly. San Francisco consistently made headlines throughout the pandemic for the staggering 26.6 percent drop in rents from March 2020 through January 2021, but since January, San Francisco rents have increased by over 17 percent. Even sharper rebounds have been observed in Boston (+23 percent since January), Seattle (+22 percent), and New York (+21 percent). The chart below shows these rent drops and rebounds in the 10 cities where rents are still furthest below their March 2020 level.
These COVID-era price fluctuations – down quickly at the start of the pandemic, up quickly since the start of 2021 – are significantly more volatile than the seasonal price fluctuations we normally see in these markets. The chart below shows month-over-month price changes from 2018 to July 2021. Monthly changes of +/- 2 percent are relatively rare under normal circumstances, but in 2020 and 2021 we have seen extended stretches where prices rise and fall at more than twice that rate.
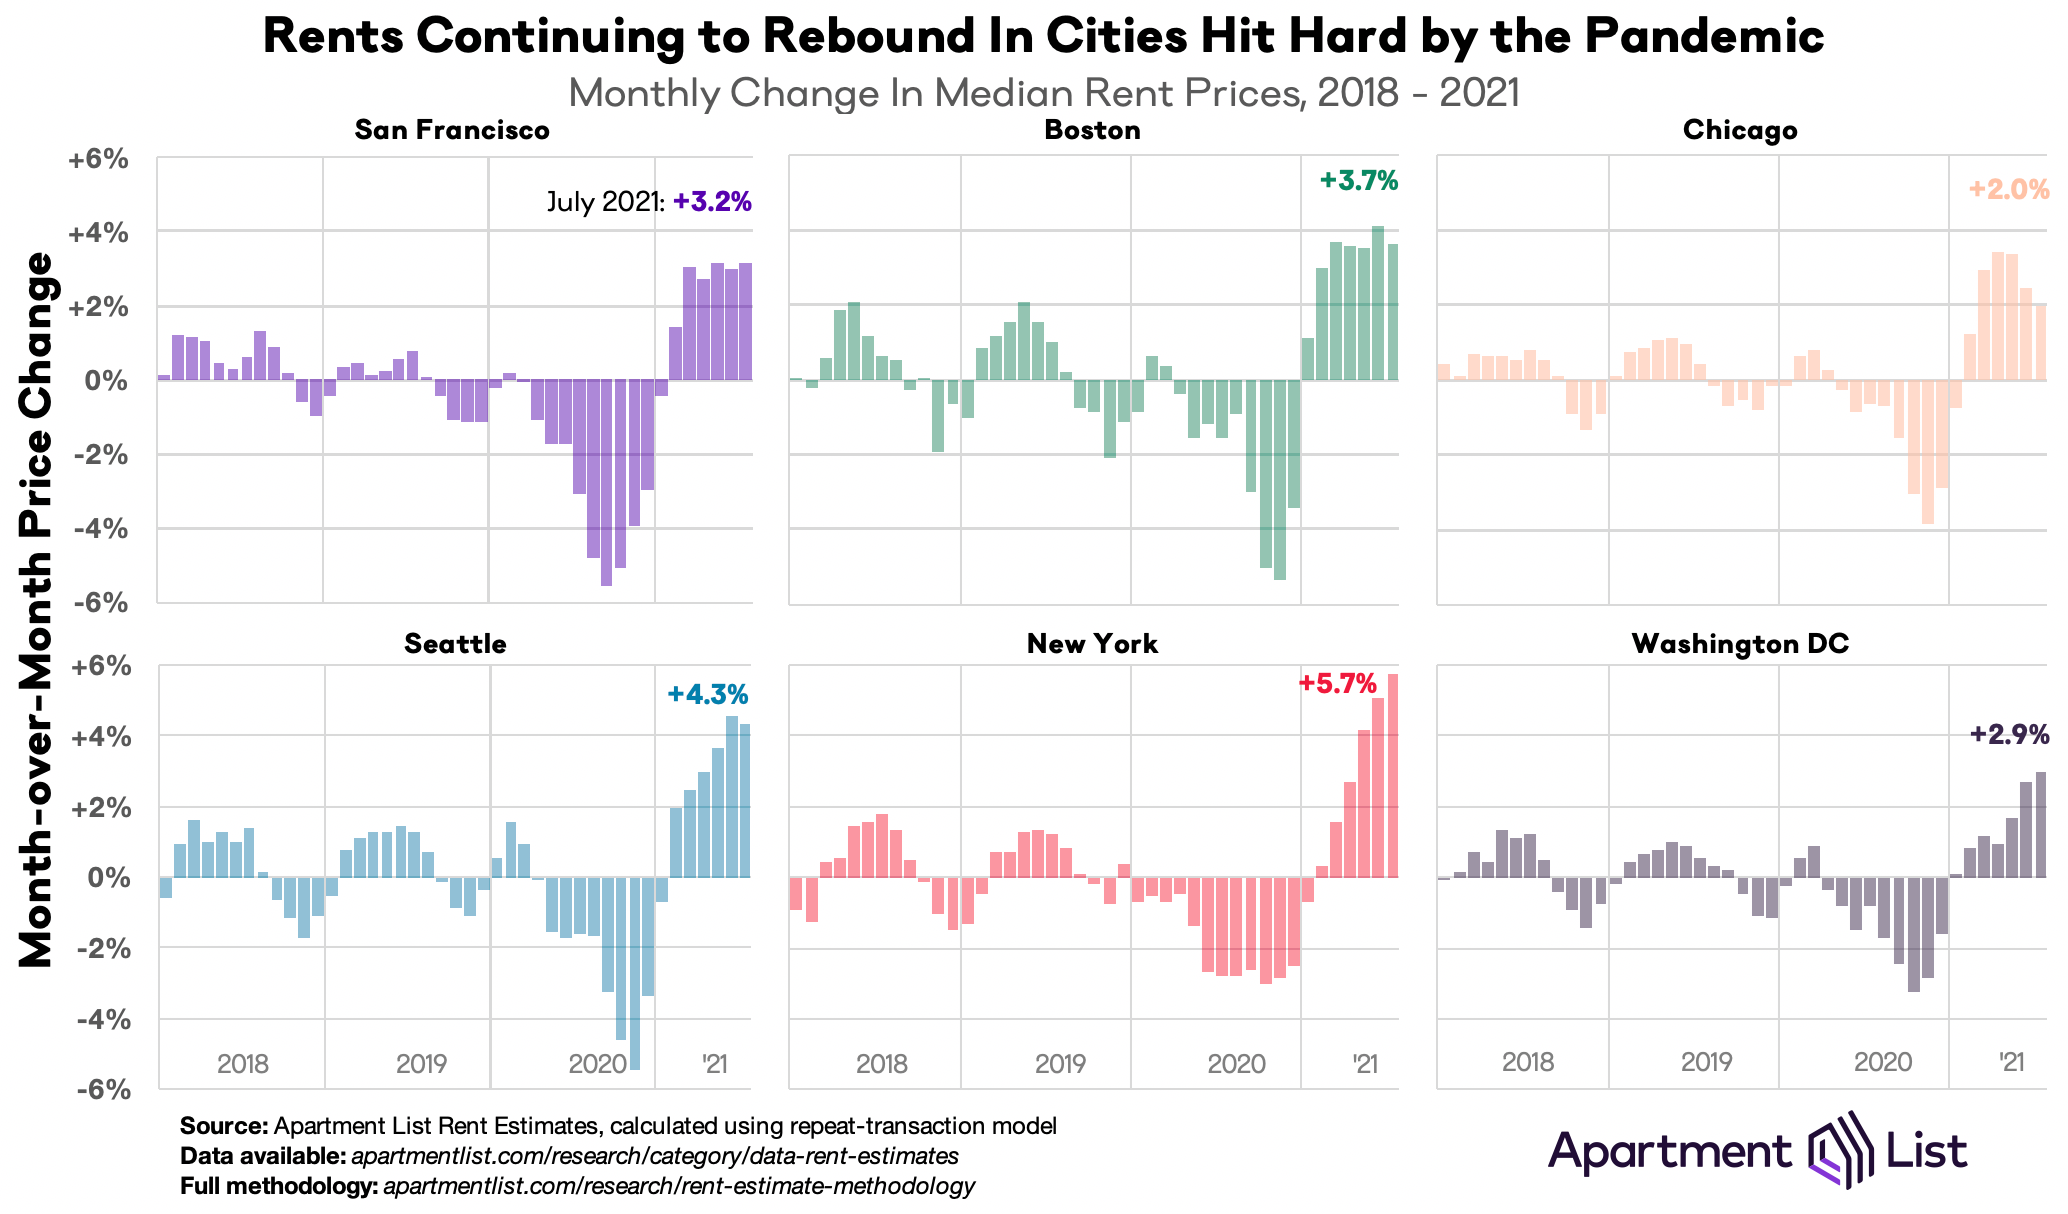
In each of the panels in the chart above, we see three distinct phases:
In each of the six cities shown, the fastest single-month rent increase has taken place in 2021. After the recent growth, rents in Boston and Chicago have now caught back up with pre-pandemic levels, and the other cities in the chart are all on pace to follow suit.
Affordable mid-size markets continue to boom
As expensive coastal cities watched rents plummet throughout 2020, another group of mid-sized markets were heating up. The pandemic and remote work spurred demand for the space and affordability that these cities offered, and in response, rent prices grew even as the surrounding economy struggled. Even while rent declines in expensive markets have reversed course, the cities where rents have been growing fastest are continuing to boom.
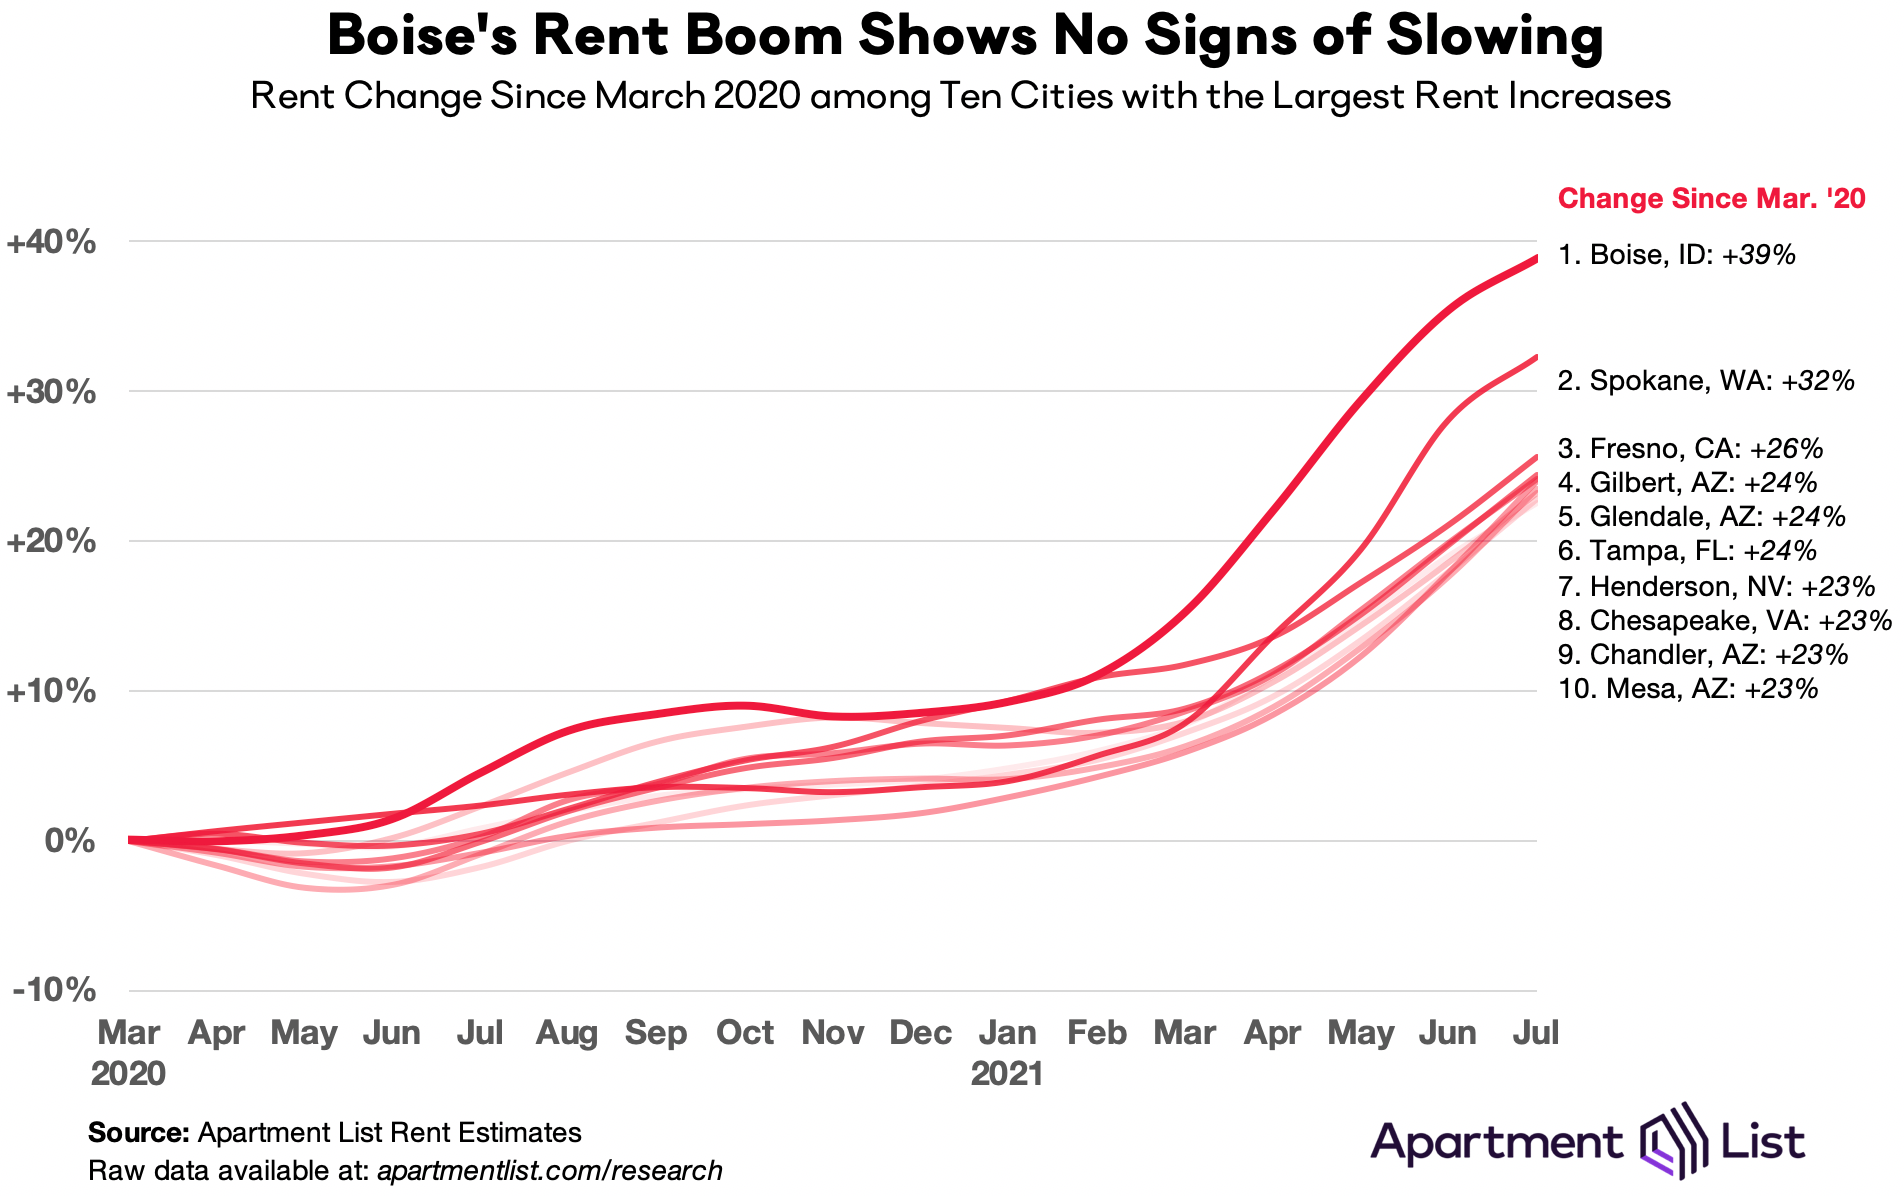
Leading the trend is Boise, ID, where rents are now up 39 percent since the start of the pandemic. Similarly, Spokane, WA has seen rents jump by 32 percent since March 2020. Among the nation’s 100 largest cities, 13 have seen growth of more than 20 percent since the beginning of the pandemic, and another 35 cities have seen growth of more than 10 percent.
In many of these markets, the pandemic did not start a new trend, so much as accelerate an existing one. For example, from 2017 through 2019, rents in Mesa, AZ increased 25.5 percent, the fastest growth in the nation over that period. Similarly, Fresno, CA ranked third for fastest rent growth, while Chandler, AZ ranked sixth. This stands in contrast to what has happened in the expensive markets discussed above, for which the rent declines of the past year were a complete aberration. Given this longer-term context, as well as the continued upward trajectory in rent trends, it seems that Boise and cities like it have yet to hit their peaks.
COVID shakeups have led to some convergence of expensive and affordable markets
As described above, affordability has been a key determinant of whether cities are experiencing falling or rising rents during the pandemic. The relationship is made more explicit in the chart below, which plots rent levels against rent changes for the 50 largest cities in our data. There is a clear correlation between the two; the cities that had the highest pre-pandemic rents in March 2020 (moving right along the x-axis) have seen the steepest rent drops since then (moving down along the y-axis).
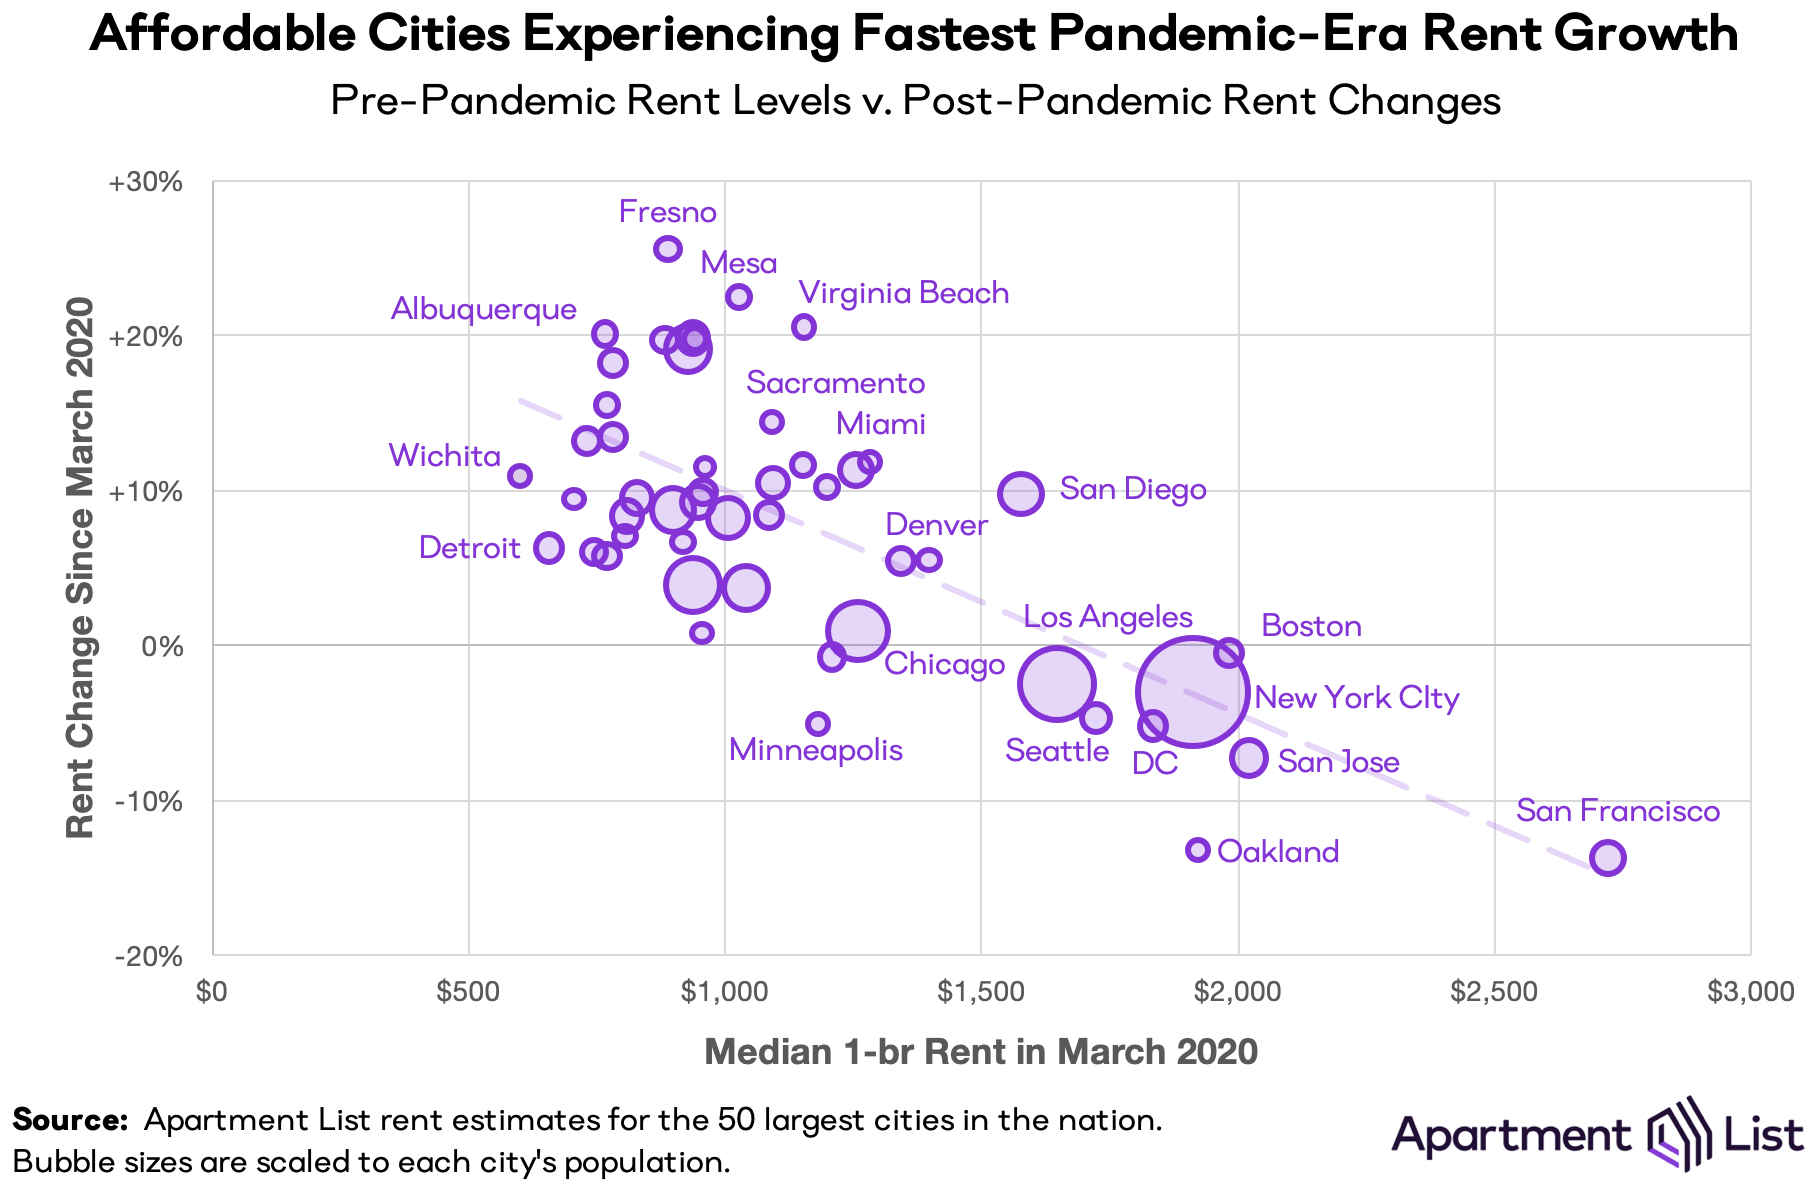
Meanwhile, more affordable cities have tended to see prices climb. This has led to a certain degree of convergence in rent prices across the country – the most expensive markets have gotten somewhat more affordable, while the most affordable markets have grown pricier. For example, last March, the median 2-bedroom rent in San Francisco was $3,146, which was 3.4x the $929 median for a 2-bedroom in Boise. As of this month, the 2-bedroom median in San Francisco has dropped to $2,708, while in Boise it has grown to $1,307, meaning that rents in San Francisco are now just 2.1x those in Boise. While still a significant price difference, the affordability gap has narrowed substantially, and even as rents in San Francisco have rebounded in recent months, Boise has continued to grow even faster.
Conclusion
Although the pandemic created some softness in the rental market last year, 2021 has brought the fastest rent growth we have on record in our data. Nationally, and in nearly all individual cities across the country, rent growth in 2021 has exceeded average growth rates from pre-pandemic years. Rents remain below pre-pandemic levels in just a handful of cities. And even in markets like San Francisco and New York where “pandemic pricing” is still in effect, prices are quickly rebounding. At the same time, booming markets like Boise continue to see prices climb. More broadly, rental inventory across the nation remains tight, and as economic recovery continues to gain momentum, we may be seeing the release of pent up demand from renters who had been delaying moves due to the pandemic. Whereas last year’s peak moving season was halted by the pandemic, this year’s seasonal spike is more than making up for lost time.
To learn more about the data behind this article and what Apartment List has to offer, visit https://www.apartmentlist.com/.


Sign up to receive our stories in your inbox.
Data is changing the speed of business. Investors, Corporations, and Governments are buying new, differentiated data to gain visibility make better decisions. Don't fall behind. Let us help.


Sign up to receive our stories in your inbox.
Data is changing the speed of business. Investors, Corporations, and Governments are buying new, differentiated data to gain visibility make better decisions. Don't fall behind. Let us help.