
The infamous dot plot from the Federal Reserve meeting last week suggests an expectation of a 2022 liftoff for U.S. interest rates. But who knows, forecasting interest rates is not like forecasting commercial property market trends: a lot can happen quickly. Still, seeing that chart, market professionals are asking if cap rates will go up if that expectation comes to pass in 2022. My question is, why should cap rates start responding to interest rates now all of a sudden?
There are a number of ways to unpack cap rates, what drives them, and how investors should set expectations around them. The simplest and most pervasive approach I see is one where investors look at expectations on trends for the 10yr US Treasury, add the current spread to cap rates to that future expectation, and assume that cap rates move up in tandem. This approach never works as there has never been a one-to-one correlation between cap rates and interest rates.
This is not to say that these measures are not linked. If the 10yr UST goes up to, say 19%, the commercial real estate industry is going to have a bad time. All rate instruments are linked, but are not in lockstep. Think of the variation in term across the yield curve. The slope of that curve changes over time with short- and long-term rates moving up and down based on the different risk expectations investors have for each of the time frames. Investors in different portions of the capital stack for commercial property likewise can have varying expectations on risk.
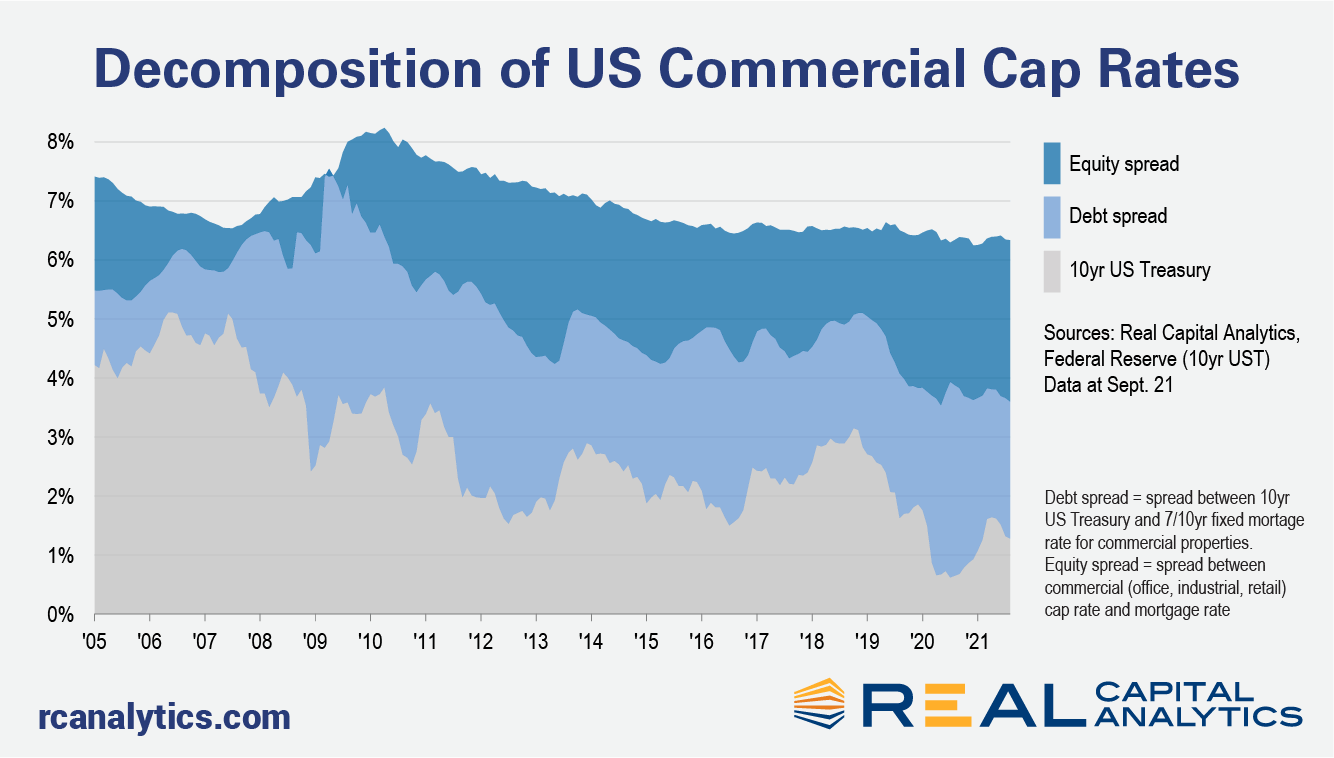
As a proxy for risk tolerance across the capital stack, the chart above looks at commercial cap rates in total broken down into two components relative to the risk-free rate of the 10yr UST. The grey at the bottom is the trend in the 10yr UST. The light blue shows the debt spread, the spread between the average rate on a 7/10 yr fixed rate commercial property loan and the 10yr UST. And the darkest blue at the top is the equity spread, the spread between commercial cap rates and mortgage rates. None of these figures move in lockstep, with spreads widening and tightening at times.
Of course, if a financial economist looks at this chart, they will scoff and note that the proper comparison to be made here is the spread between the 10yr UST and the underwritten IRRs for all commercial real estate investments. The cap rate after all is just the one-year return on the price paid and not the expected return over the life of the investment. (Certainly, I would be delighted to analyze all the underwritten IRRs on each deal in the market but market participants keep that information to themselves.)
This chart though captures an important behavioral pattern I have seen in my career. Talking with acquisition professionals, they like to look at cap rates on deals relative to their cost of financing and are willing to take a narrower spread when they have a higher tolerance for risk. Scoffing at this chart would be a case of forgetting the old adage: “if it works and it’s stupid, it ain’t stupid”.
The chart shows that over the 10 months of 2020 where the 10yr UST was below 1%, mortgage rates did not chase interest rates in lockstep. Lenders set a floor and mortgage rates averaged 3.7% over those 10 months, a 300 bps spread to the 10yr UST. In the less turbulent pre-Covid times from 2015 to 2019, that spread averaged 230 bps as lenders were willing to take on more risk. The 10yr UST is higher today than it was over most of 2020 but risk tolerance from lenders has brought that spread back down to 230 bps as of August 2021.
For the equity investors, the spread to the mortgage rate did not change much because of Covid-19 fears. Over that same 10-month period, cap rates exhibited a 260 bps spread to mortgage rates. Even before the pandemic, equity investors were fearful of the potential for rising interest rates and increased capex costs, and were pricing in these risks with higher spreads at acquisition. From 2015 to 2018, these investors had priced in 190 bps for cap rates on top of mortgage rates but from the second half of 2019 onward the average has been 260 bps, with only small variations each month.
The 10yr UST has been abnormally low for some time now and it will go up at some point. I am not hazarding a guess for when and how much it goes up. I will tell you what you should not expect, however. If we get a fed funds rate closer to 2% and a 10yr UST approaching 3%, you should not expect that the current spreads to mortgage rates and cap rates should just stack up on top of that 3% interest rate level.
Those spreads themselves expand and shrink over time based on the different risk perceptions of the participants in the equity and debt portions of the capital stack. If the interest rate increases come about from a scenario where everybody in the market is fearful, those spreads could actually increase relative to recent levels and pricing would be savaged. A more optimistic scenario would look at interest rate increases as a function of growth in the economy, which in turn could boost property income and reduce fearfulness. To make sense of where cap rates will be headed, you should really be asking yourself what factors will drive every market participant’s perception of risk.
To learn more about the data behind this article and what Real Capital Analytics has to offer, visit https://www.rcanalytics.com/.


Sign up to receive our stories in your inbox.
Data is changing the speed of business. Investors, Corporations, and Governments are buying new, differentiated data to gain visibility make better decisions. Don't fall behind. Let us help.


Sign up to receive our stories in your inbox.
Data is changing the speed of business. Investors, Corporations, and Governments are buying new, differentiated data to gain visibility make better decisions. Don't fall behind. Let us help.