There was speculation this past summer that, come Labor Day, workers would begin their return back to the office. Fast forward some months, with the Delta variant spreading and the Great Resignation testing the market, the nature of remote work remains top-of-mind: are employees returning back to the office, or will remote work be a sustained new reality in a post-pandemic workforce?
We have refreshed our May analysis on measuring workers’ return to the office via consumer foot traffic to dense urban Starbucks locations near large office buildings.* We dug deep into individual Starbucks locations within our foot traffic dataset and looked at visitation behavior across ten major downtown hubs. This analysis also drills further into downtown New York City and Boston to paint a detailed picture of just how varied the different neighborhoods within the two cities look to date. We also looked at daypart data to isolate morning traffic patterns at Starbucks to round out the analysis.
Key takeaways of back-to-office analysis
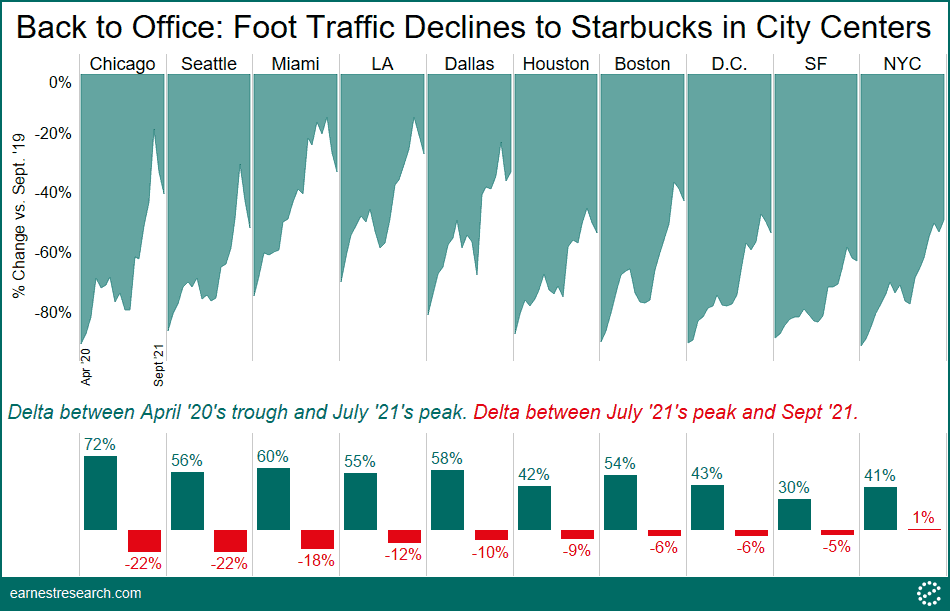
Through September ‘21, visits to Starbucks locations near office buildings in downtown Los Angeles, Dallas, and Miami, are down ~30% vs. September ‘19 levels. Chicago and Boston are down 40%, NYC, Seattle, D.C., and Houston, are down ~50%, and San Francisco is the least revived, down ~65%.
There was an acute reversal in recovery from July ‘21 onward following what had been a steady climb in revival from April ‘20’s bottom. Chicago swung the most: recovering 70 points through July ‘21, then giving back 20 points of those gains over the summer. NYC was the only city that did not reverse course, but it also didn’t improve much either since July.
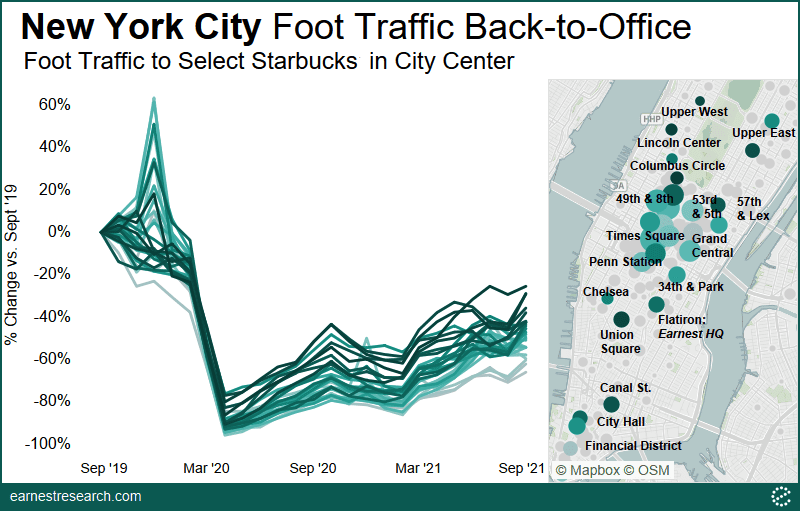
NYC’s Columbus Circle, Lincoln Center, and Union Square are most revived, down ~25% to 30%. Most locations throughout the city are down ~40 to 60%; Penn Station and Times Square are at the lower end, down ~50% to 60%. The Financial District and Grand Central station locations are lagging last, with declines of ~60% to 70%.
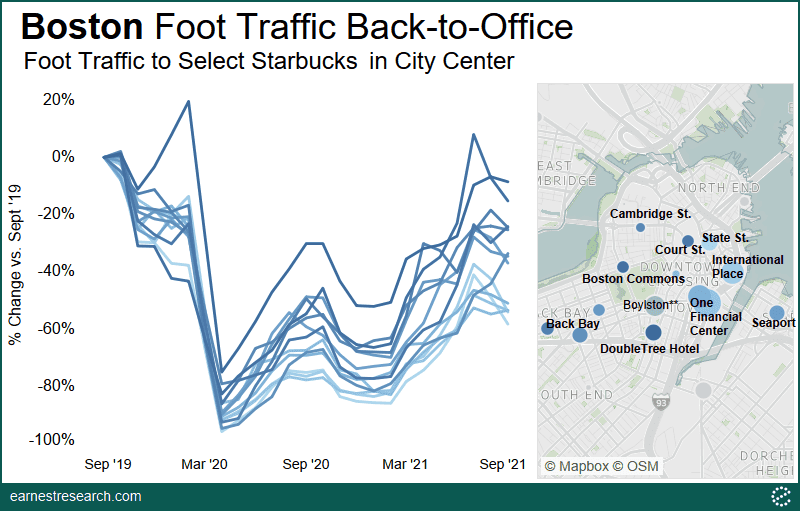
Some Boston locations pushing ahead include the Starbucks inside the DoubleTree Hilton Hotel on Washington St. and the one on Beacon St. near Boston Commons, with [just] ~10 to 15% declines. Back Bay and the Seaport locations are down ~25% to 35%, while One Financial Center and International Place are down ~50%. The 84 State St. location is least revived, down ~ 60%.
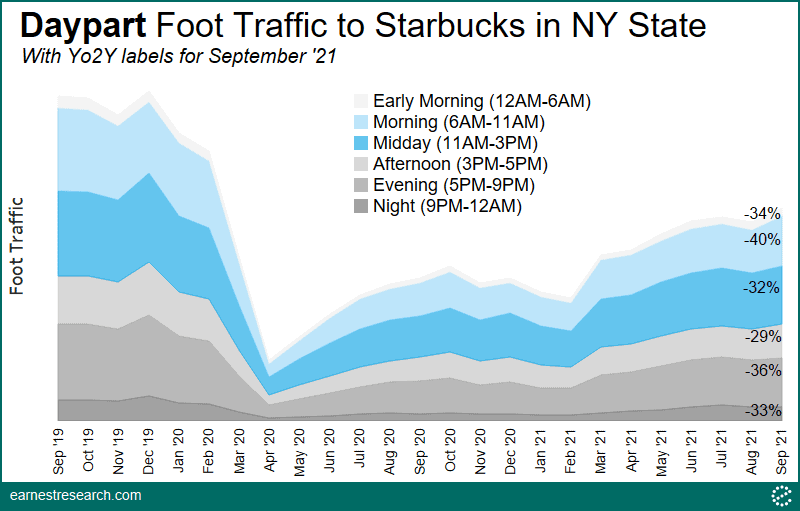
In NY state as a whole, the morning hour (6am to 11am) visits to Starbucks are down the most relative to all other dayparts, down ~40% vs. September ‘19 levels. By contrast, Midday (11am to 3pm) and Afternoon (3pm to 5pm) traffic trends are performing relatively better, down ~30%.
Overview of foot traffic to Starbucks stores in city centers
Visits to Starbucks locations near office buildings across ten major cities mirror the trends we found in our May analysis with few exceptions.
Relative to September ‘19 foot traffic levels, downtown Los Angeles, Dallas, and Miami, are down ~30% as of September ‘21, with Los Angeles seeing the most revived visits of the group. Chicago and Boston are down 40%, while New York City, Seattle, D.C., and Houston are each down ~50%. San Francisco continues to be the least revived, down ~65%.
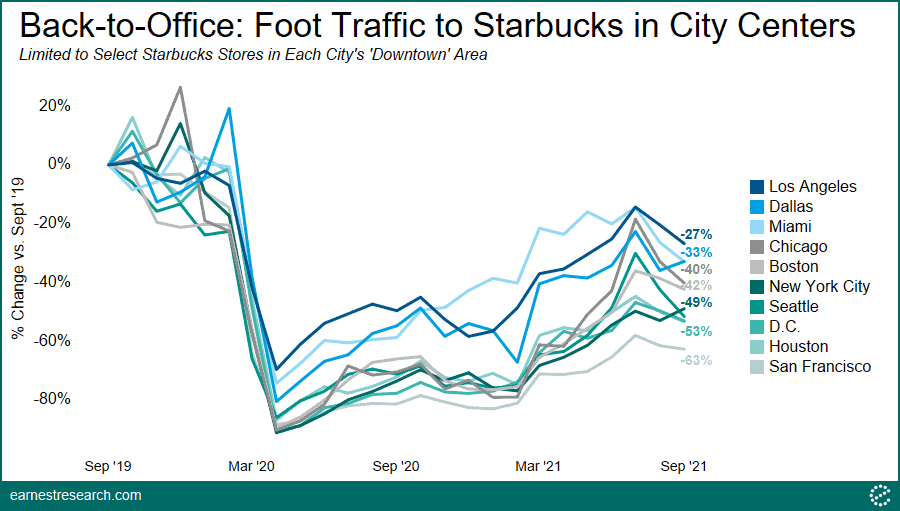
The interesting takeaway, however, is an almost acute reversal in recovery from July onward across virtually all cities.
Climbing up from April 20’s bottom, a recovery in foot traffic peaked this past July ‘21: Chicago saw over 70 points of recovery, San Francisco saw [just] 30 points, and the other cities saw 40 to 60 points. However, this was followed by an immediate reversal where foot traffic declines stopped getting smaller and began to get bigger once again, a likely response to the Delta variant.
Chicago, a city that saw one of the fastest recoveries, scaled back some of its gains from July onward, seeing over 20 points of further declines through September. Seattle and Miami also saw 20 points of further declines. Los Angeles, Dallas, and Houston each dropped by another 10 points, however, from very different summer peaks: Los Angeles’ traffic in July was [only] down 14% from pre-pandemic levels, Dallas was down 23%, while Houston was still down 45% back then.
Boston, D.C., San Francisco, and NYC peaked the least in July and so their reversals were not as stark: the former three by 5 points while NYC saw a minimal 1 point gain.
Back-to-Offices/Starbucks in NYC
In our May analysis, traffic to NYC Starbucks locations were down 65% in aggregate. As of September ‘21, traffic is now down 50%, still a ways towards full recovery. Looking more comprehensively by neighborhood paints a varied picture.
Starbucks near Columbus Circle, Lincoln Center, Union Square, The Upper East Side, and The Upper West Side are the most revived, down ~25% to 40%. Canal Street, Flatiron, City Hall, Chelsea, and several other locations around the city are down ~40% to 50%.
Locations trailing the aggregate’s 50% include those near Penn Station and Times Square, as well as the busy intersections around 53rd & 5th, with declines of ~50% to 60%. The Financial District and Grand Central station locations are lagging last, showing declines of ~60% to 70%.
Back-to-Offices/Starbucks in Boston
Boston continues to revive at a pace in the middle of the pack, now down 40% as of September, and up from the 60% declines back in May. As noted above, Boston was slightly more revived back in July, with 35% declines, but reversed course over the summer due to the Delta variant.
Locations pushing ahead with [just] ~10 to 15% declines include the one inside the DoubleTree Hilton Hotel on Washington St. as well as the one on Beacon St.** right outside Boston Commons. Court St., Back Bay, and the location by the Seaport are down ~25% to 35%, and One Financial Center and International Place are down ~50%. The location at 84 State St. is most vacant, down 58%.
Morning hour foot traffic trends to Starbucks
To round out the analysis, we cut the overall Starbucks visitation behavior by daypart in order to isolate morning traffic trends (6am to 11am), i.e. times where the bulk of back-to-office patrons would likely get their coffee. (See our daypart analysis where we showed how the pandemic shifted the mix of traffic from morning to midday).
Looking in NY state as a whole, while all dayparts are down from September 2019 levels, the morning hours are down the most, down 40% Yo2Y; likely reflecting a relatively more vacant downtown office-building environment. By contrast, Midday (11am to 3pm) and Afternoon (3pm to 5pm) traffic are performing relatively better, down ~30%, reflecting outperformance in NY suburbs and/or the increased flexibility of today’s workers in their new remote home-office environment.
Notes
*Methodology: Making an intellectually honest inference from Starbucks visitation behavior to workers’ return-to-office requires an intimate knowledge of urban centers and their downtown office layout. Our methodology for choosing particular Starbucks locations as representatives of back-to-office behavior involved identifying stores that were located in “downtown” hubs near large office buildings, as indicated by their locations on a map, as well as locations that had the highest consumer traffic during the full year of 2019 (with some exceptions).
**Traffic to this Beacon St. location outside Boston Commons is also right near Calvin Coolidge College, and therefore likely benefited, to a degree, from an influx of students when the semester began in September. Similarly, the busy location on Boylston St., depicted in a light green circle on the map, is also right near Emerson College, and as such, saw a ~40% spike in traffic this past September from an influx of students. We have excluded the Emerson College location from our analysis to keep to our theme of back-to-office as best we can.
To learn more about the data behind this article and what Earnest Research has to offer, visit https://www.earnestresearch.com/.


Sign up to receive our stories in your inbox.
Data is changing the speed of business. Investors, Corporations, and Governments are buying new, differentiated data to gain visibility make better decisions. Don't fall behind. Let us help.


Sign up to receive our stories in your inbox.
Data is changing the speed of business. Investors, Corporations, and Governments are buying new, differentiated data to gain visibility make better decisions. Don't fall behind. Let us help.