It is easy to say that 2021 was the hottest real estate market ever. According to the S&P CoreLogic Case-Shiller Home Price Index (HPI), annual U.S. appreciation rates from April to September have been at their highest since the inception of the index. March through June produced the highest ever monthly appreciation rates, and CoreLogic’s public records data shows 2021 is easily on pace to be the first year where total residential housing transactions will exceed $2 trillion.
Figure 1: one, two, three, four, five and 10-year appreciation in S&P CoreLogic Case Shiller Index, Not Seasonally Adjusted
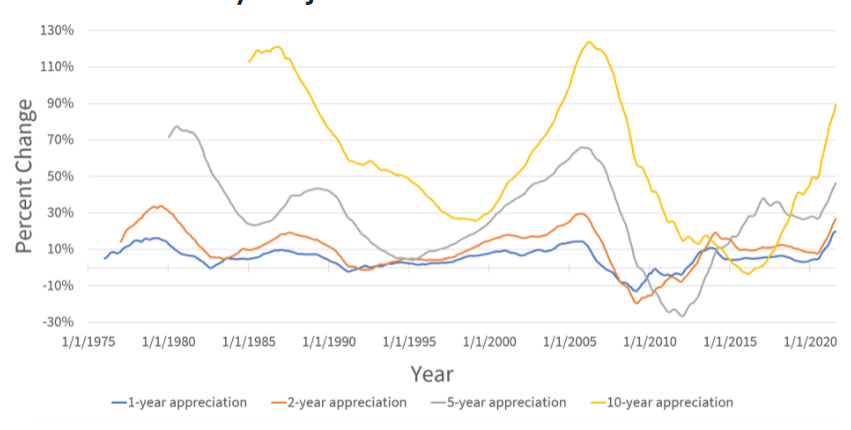
Real estate values change more slowly than stock and bond prices to new market information. Keeping that in mind, when we take a view of price appreciation longer than one year, the recent surge loses its position. Figure 1 plots one, two, five and 10-year appreciation in the market. The red line, showing one-year appreciation, is highest at the end of the series, marking the current record appreciation. Looking at any of the other lines, we can see that they peak in late 2006, at the zenith of the previous boom. For two-year appreciation, the difference is close at 29 percent in 2006 vs. 27 percent now. Beyond that, the difference grows as the period is extended; five-year-67 vs 47, and 10-year 123 percent vs. 93 percent.
Figure 2: One, two, three, four, five and 10-year Appreciation in S&P CoreLogic Case Shiller Index, Not Seasonally Adjusted, Adjusted for Inflation
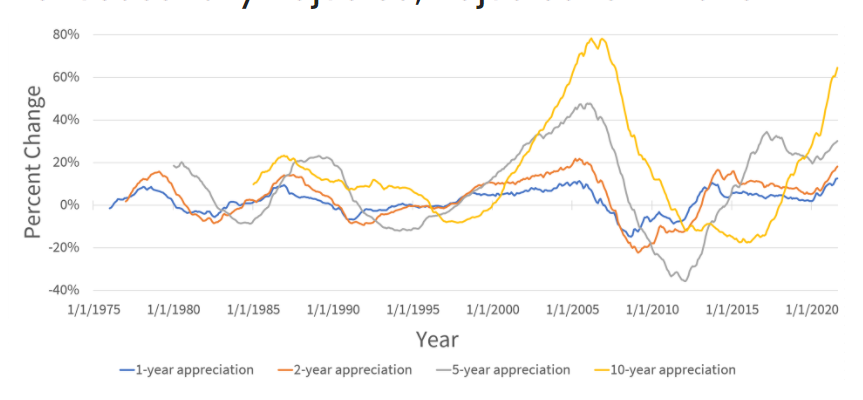
The difference remains when we look at real home prices. Figure 2 shows the same series adjusted for inflation. The peaks in the 1970s and 1980s are muted, but from the 1990s onwards we see minor differences between the two figures. The difference in one-year appreciation has shrunk, now 12.5 percent in September 2021 vs 11.5 percent in June 2005, and in every other series, the 2021s boom is outstripped by the previous one. While the current appreciation is an unprecedented event in terms of short-run appreciation, it is not the long, sustained growth that we saw in the 2000s bubble.
Though prices have taken off over the past year, we are in an extended period of appreciation. Starting in 2011, prices have begun growing, and have not looked back. Since July 2012, prices have been higher every month than they were at the same time last year, a streak now stretching nine years and two months. This is not a record, but it is close. Starting March 1997 there was positive year-over-year appreciation for every month until November 2006, a streak of nine years and eight months. It is possible that this streak will be eclipsed next year. CoreLogic’s forecast predicts that year over year appreciation will remain positive this long, though the rate of appreciation will taper sustainably, down to about two percent.
Figure 3: Monthly Appreciation in S&P CoreLogic Case Shiller Index, not seasonally adjusted, adjusted for inflation.
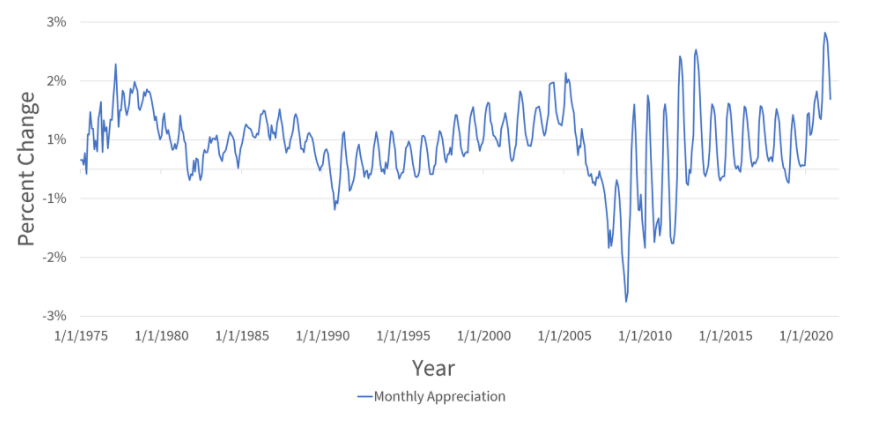
If we consider month over month appreciation, the 2000s boom holds a streak that is unlikely to be broken anytime soon. Beginning in January 1997, prices were higher every month than they were in the previous month until July 2006, a nine-year and six-month streak. Although the year over year streak is more than nine years long as of August this year, the current month over month streak only began in February 2019.
Another point of comparison is the level of appreciation across the streaks. During the current yearly appreciation streak, prices have gone up 86 percent (that converts to an annualized rate of 6.8 percent). During the 2000s streak, the annualized rate of appreciation was 8.1 percent.
Although the current level of 1-year appreciation is higher than during the 2000s bubble, a longer view of that appreciation shows that it does not compare to the long, sustained increases in prices that were seen in the bubble.
To learn more about the data behind this article and what CoreLogic has to offer, visit https://www.corelogic.com/.


Sign up to receive our stories in your inbox.
Data is changing the speed of business. Investors, Corporations, and Governments are buying new, differentiated data to gain visibility make better decisions. Don't fall behind. Let us help.


Sign up to receive our stories in your inbox.
Data is changing the speed of business. Investors, Corporations, and Governments are buying new, differentiated data to gain visibility make better decisions. Don't fall behind. Let us help.