
New home prices up less in 2021, but more over the last Decade
The Case-Shiller methodology is the established standard for measuring home price growth. This is for good reason. Contrast it with the second most common method: the median. The median comes with the substantial flaw that it can change because different types of homes are selling, and not because they are appreciating. The Case-Shiller methodology avoids this by comparing a homes’ sale price in one sale compared to its previous sale. For example, if in the first quarter, ninety percent of home sales are in a neighborhood where all homes are identical and cost $250,000, and ten percent are in a neighborhood where all homes cost $500,000, the median returns a value of $250,000. In the second quarter, the price of all homes remains the same, but the ratios flip so ninety percent of sales are now in the latter neighborhood. The median is now $500,000, and a comparison of the two medians would conclude that prices have doubled. Case-Shiller and other repeat sales indexes avoid this problem by comparing home sales to their previous sale price.
Repeat sales indexes are not without their blind spots. Notably, they exclude new home sales as there is no prior sale to compare it to. If new homes are experiencing different rates of appreciation than resales, the repeat sales index will be missing the true level of appreciation. New home sales typically make up between 10% and 20% of all residential sales, so while smaller, they are not an insignificant share of sales.
Although repeat sales indexes are not possible, there are still plenty of ways to measure appreciation for new homes. For example, the hedonic index is more accurate than medians in this instance. Though it does not compare a home to its previous sale, a hedonic index is considered constant quality, because it controls for the important structural characteristics and location of the home.
Figure 1: US Home Price Appreciation: New Homes vs. Resales
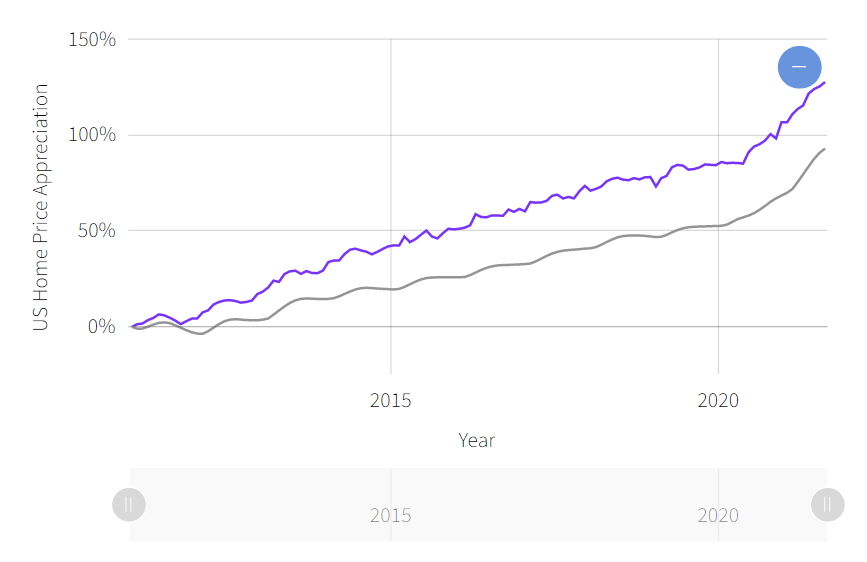
Figure 1 shows a National Hedonic Index for New Home Sales based on CoreLogic’s public records data from 2011-2021, and the S & P CoreLogic Case-Shiller National Index (a repeat sales index). We see that in the last 10 years, the prices of new homes have gone up more than existing homes. As of August 2021, new homes were 127% more expensive than in 2011 and existing homes were 93% more expensive. Existing home sales are the large majority, so overall prices more closely track the repeat sales index. If we created a weighted combination of the two based on the share of sales that they represent, appreciation would only come in at 97% since 2011, much closer to the repeat sales.
Figure 2: U.S. YOY Home Price Appreciation: New Homes vs. Resales
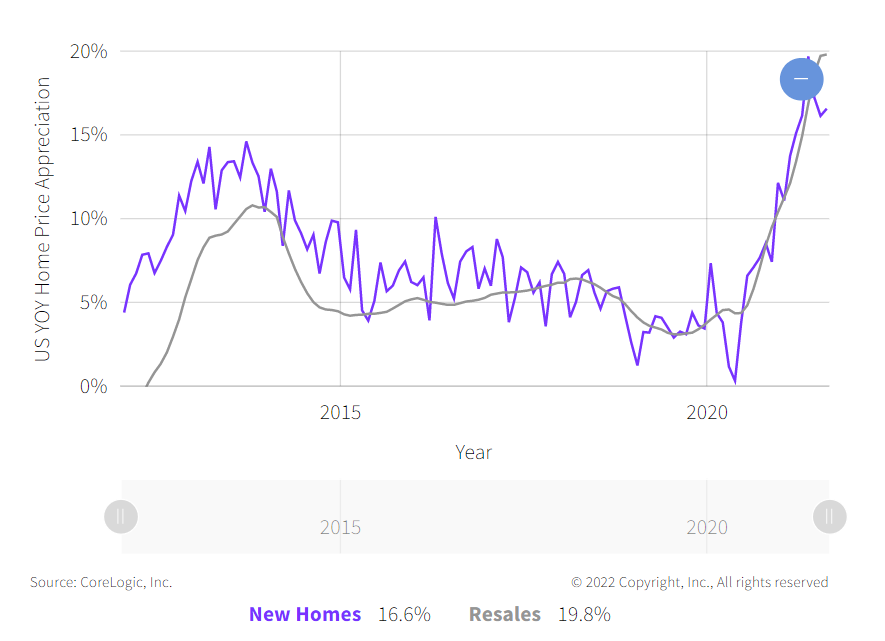
Figure 2 compares the year-over-year (YOY) growth from the 2 indexes. In the past year, appreciation has been similar for both, but new home sales have slightly lagged resales. Both had record YOY appreciation, coming in at 19 percent in May for new home sales (a couple of months before the July peak for existing home sales). The YOY number for new homes comes with a slightly different context than repeat sales. Looking at the May 2020 number in Figure 2, we can see that new homes experienced no appreciation that month (a notable flat period can be seen at the same time in Figure 1), likely reflecting the local lockdowns early in the pandemic. Repeat sales prices grew 4% in the same month. Comparing the two numbers directly is not that informative, since the baselines are very different.
Figure 3: U.S. 2-Year Appreciation: New Homes vs. Resales
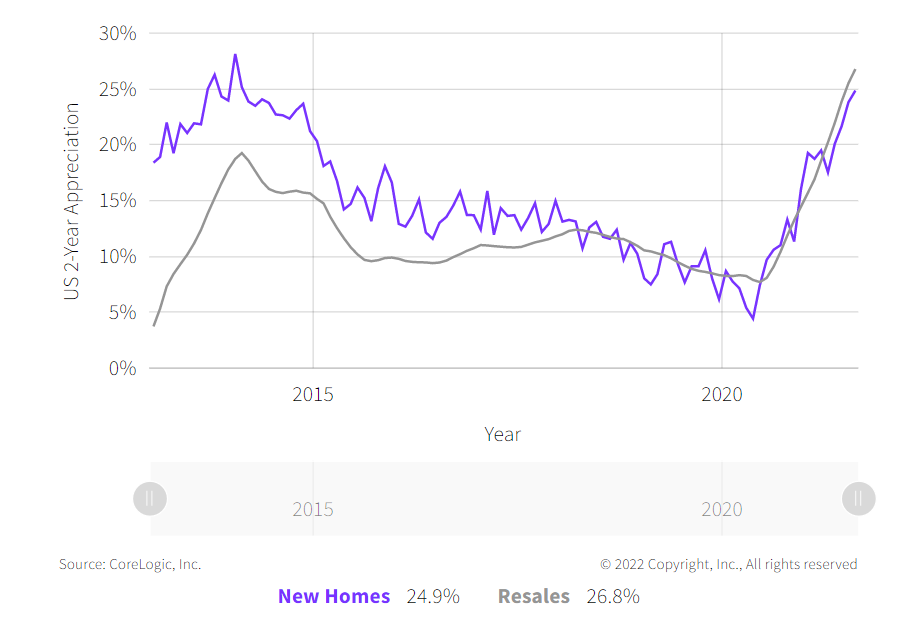
Figure 3 shows two-year appreciation in new home sales that provides a comparison that avoids the April and May 2020 stall in prices for new homes. The new home sales index and repeat sales indexes both returned their similar values in August 2021, 25% and 27% respectively. Something that might be unexpected when we look at 2-year appreciation, however, is that new home prices were rising more quickly in the first half of the 2010s. The high point in two-year appreciation for the last 10 years was in January 2014 when it came in at 28%. While the surge in existing sales prices is unprecedented, for new home sales it is not as exceptional.
Looking at new homes sales reminds us that repeat sales indexes answer a specific question: What is the appreciation rate of existing homes? Since existing homes make up most sales, this usually informs about the overall housing market, although that may not have been the intention of the index. Different pockets of the housing market behave differently. New home prices have risen in the last year, though not quite to the same extent as existing homes, and had a boom at the start of the 2010s that was not seen in the existing home market.
To learn more about the data behind this article and what CoreLogic has to offer, visit https://www.corelogic.com/.


Sign up to receive our stories in your inbox.
Data is changing the speed of business. Investors, Corporations, and Governments are buying new, differentiated data to gain visibility make better decisions. Don't fall behind. Let us help.


Sign up to receive our stories in your inbox.
Data is changing the speed of business. Investors, Corporations, and Governments are buying new, differentiated data to gain visibility make better decisions. Don't fall behind. Let us help.