Introduction
Welcome to the March 2022 Apartment List National Rent Report. After a slight seasonal cooldown over the past few months, rent growth is back on an upward trajectory, with our national index up by 0.6 percent over the course of February. Even though month-over-month rent growth has moved back into positive territory, it remains substantially cooler than last summer, when rents grew by more than 2 percent per month for four straight months. Year-over-year rent growth currently stands at a staggering 17.6 percent, but most of that growth took place last spring and summer. Over the past four months, rents have increased by a total of just 0.7 percent. That said, this month’s growth was still faster than the pre-pandemic norm for this time of year.
On the supply side, our national vacancy index is continuing to slowly inch up, indicating a gradual easing of the tight market conditions that have characterized the rental market over the past year. We estimate that the national vacancy rate hit 4.5 percent this month, continuing a seven month streak of increases after bottoming out at 3.8 percent last August. Rents increased this month in 74 of the nation’s 100 largest cities, with Sun Belt markets such as Phoenix and Miami continuing to see some of the nation’s fastest growth.
Month-over-month rent growth picks back up with 0.6% increase; up 17.6% year-over-year
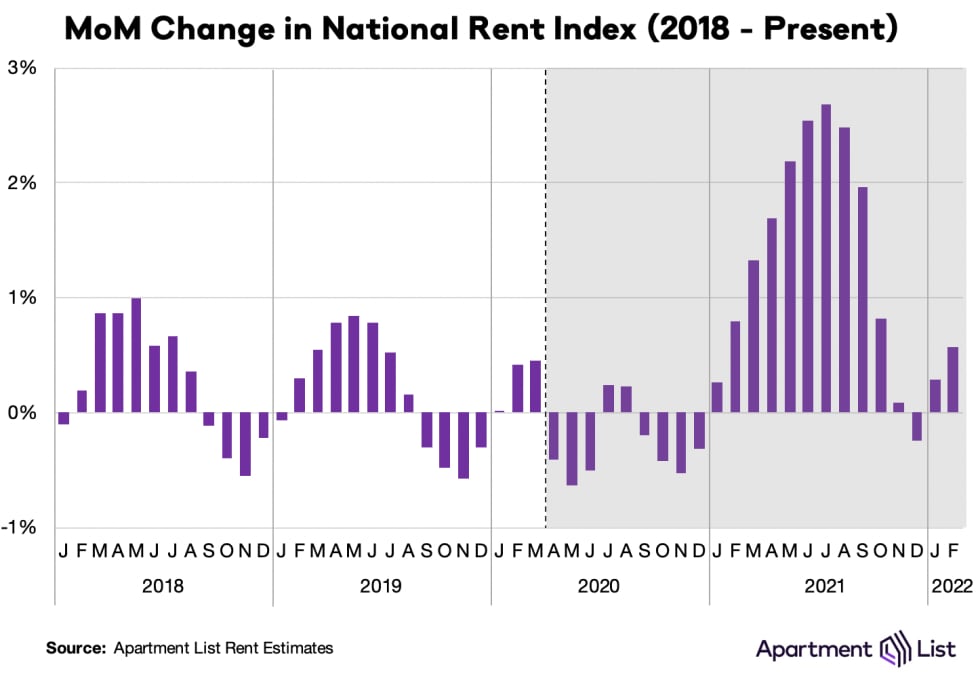
Our national rent index closed out 2021 with a 0.2 percent month-over-month decline, making December the only month last year in which rents fell. That price dip proved to be short lived, however, with rent growth returning to positive territory over the past two months. Our national rent index increased by 0.6 percent month-over-month in February. This is a bit slower than the 0.8 percent increase that we saw last February, when the 2021 rent growth boom was just starting to pick up steam. It’s also well below the 2.1 percent average monthly rent growth that we saw from last March through September. But even if growth has cooled down substantially from last summer’s peak, it is also pacing well ahead of the pre-pandemic norm for this time of year. From 2017 to 2020, February rent growth averaged just 0.3 percent; this month’s increase was double that rate.
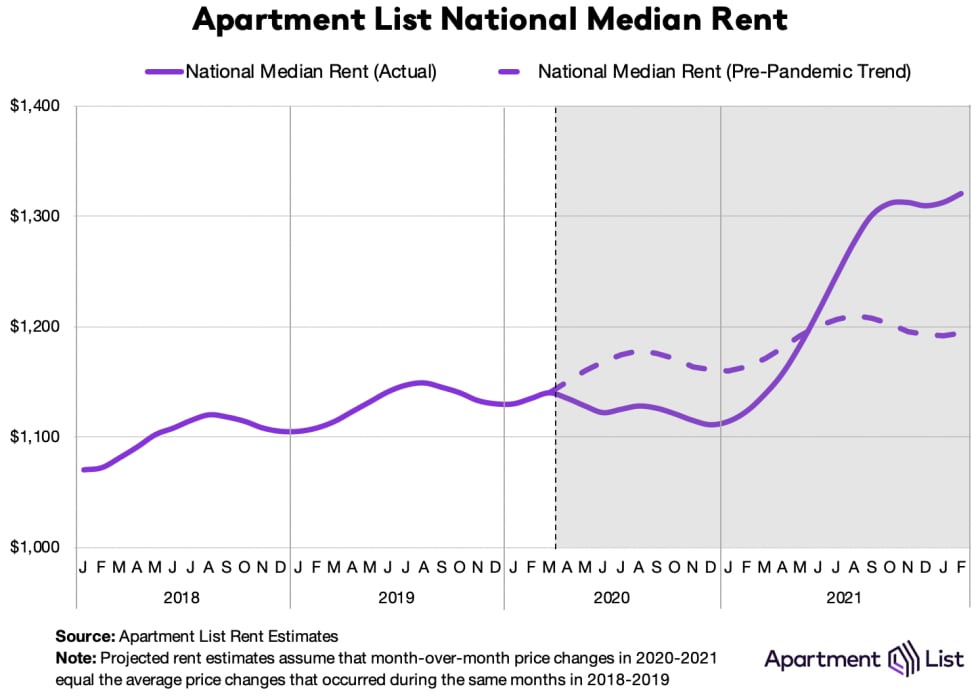
Over the past 12 months as a whole, rent prices have spiked by an unprecedented 17.6 percent nationally. The early stages of the pandemic led to a modest decline in rents from March through December 2020 (-2.5 percent), but the staggering growth of 2021 more than made up for the lost ground. In fact, the national median rent ($1,321) is now $126 greater than where we project it would have been if rent growth since the start of the pandemic had been in line with the average growth rates we saw in 2018 and 2019. Rent growth over the past year has far outpaced that of any prior year in our estimates, which go back to 2017. For comparison, year-over-year rent growth in February averaged just 2.4 percent in the three years preceding the pandemic.
Last summer’s rent growth heatwave has entered a slight reprieve recently. Over the most recent four months, monthly growth has averaged just 0.2 percent, with a total increase of less than one percent over that period. That said, we’re still in the midst of what is normally the slow season for the rental market. As we enter the spring and summer months, it’s likely that rent growth will speed up amid increased moving activity. Even if prices don’t rise as rapidly as they did in 2021, we’re already seeing signs that 2022 will be another year of above-average growth.
Vacancy index shows rental market tightness continuing to ease
As we’ve explored in detail, much of the 2021 rent boom was attributed to a tight market in which more households were competing for fewer vacant units. Our vacancy index spiked to 7 percent at the onset of the pandemic in 2020, as many Americans moved in with family or friends amid the uncertainty and economic disruption of the pandemic’s onset. After that, however, vacancies began a steady decline, eventually falling below 4 percent.
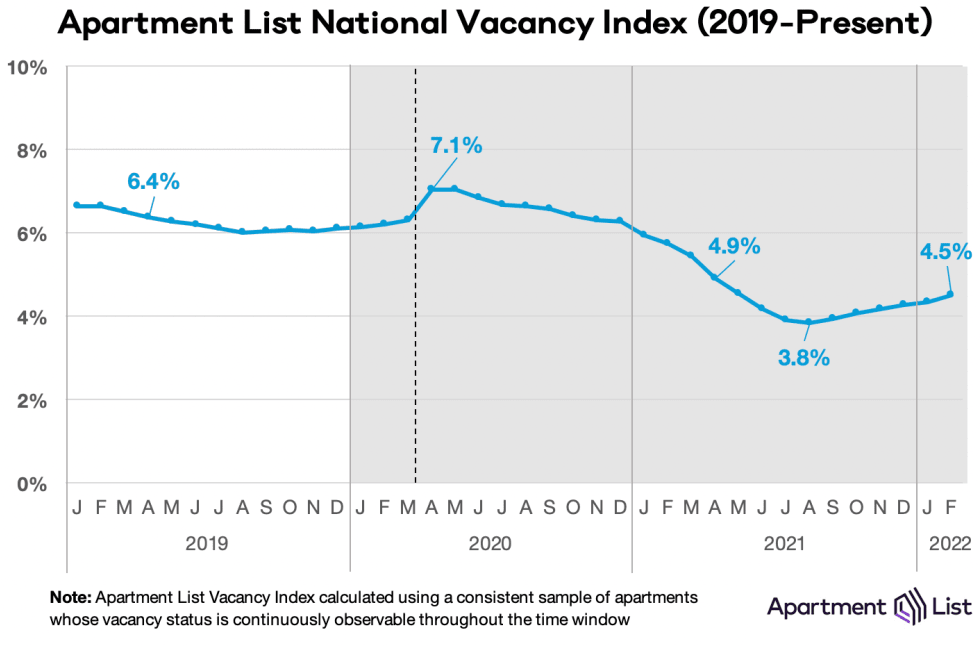
But after bottoming out at 3.8 percent last August, our vacancy index has now slowly ticked up for six consecutive months and currently stands at 4.5 percent. Although the recent vacancy increase has been modest and gradual, it represents an important inflection point, signaling that tightness in the rental market is finally beginning to ease. However, the vacancy situation still remains historically tight. Over the past six months, our vacancy index has been increasing by an average of 0.1 percent per month. If that pace continues, we won’t hit a vacancy rate of 6 percent – the pre-pandemic norm – until next summer. Nonetheless, the gradual increase in vacancies in recent months has likely been contributing to the slowdown in rent growth.
Rents up month-over-month in 74 of 100 largest cities
If 2020 was characterized by price convergence (expensive cities getting cheaper and cheaper cities getting more expensive), 2021 was characterized by price inflation: cities large and small getting more expensive, rapidly. This can be seen in the chart below, which visualizes monthly rent changes in each of the nation’s 100 largest cities from January 2018 to present. The color in each cell represents the extent to which prices went up (red) or down (blue) in a given city in a given month. The band of dark red in 2021 depicts last year’s rent heatwave, which peaked in July and August 2021 when all 100 cities in this chart saw prices go up. Meanwhile, the rightmost columns show rent growth falling back to more reasonable levels in recent months. In December 2021, rents fell in 61 of the nation’s 100 largest cities, the only month last year in which more than half of these cities saw a decline. This month, however, rents were up in 74 of the nation’s 100 largest cities.
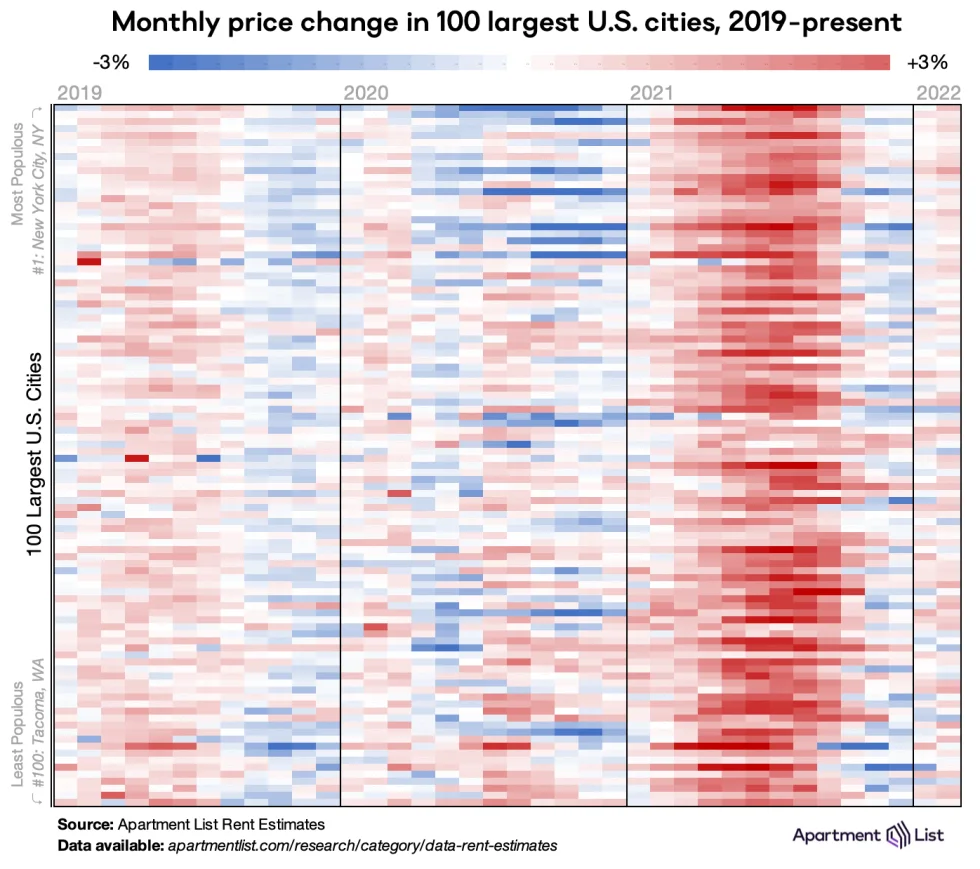
While rent growth has slowed nationally, not every city has followed the same trajectory. Most of the 100 cities in the chart above have seen at least one month of falling rents over the past five months, but in 28 of these cities – primarily scattered across the Sun Belt – prices have continued to trend upward, even if the pace has slowed. At the other end of the spectrum, there are 33 cities where the median rent is currently lower than it was last September. Whereas 2021 saw rapid rent growth across the U.S., different parts of the country are now seeing prices trend in opposite directions.
Rents continuing to climb rapidly in FL and AZ metros
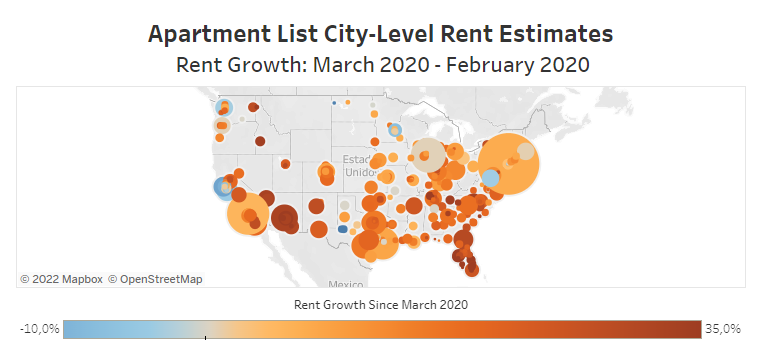
As mentioned above, major markets throughout the Sun Belt have experienced virtually-uninterrupted rent growth since the start of the pandemic. The following table shows rent growth for the ten metropolitan areas that have experienced the fastest rent growth over the past six months, over the past year, and since the pandemic started in March 2020:
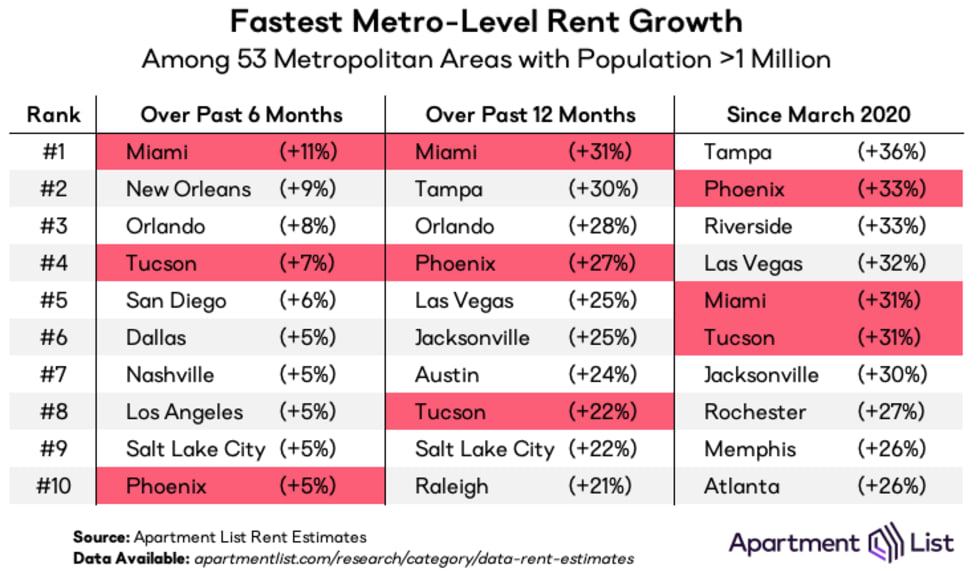
The Miami metro has seen the nation’s fastest growth over the past six months (+11 percent), more than tripling the growth rate of our national index over that period. The Miami metro also ranks #1 for year-over-year rent growth, and #5 for growth since March 2020. Phoenix and Tucson are the only other metros to land in the top 10 across all three of these time horizons. The Tampa metro has had the fastest rent growth over the course of the pandemic as a whole, with a staggering 36 percent increase. However, growth in Tampa has cooled slightly in recent months, with a more modest 3.9 percent increase since last August, roughly in line with the national average. Similarly, the Riverside, CA metro ranks #3 for growth since March 2020, but a relatively large share of that growth occurred in 2020, and Riverside has fallen out of the top ten over the past year. On the other hand, we’ve also seen some metros heating up in recent months which had not been among the hottest markets in the earlier phases of the pandemic – the New Orleans, San Diego, Dallas, Nashville, and Los Angeles metros each appear in the top ten in only the six-month column.
Only the San Francisco Bay Area still lags pre-pandemic rent levels
At the other end of the spectrum, a number of markets have seen much more modest rent growth since the start of the pandemic. These are generally a mix of pricey coastal metros, where rents fell sharply in 2020 followed by a rebound last year, and Rust Belt metros, where growth has consistently been sluggish compared to the national average. The table below is analogous to the one above, but shows the metros where rent growth has been slowest:
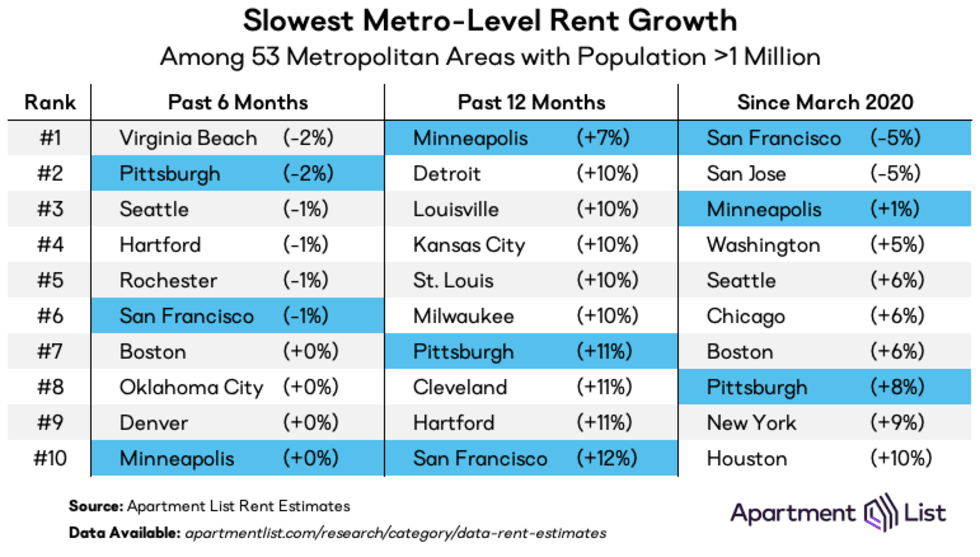
In the San Francisco metro, rents are still 5 percent lower than they were in March 2020, and the neighboring San Jose metro has seen a decline of roughly the same magnitude. Notably, these are the only metros where the median rent is still below pre-pandemic levels. The cities of Minneapolis, Washington, D.C., and Seattle are still slightly trailing pre-pandemic rents, but in these markets, the discounts do not extend metro-wide. The San Francisco, Minneapolis, and Pittsburgh metros are the only ones which appear in all three columns. Minneapolis has seen the slowest rent growth over the past year, but its 7 percent increase would have been considered substantial in a typical pre-pandemic year. For comparison, over the course of 2019, just one large metro experienced rent growth above 7 percent.
Conclusion
After a brief seasonal reprieve, rents are back on the rise, with a 0.6 percent increase in February. Although rent growth has cooled from last summer’s peak, it continues to exceed pre-pandemic trends. While the apartment market has shown some signs of easing, our vacancy index still sits at 4.5 percent, well below the 6 percent pre-pandemic norm. As we enter the spring and summer months, rental activity is likely to pick up, and rent growth is likely to accelerate. Despite a recent cool-down, many American renters are likely to remain burdened throughout 2022 by historically high housing costs.
To learn more about the data behind this article and what Apartment List has to offer, visit https://www.apartmentlist.com/.


Sign up to receive our stories in your inbox.
Data is changing the speed of business. Investors, Corporations, and Governments are buying new, differentiated data to gain visibility make better decisions. Don't fall behind. Let us help.


Sign up to receive our stories in your inbox.
Data is changing the speed of business. Investors, Corporations, and Governments are buying new, differentiated data to gain visibility make better decisions. Don't fall behind. Let us help.