What do you think of when you hear the word “Alternative Data”? A neat definition would be non-traditional data sources that can provide indications as to a firm’s future performance other than conventional sources such as corporate filings and analyst predictions. Or to borrow from the Alternative Management Association (AIMA, 2020), “alternative data comes from unconventional information, mostly in an unstructured form, is not broadly distributed within the industry and is being used to deliver both investment alpha and operational alpha”.
Think credit card transaction data, mobile device data, web traffic, ESG data, media sentiment, weather data, social media sentiment, IoT sensor data. The list goes on and is constantly expanding with the advances in technology. What is important to realize is that investors are increasingly turning towards using alternative data to gain an edge in generating alpha while corporations are leveraging alternative data to better assist in their strategic decision making.
Market Size and Users of Alternative Data
The global alternative data market is expected to grow from $2.21 billion in 2021 to $3.23 billion in 2022 at a compound annual growth rate (CAGR) of 46.5%. The market is expected to reach $13.91 billion in 2026 at a CAGR of 44% (The Business Research Company). According to the AIMA, the number of alternative data providers today is 20 times larger than it was 30 years ago. They estimate that by 2024, there will be more than 5,000 different alternative datasets.1
This skyrocketing growth trend can be largely explained by the growing interest in stock market trading and the quest to access more accurate and speedier insights to outperform the market. This is particularly the case for hedge funds and investment banks who are the top users of alternative data. An AIMA and Bank of Merrill Lynch study reveals that roughly half of all investment firms now embrace alternative data. This number will only continue to grow as more firms continue to seek an innovative and competitive edge by accessing an informational edge over the rest of the market.
How Many Alternative Datasets Does the Average Hedge Fund Use?
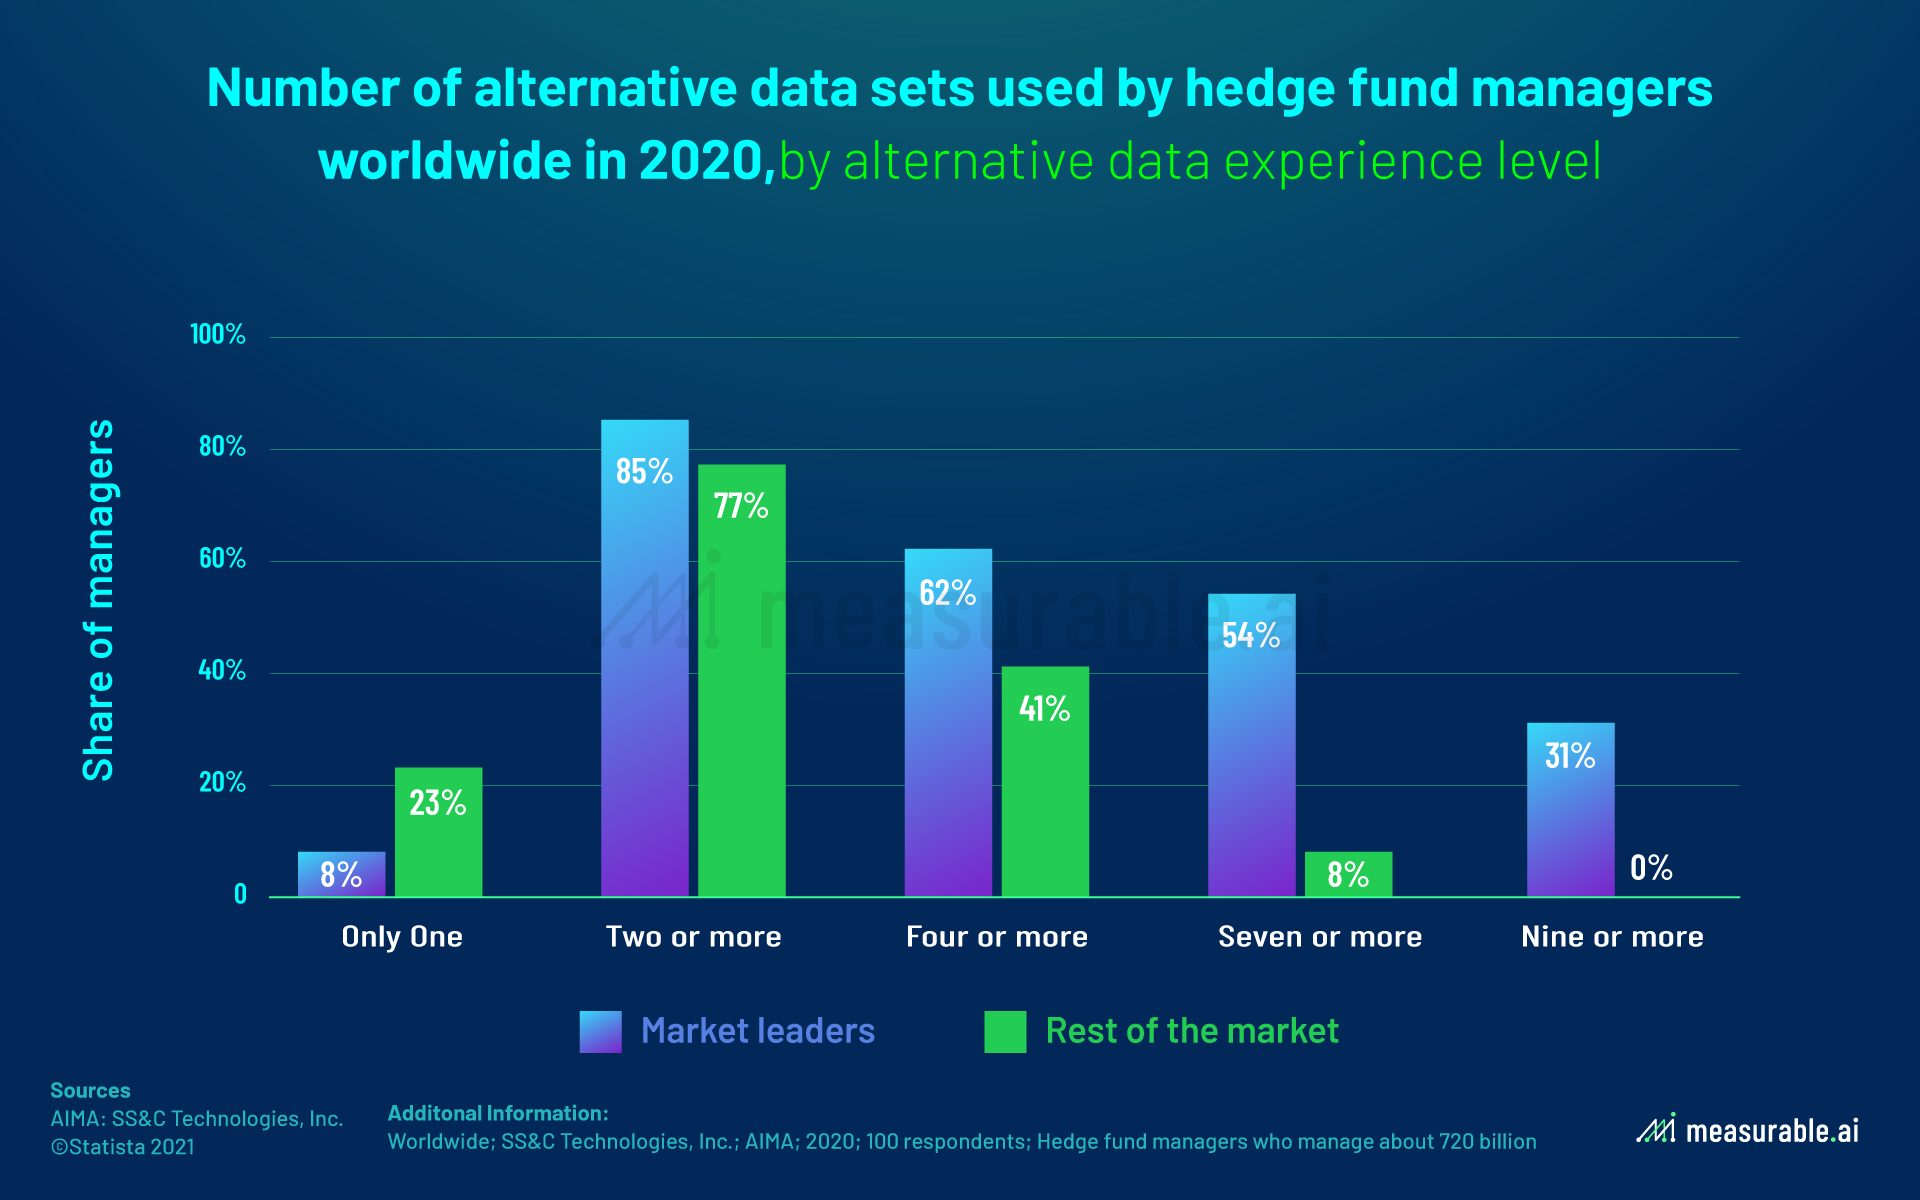
In 2020, more than 50%of hedge fund managers classified as alternative data market leaders used seven or more alternative data sets globally, while only 8% of the rest of the market used at least seven alternative data sets. Most hedge funds utilized two or more alternative datasets with 85% of market leaders and 77% of the rest of the market doing this.
Main Use Cases of Alternative Datasets by Hedge Funds
According to a study conducted by Greenwich Associates, nearly 30% of quantitative funds attribute at least 20% of their alpha to alternative data. Furthermore, 42% of all asset managers reported they believed the alpha edge they achieved by using alternative data lasted for at least four years.
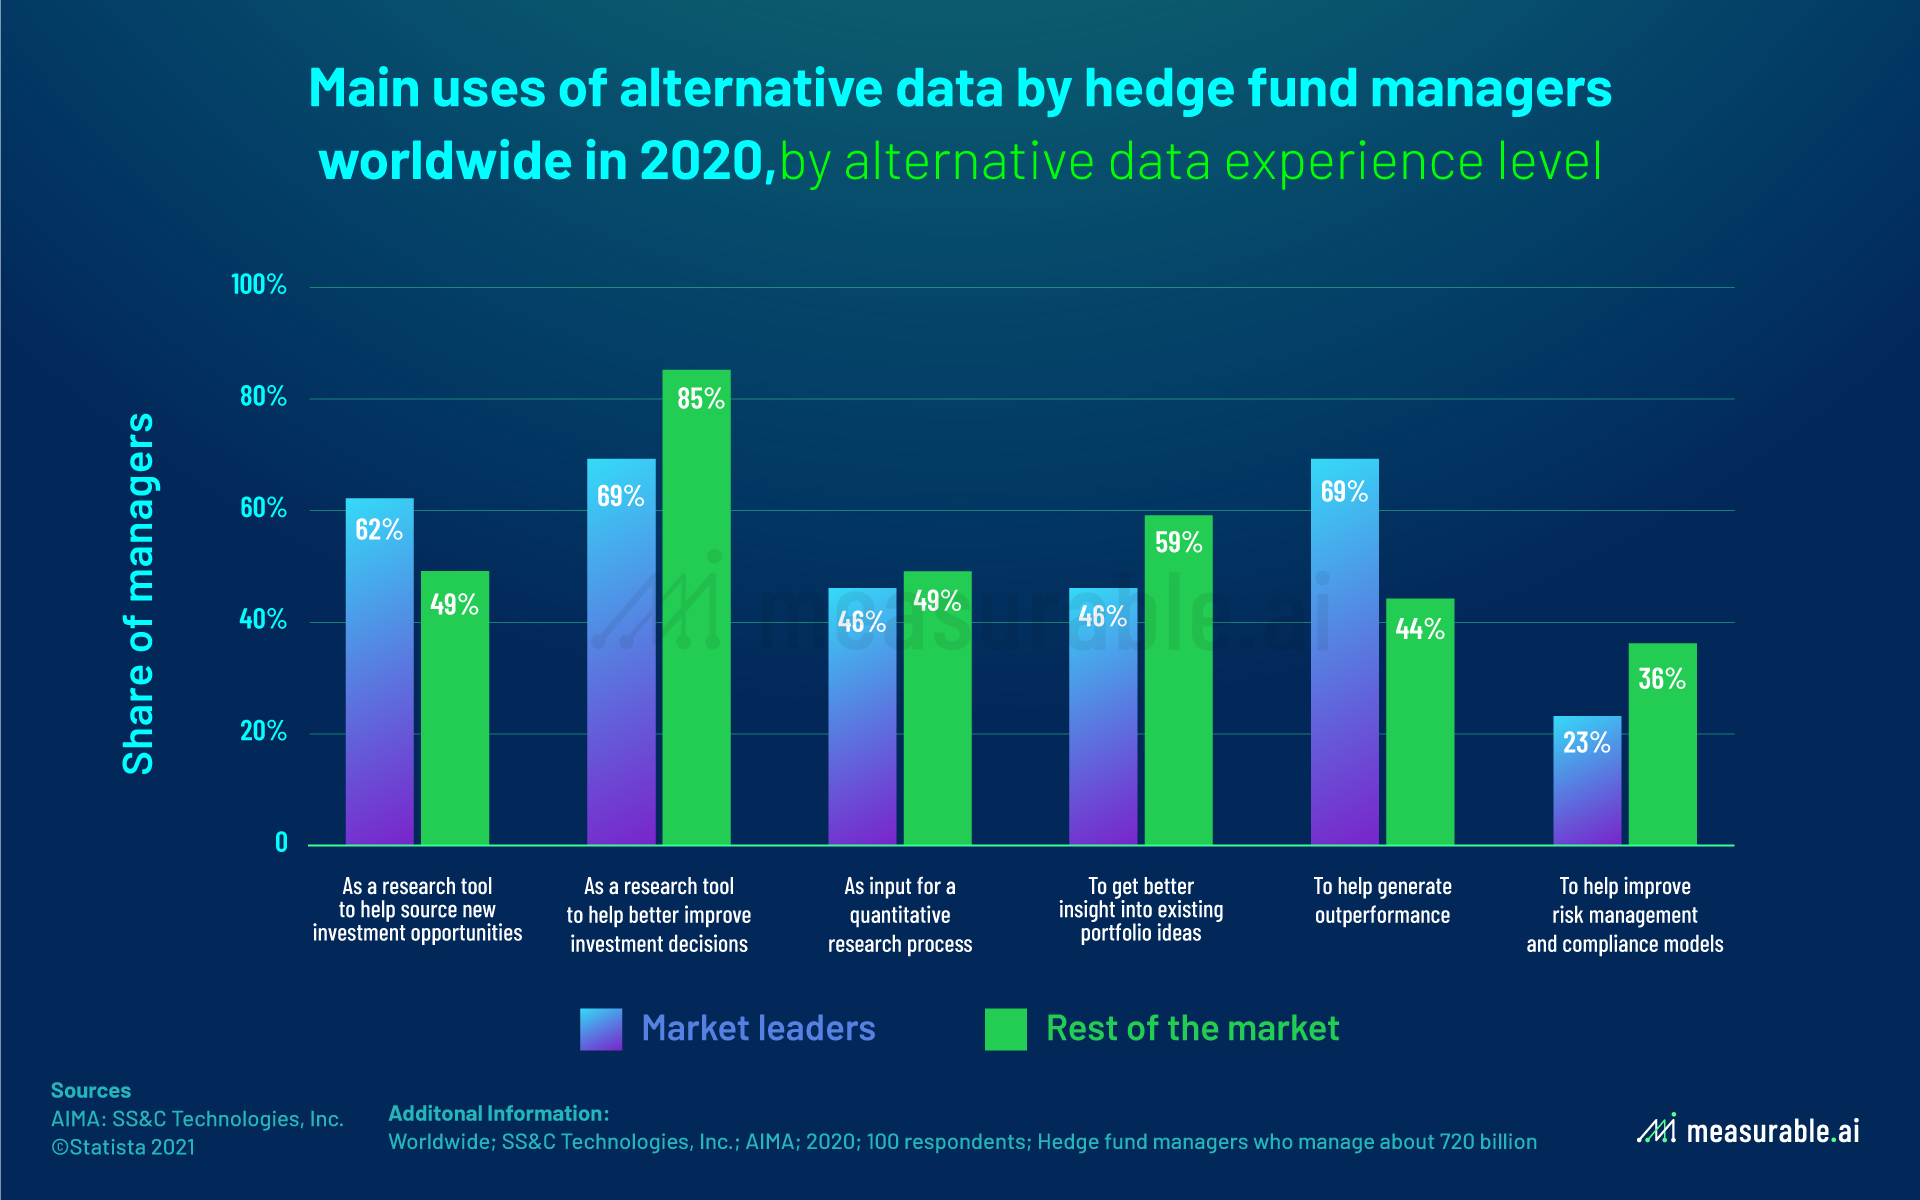
This finding is supplemented by AIMA who revealed that 69% of hedge funds classified as market leaders in alternative data utilize alternative data sources to improve investment decisions and to generate alpha. Scouting for unique data sources and investment strategies that other companies do not have access to is essential for gaining a competitive advantage. On the other hand, the emergence of a pandemic has added to the complexity of this issue and necessitated the need for timely, reliable, and quality data. To a lesser extent, hedge funds may also use alternative data to help improve risk management and compliance models.
What Are The Most Popular Categories of Alternative Data?
Some of the most popular categories of alternative data utilized by buy side investment firms and corporations are listed below.
Web Crawled Data
“From companies’ internal analytics to satellite photos, scraped website data to tracking consumers’ locations, hedge funds and institutional investors are always looking for creative ways to get the edge in investments.”
~ CNBC reporter Eric Chemi
Web crawling is when readily available information online is downloaded. Crawling is used for data extraction from search engines and e-commerce websites and afterward, unnecessary information is filtered out and only the required details are scraped. Web-crawled data can be obtained in different ways, such as crawling through emails, news, images, and social media.
About 2.5 quintillion bytes of data is generated everyday on the web. Tapping into this information pool equips hedge fund managers with valuable insights they need to make smarter and more lucrative investment decisions.
Meanwhile, for organizations, data scraping has become the ultimate tool for business development. According to Mckinsey Global Institute, data-driven organizations are 23 times more likely to acquire customers, 6 times more likely to retain customers, and 19 times more likely to be profitable. Leveraging this data enables enterprises to make more informed decisions and improve customer experience. It is proven that data-driven businesses outperform their peers with the insights they derive. By tracking consumer interaction and gaining an in-depth understanding of their behaviors, companies can improve their customer experience. This, in turn, will prolong the lifetime value of the client and thereby increase brand loyalty.
You may be wondering how hedge funds make money off trades by web scraping. Consider twitter. Investors often use web scraping to quickly analyze millions of tweets to determine which stocks to buy and sell.
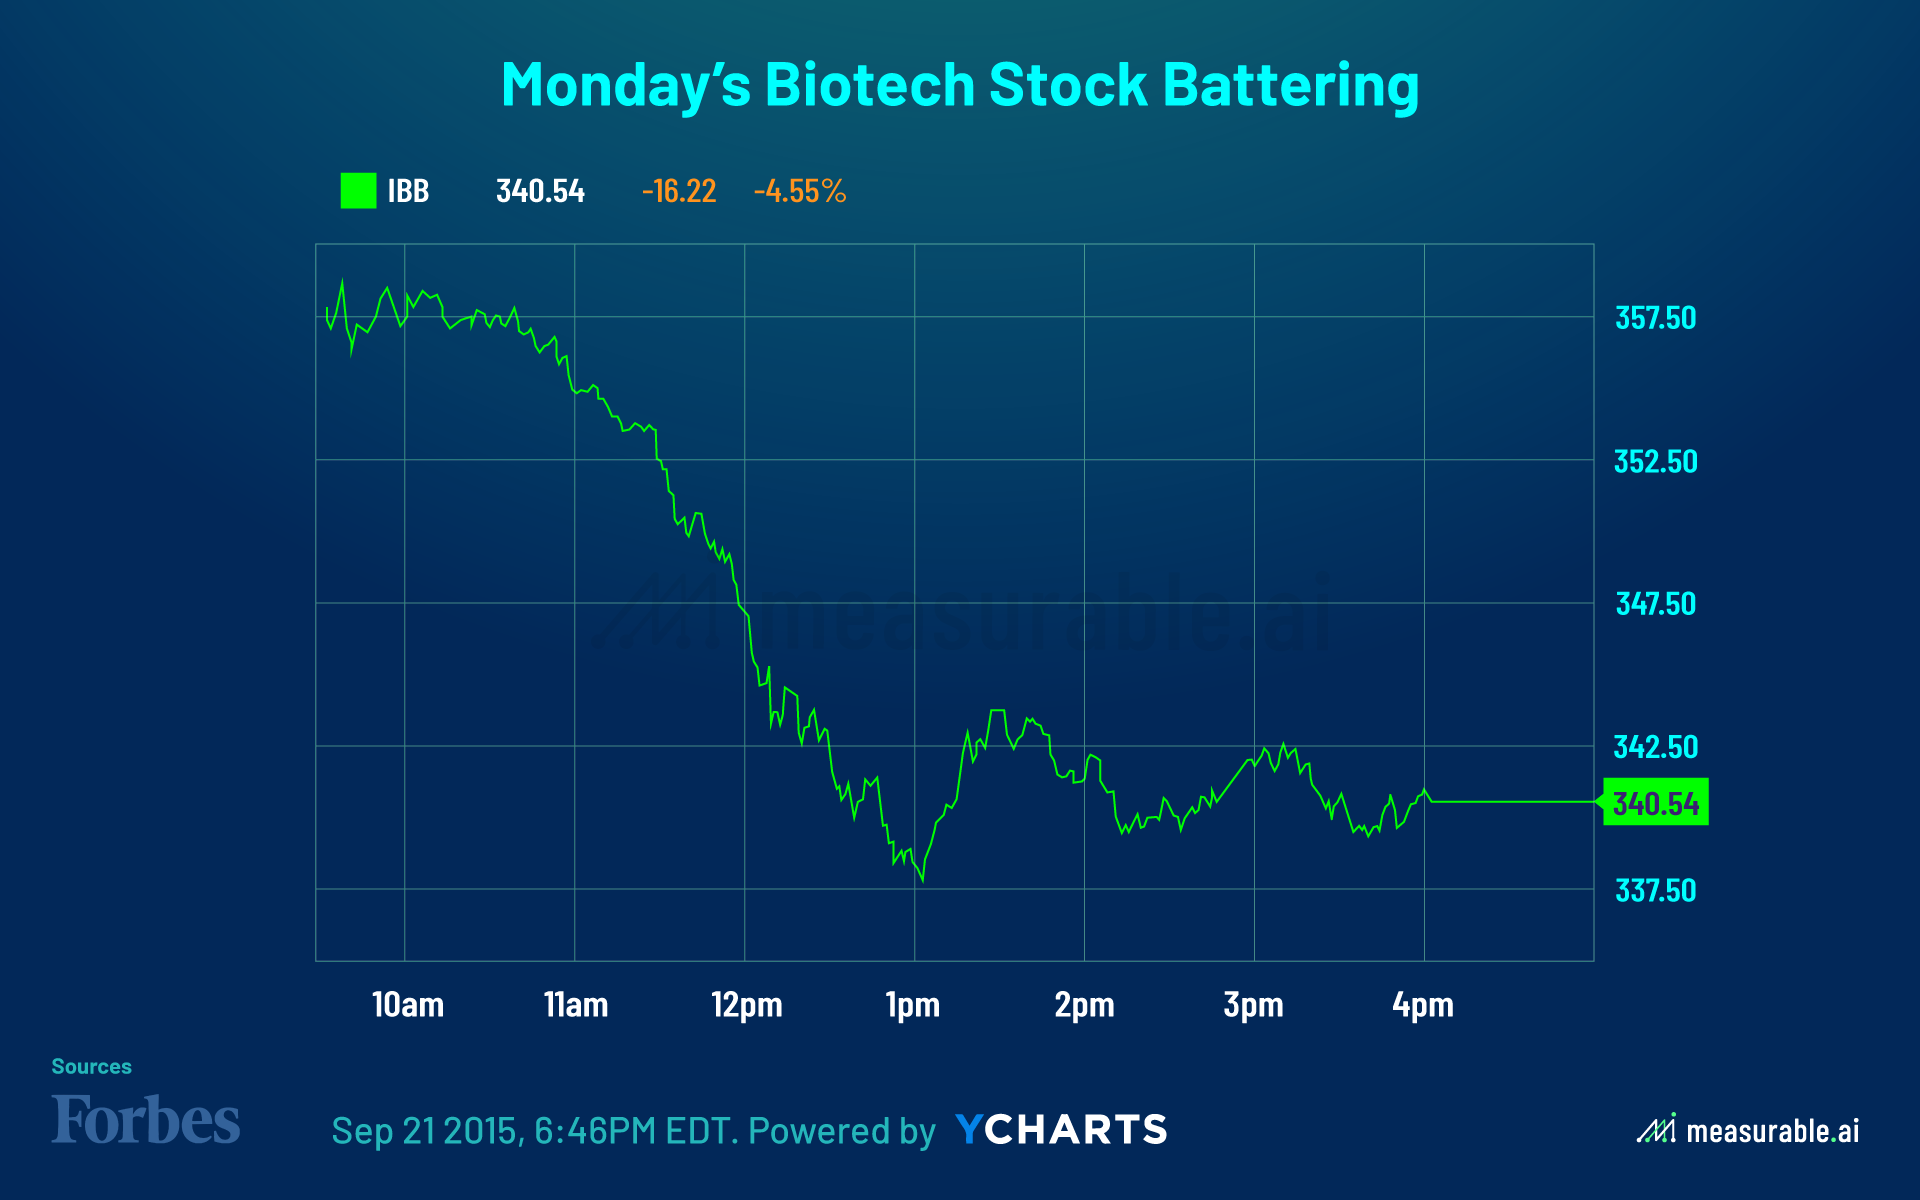
In 2015, a 21-word tweet from Hilary Clinton ripping a drug company’s pricing policy sparked a sharp sell-off for the group. The iShares Nasdaq Biotechnology ETF (IBB) dropped more than 4%, closing with a 4.5% loss and only a small subset of its components trading in positive territory.
The same thing happened when Hilary criticized private pensions in a single tweet – also in 2015 – which resulted in the stocks of two top corrections companies dropping by 6% and 4% respectively.
It is therefore not surprising to imagine that investment firms are willing to invest a considerable size of money to access this type of data. According to Business Insider, hedge funds spend roughly US$2 billion on web scraping software to gain an edge in the markets.
Web Traffic and App Data
Any company with an online presence will have web traffic data. Web traffic data include traffic metrics such as number of unique visitors to a website to number of visits to the website. This allows users of the data to understand if a particular website is growing and gaining traction, or if it is struggling to attract new users. More on why web traffic data is an ideal alternative dataset to subscribe to can be read in this article by Similarweb.
In addition to web traffic data, there can be engagement metrics such as time spent on a particular website or page, and how many sessions did each visitor initiate. Such metrics enable end users to evaluate the stickiness of the user base and perhaps change the UI.UX or copy of the website if the bounce rate is high.
Beyond web traffic data is app data which often complements a website’s offering. Metrics include both quantitative and qualitative data, from the number of downloads an app has, to how many times per day a user opens it on average. Popular use cases for app data could be for gaming, food delivery and streaming services. Combining both web and app data will paint a full digital picture of any business.
Social Sentiment and Product Reviews
A social media sentiment analysis tells you how people feel about your brand online. Given that emotions are the number one factor that drives purchasing decisions, with so many consumers sharing their thoughts and feelings on social media, it pays for brands to have a pulse on how their products make people feel. Rather than a simple count of mentions or comments, sentiment analysis considers emotions and opinions. It involves collecting and analyzing information in the posts people share about the brand on social media.
Product reviews can help firms to decide whether to buy, sell or hold a stock. For example, Thinknum’s media outlet, the Business of Business, noted earlier this year that, before Peloton’s stock tumbled in the wake of a treadmill recall, the number of negative online reviews that included words such as “terrible”, “awful” etc. had shot up threefold – a clear signal to sell.
Geolocation Data
With the increasing worldwide adoption of smartphones and internet of things, geolocation data has enjoyed considerable growth over the years which will only increase as time goes on. The global low-power geolocation market is projected to grow from $24.88 billion in 2020 to $64.80 billion by 2025, at a CAGR of 21.10% from 2020 to 2025.
Geolocation is a technology that uses data acquired from an internet-connected device (e.g., smartphone, computer, fitness tracker) to identify an individual’s geographical location, both longitudinal and latitudinal. Geolocation data can be collected by GPS, wifi-networks, cell towers and bluetooth.
With geolocation data, one can clearly identify an individual’s physical address, including their exact longitude and latitude at a point in time. Companies can use geolocation data to track an individual’s movements to determine patterns and behaviors. Location data for an individual and the time he/she spent at each location can be cross-referenced, thereby revealing where an individual lives, where they work, their daily schedules, which stores they frequent, their regional preferences, and even vacation times. Scary right?
Given how geolocation information can reveal such intimate personal details about individuals, it is no surprise that the secondary location market is becoming a lucrative business, with the industry expected to have reached $350 million in 2020. For example, companies can purchase this anonymized location data or individual profiles for business purposes, such as for targeted advertising.
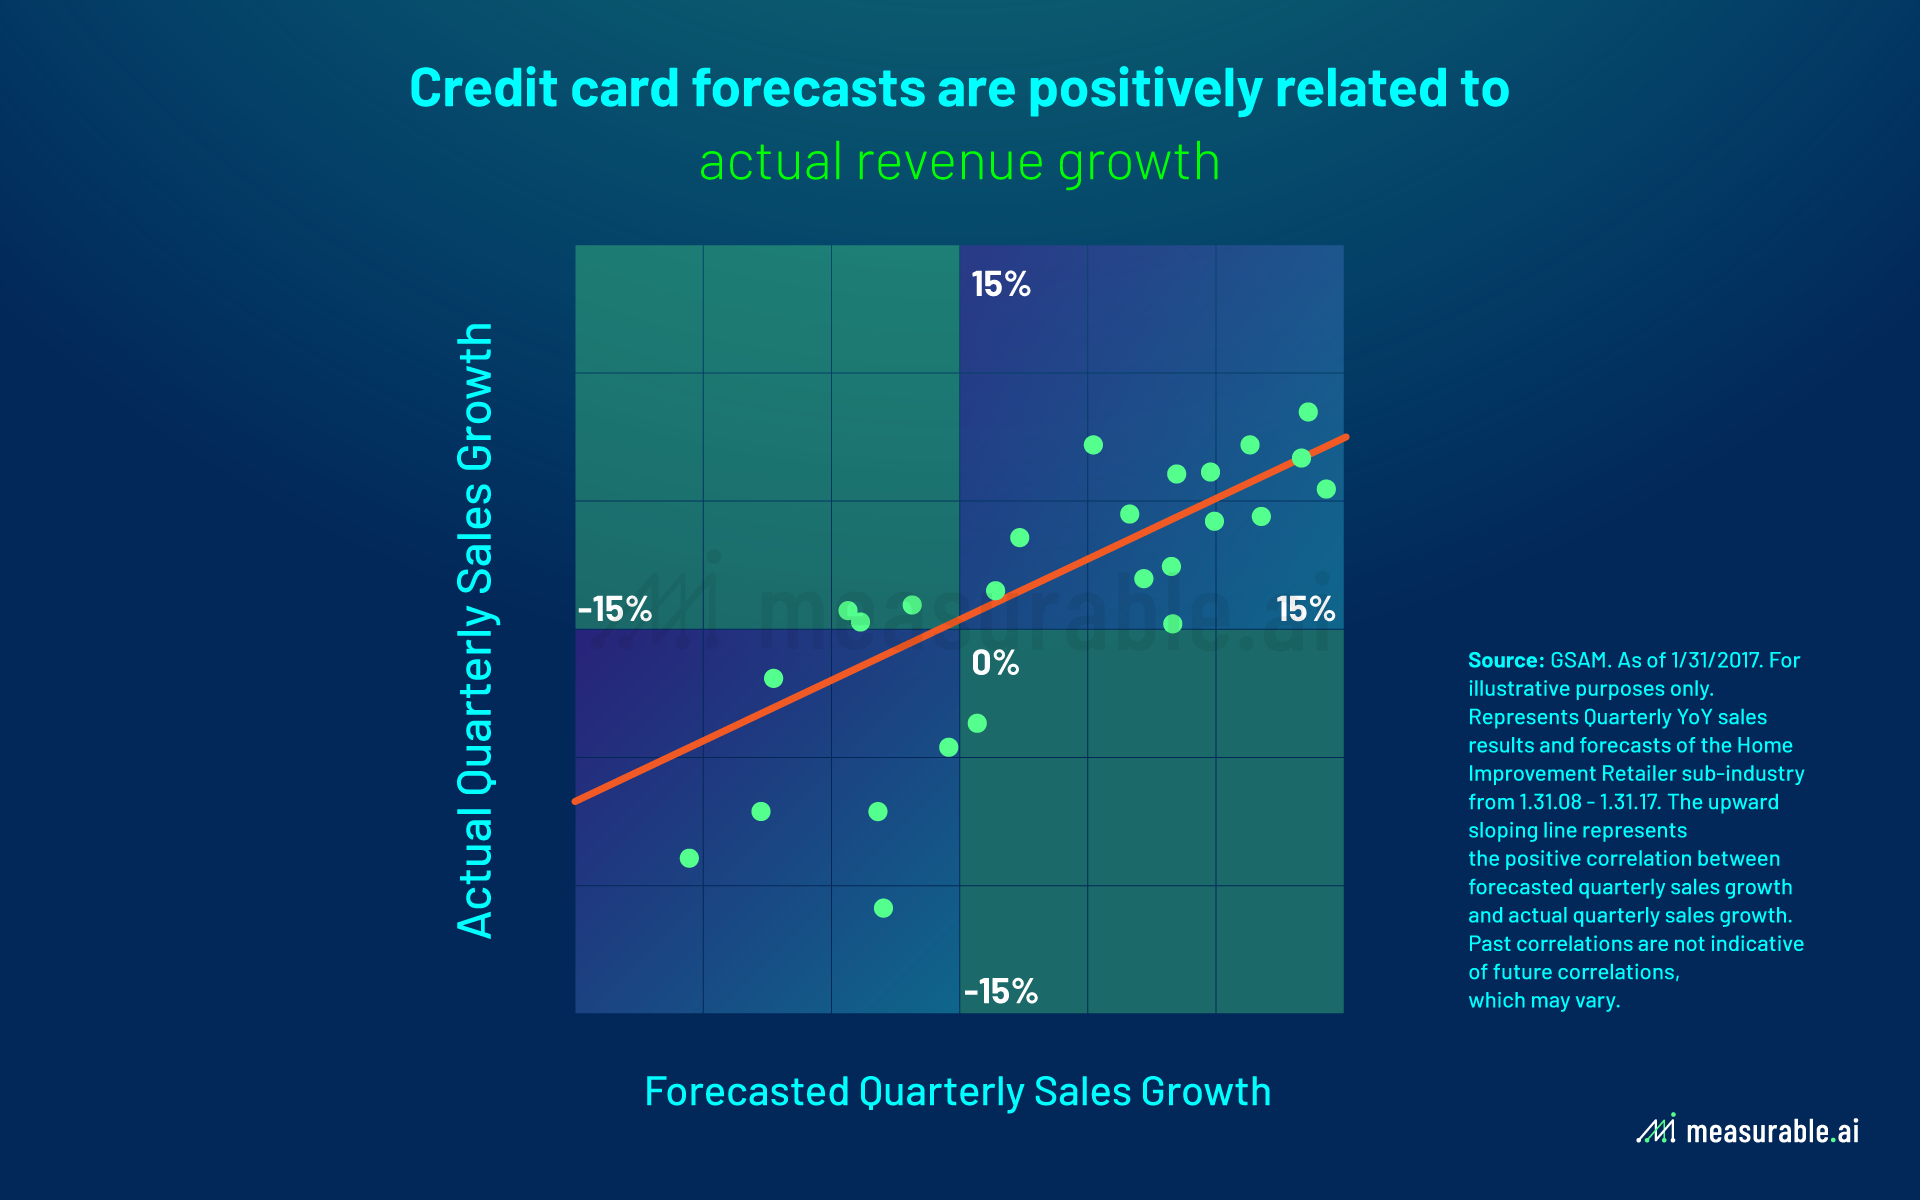
Credit Card Data
Credit card data is currently the highest grossing category in the alternative data space and continues to grow in popularity. This data is considered highly accurate when the transaction panel is large (over 3 million) and covers a consistent user sample.
Credit card forecasts are positively related to actual revenue growth and given credit card data is provided monthly with a six day lag, it helps forecast earnings growth more quickly than traditional methods. GSAM notes that companies with greater credit card sales growth tend to exhibit stronger YoY sales growth in the following year. As such, it is not surprising to see how credit card data is fundamental to financial analysis for buy side firms and investment banks. Understanding how consumers spend their money is one of the strongest indicators of economic performance.
Email Data
Emails contain a tonne of transactional information that can be extracted to derive useful insights. The data is accurate and is often used for retail revenue tracking and to understand customer purchasing behavior better. However, panels are typically smaller than credit/debit card panels and can be subject to biases depending on the nature of the email receipt collection (often via an opt-in email or rewards app).
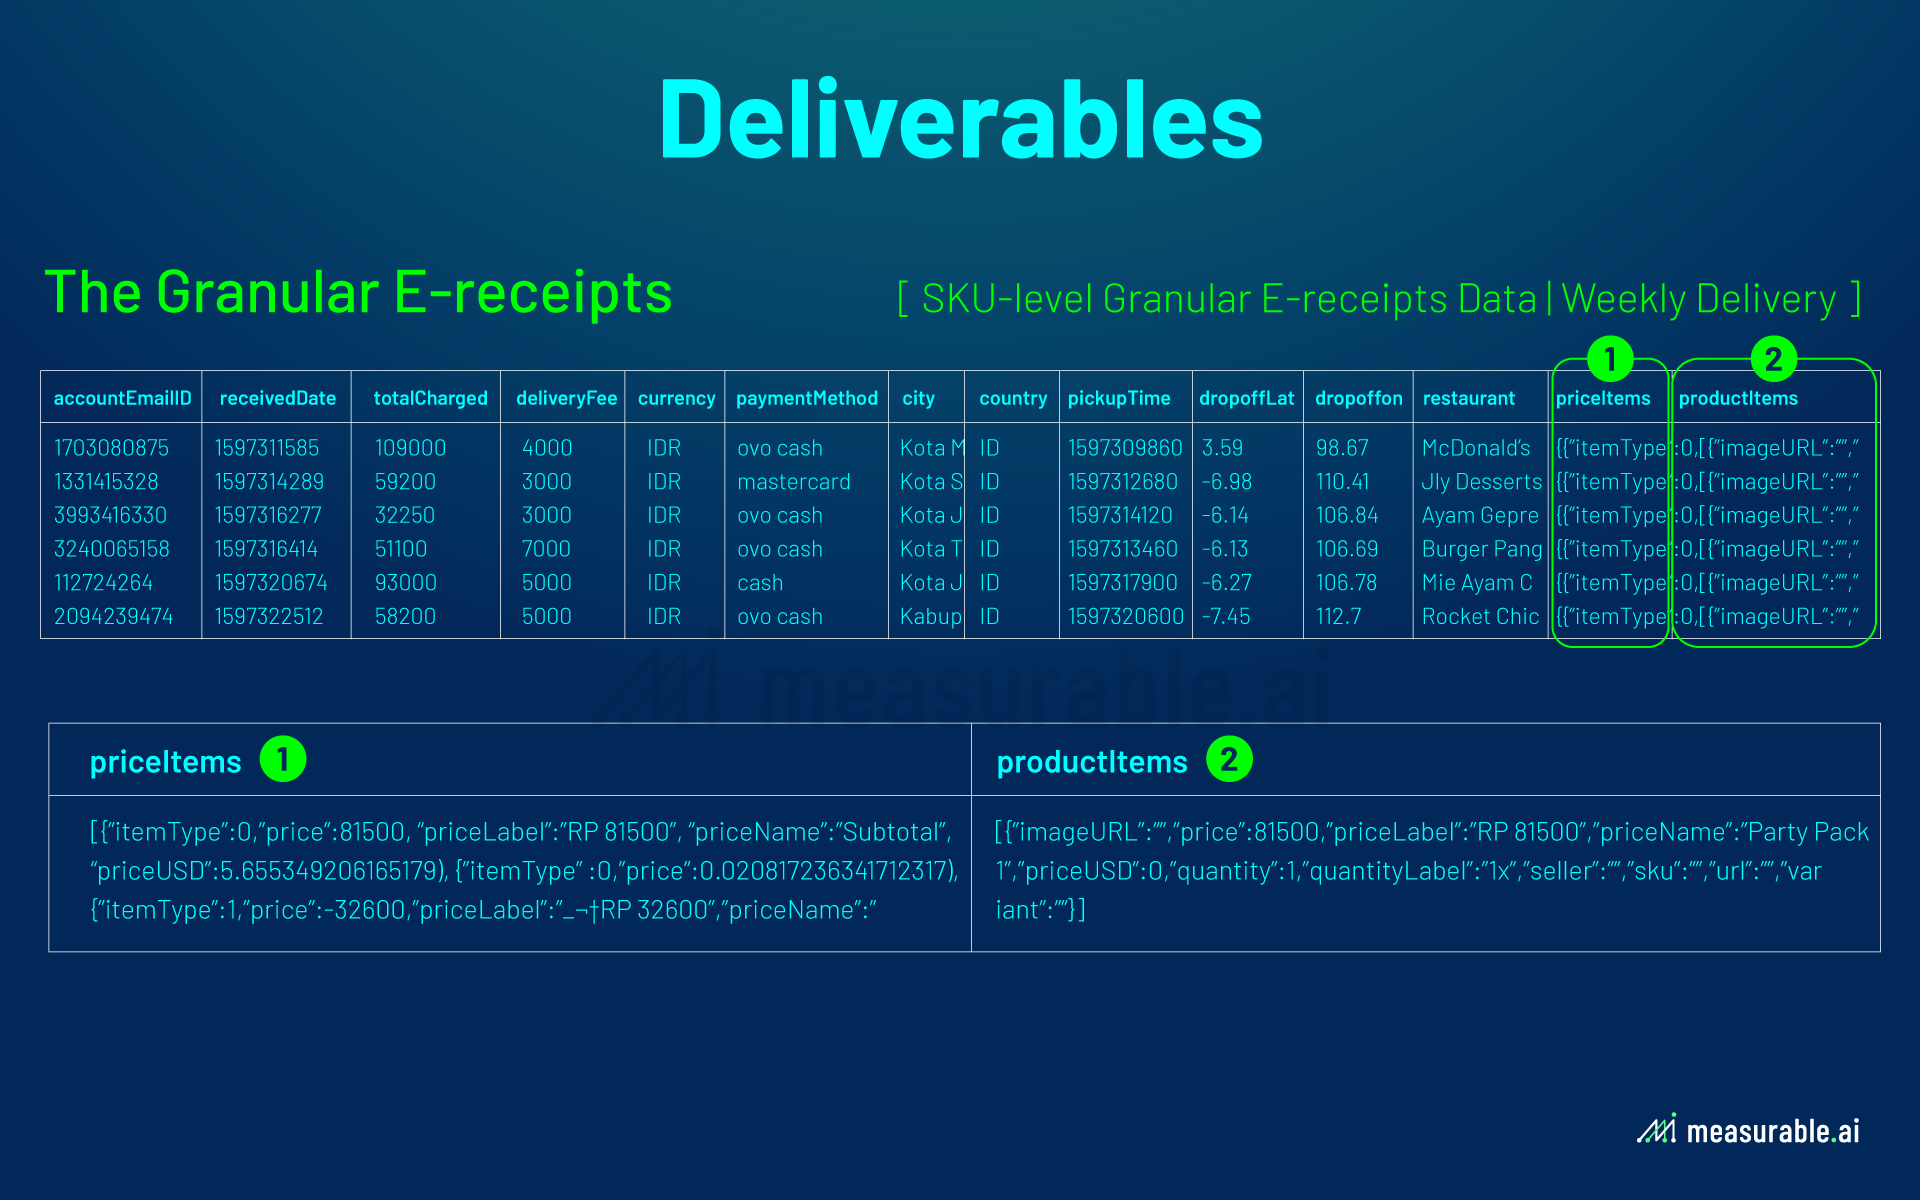
At Measurable AI, we specialize in granular email datasets and now own the biggest email receipt dataset for the emerging markets.
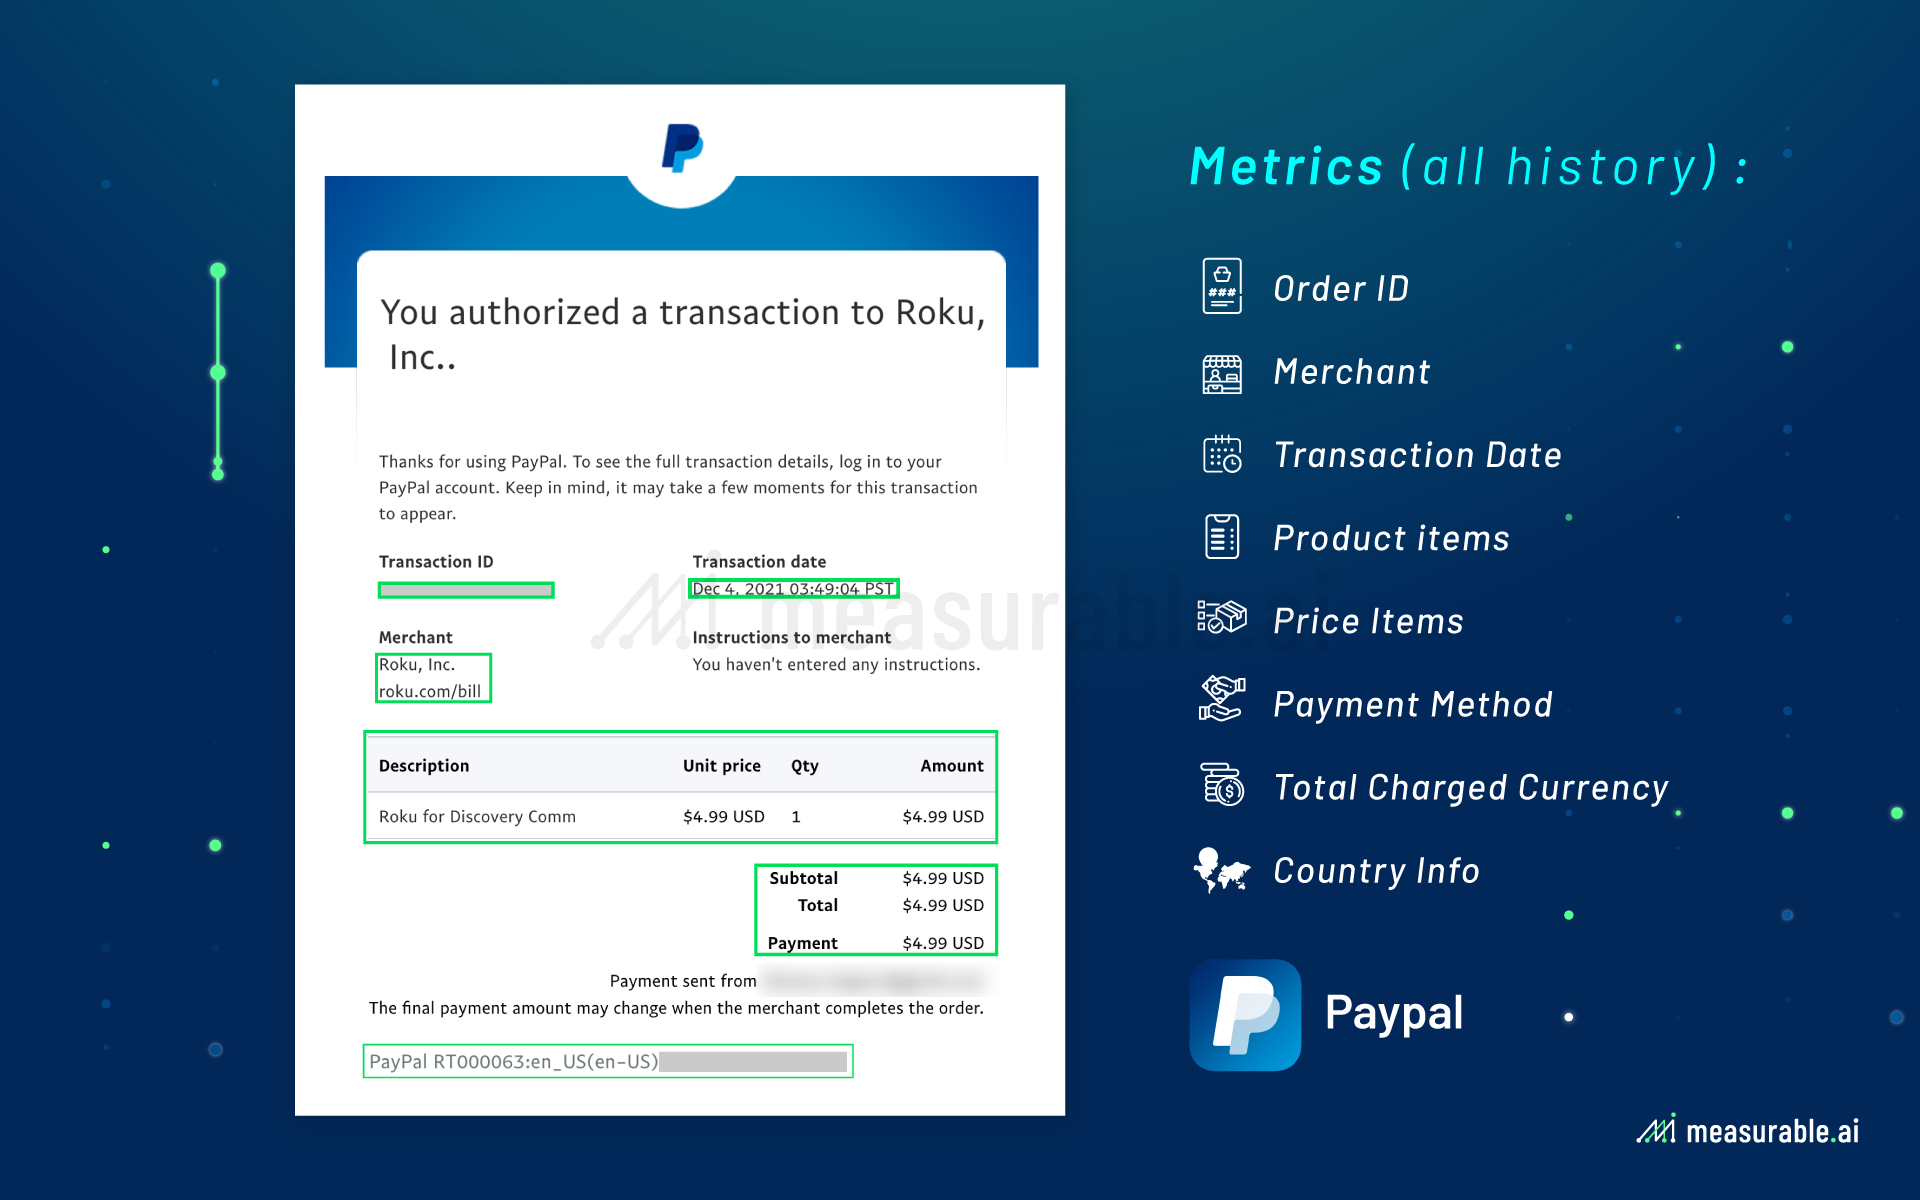
Our data has been backtested to ensure its accuracy with actual reported revenues. Moreover, unlike credit card data, another added advantage of email data is its availability in real-time and its level of granularity offered (including SKU intel, geolocation data, items ordered, discounts applied, etc.).
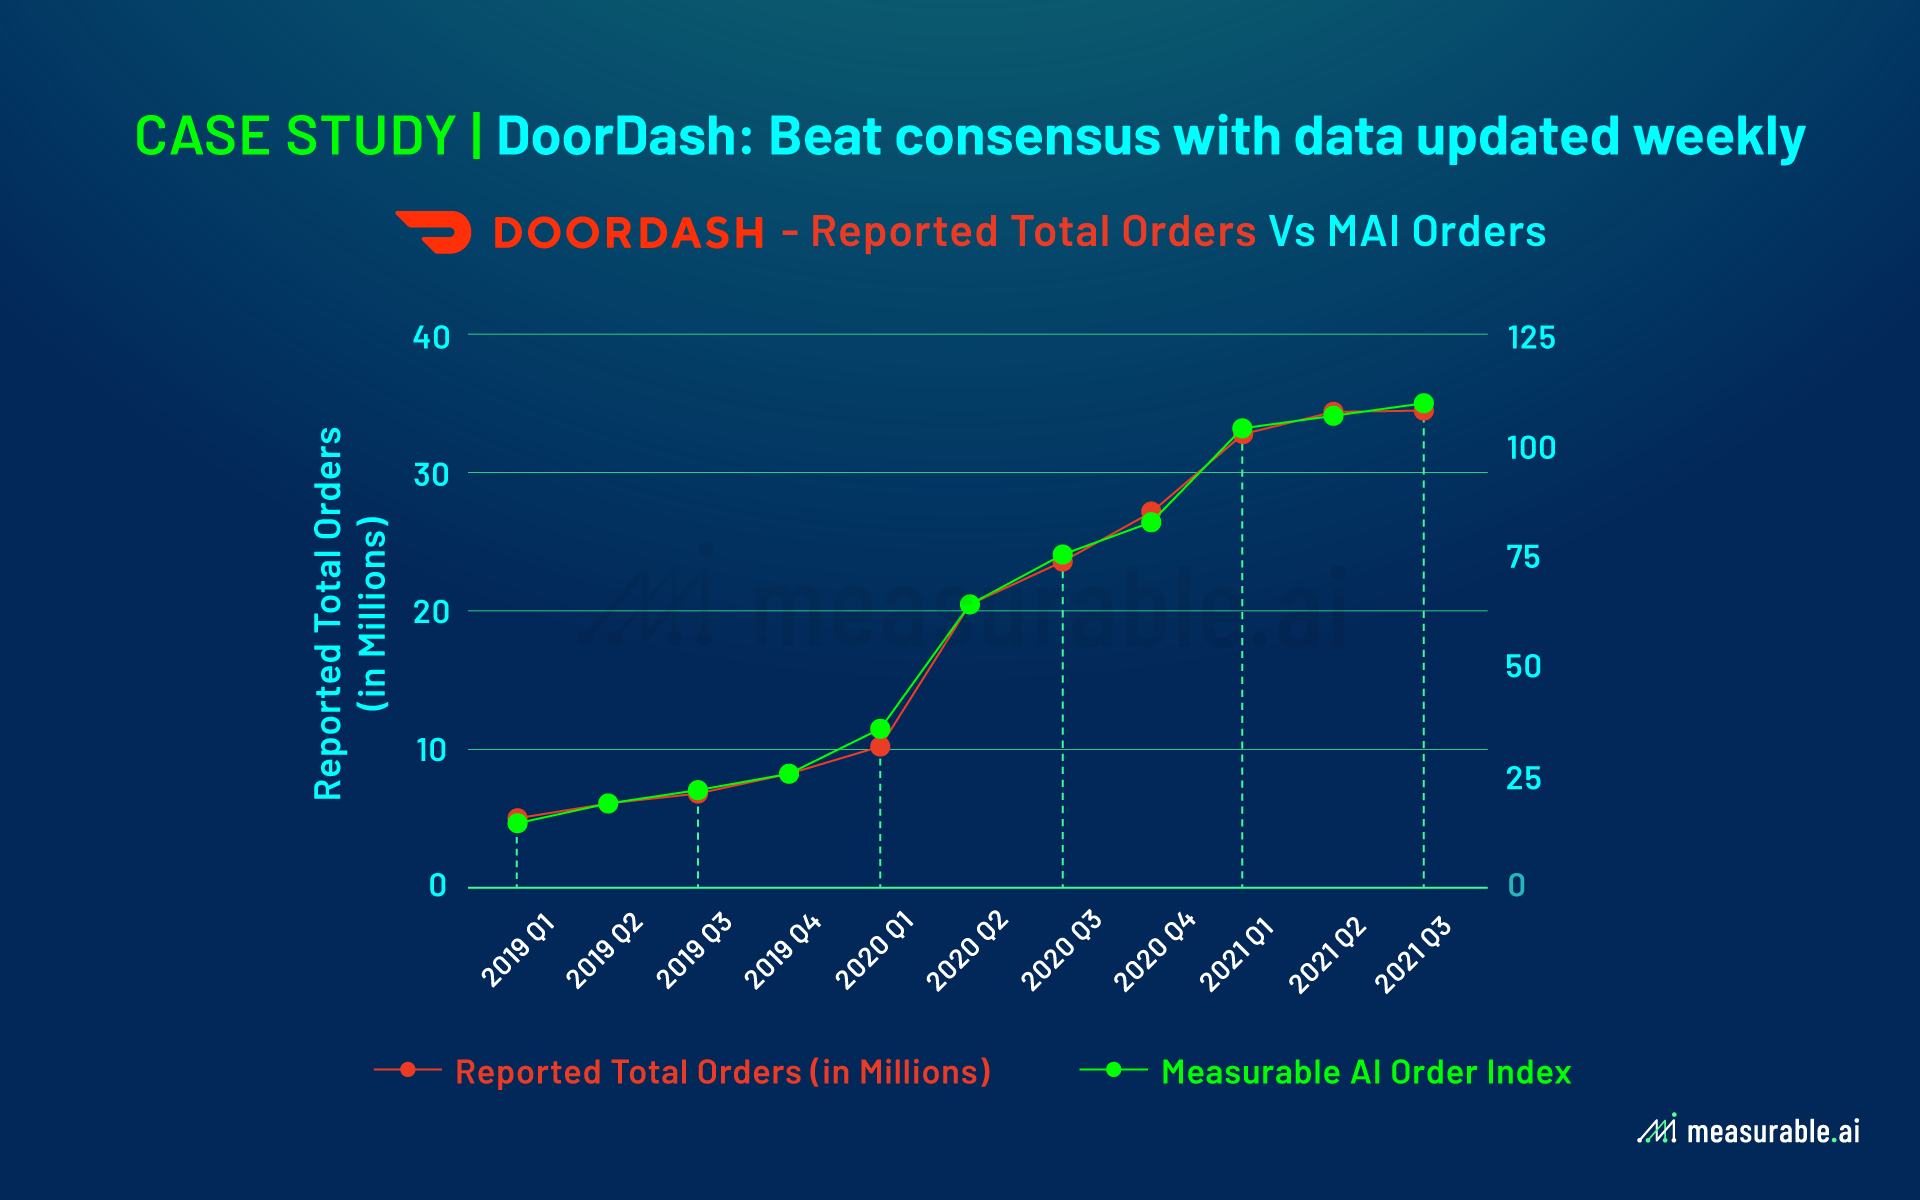
While transactional email receipt data often exhibits a strong correlation to sales figures, non-transactional email activity data is also valuable to better guide brands with data insights to improve and better target their marketing campaigns and monitor interest trends amongst their users.
Raw vs. Aggregated Data
Alternative data can either come in aggregated form or as a straight data feed through APIs.
Data aggregation is a process where raw data is gathered and expressed in the form of a summary for statistical analysis. Data aggregation may be done manually or through specialized software called automated data aggregation. After the data is aggregated and written to view or report, you can analyze the aggregated data to gain useful insights about particular resources or resource groups. Aggregated data is structured and less expensive plus easier to work with. On the flip side, they have less alpha potential. Aggregated datasets may also suffer from selection bias, which means they aren’t truly representative.
Raw data feed, on the other hand, is considered much more valuable and allows for more ‘data digging’. Raw data is a term for data collected from a source. It has not been subjected to processing or any other manipulation, and often is referred to as primary data.


Sign up to receive our stories in your inbox.
Data is changing the speed of business. Investors, Corporations, and Governments are buying new, differentiated data to gain visibility make better decisions. Don't fall behind. Let us help.


Sign up to receive our stories in your inbox.
Data is changing the speed of business. Investors, Corporations, and Governments are buying new, differentiated data to gain visibility make better decisions. Don't fall behind. Let us help.