Overall HPI Growth
National home prices increased 20.9% year over year in March 2022, according to the latest CoreLogic Home Price Index (HPI®) Report . The March 2022 HPI gain was up from the March 2021 gain of 11.1% and was the highest 12-month growth in the U.S. index since the series began in 1976. While home price growth is expected to slow over the next 12 months, the CoreLogic HPI Forecast shows that the year-over-year change in the HPI will remain in the double digits for the rest of this year. The non-seasonally adjusted month-to-month index was up 3.3%, which was the largest monthly increase in the HPI for the month of March. Over the 46-year history of the index the monthly index changes from February to March averaged 0.6%.
HPI Growth by Price and Property Type Tiers
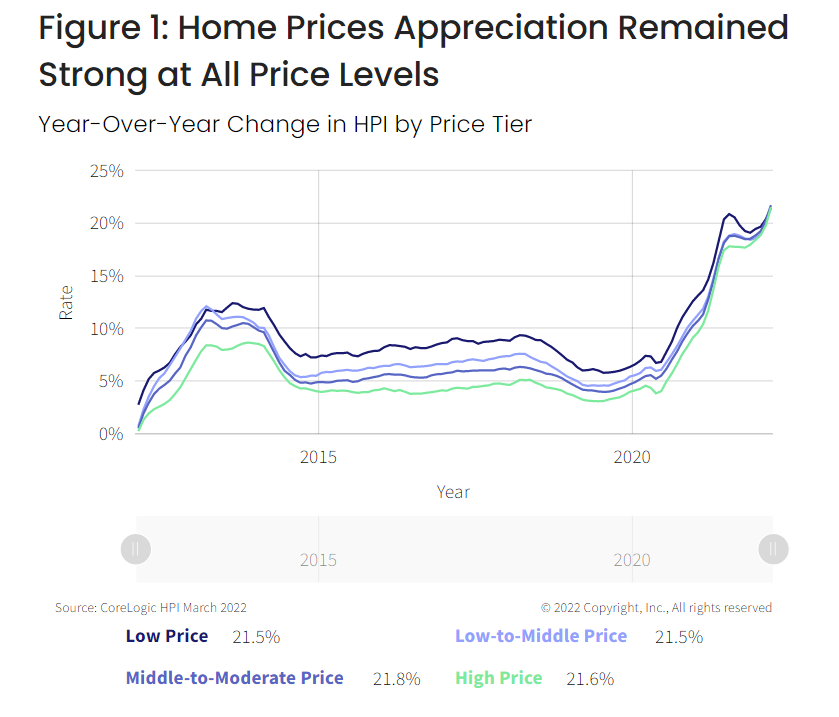
CoreLogic analyzes four individual home-price tiers that are calculated relative to the median national home sale price. Home price growth accelerated for all four price tiers in March. All price tiers increased between 21.5% and 21.8% in March 2022, which was the highest appreciation for the price tiers in the history of the index.
CoreLogic also provides the HPI separately for detached — or freestanding — properties and attached -properties (such as condos or townhouses). Appreciation for detached properties (22%) was 1.3 times that of attached properties (17.3%) in March. The gap in HPI growth between detached and attached properties widened after the pandemic began as remote work allowed employees to buy homes farther from their office and in areas where property prices and population density are lower and detached housing is more common. However, as prices become out of reach for some and buyers seek less expensive properties, the gap between detached and attached price appreciation has narrowed.
Figure 1: Home Prices Appreciation Remained Strong at All Price Levels
Year-Over-Year Change in HPI by Price Tier
State- and Metro-Level Results
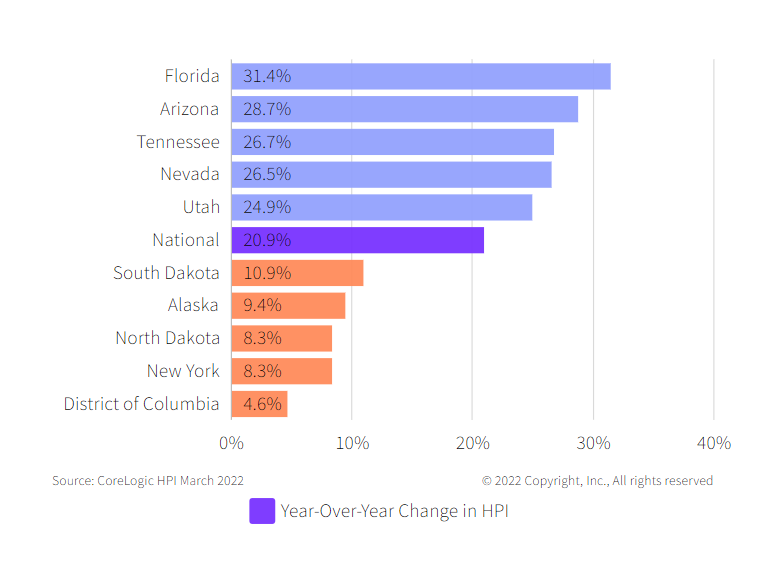
Figure 2 shows the year-over-year HPI growth in March 2022 for the five highest- and lowest-appreciating states. While all states showed annual increases in HPI in March, appreciation was strongest in Florida, with an increase of 31.4%, followed by Arizona (+28.7%) and Tennessee (+26.7%). At the low end, Washington, D.C., saw home prices increase 4.6%, and New York increased 8.3%. Population growth in some states added to homebuying demand in 2021, pushing up home prices. Arizona, Florida, Nevada and Utah were all in the top 10 for percentage increase in population growth in 2021 and Washington, D.C. and New York had the slowest population growth.
The surge in home price appreciation was felt across the country, with all but three states showing higher appreciation in March 2022 than in March 2021. Florida had the biggest acceleration in home price growth from March 2021 (+11%) to March 2022 (+31.4%). Connecticut, Idaho and Rhode Island saw a slowdown in annual appreciation.
Figure 2: Appreciation Was Strongest in the Sun Belt
States With the Highest and Lowest Year-Over-Year Change in HPI for February 2022
All metropolitan areas had year-over-year increases in home prices in February. Florida had seven metros in the top 10 for highest appreciation, led by Naples-Immokalee-Marco Island with an increase of 46.8% and followed by Cape Coral-Fort Myers at 42.8% and North Port-Sarasota-Bradenton at 39.9%. Odessa, Texas (+3.4%) and Hattiesburg, Miss. (+4.2) had the lowest appreciation.
U.S. home prices surged in March, increasing 20.9% year over year. Annual gains are projected to slow to around 6% by next March, due in part to rising mortgage rates and higher home prices hampering affordability for some home shoppers. Buyers who closed on a property in March had a good chance of locking in mortgage rates around 4% or slightly lower. By late April, rates had moved up to more than 5%, a jump of about 30% from the same time last year and a trend that might derail more prospective buyers.
To learn more about the data behind this article and what CoreLogic has to offer, visit https://www.corelogic.com/.


Sign up to receive our stories in your inbox.
Data is changing the speed of business. Investors, Corporations, and Governments are buying new, differentiated data to gain visibility make better decisions. Don't fall behind. Let us help.


Sign up to receive our stories in your inbox.
Data is changing the speed of business. Investors, Corporations, and Governments are buying new, differentiated data to gain visibility make better decisions. Don't fall behind. Let us help.