
data.ai’s mobile gaming data illustrates the concentration of consumer spend. Where can small and mid-market publishers find success?
Market concentration helps to indicate if only a few games (or publishers) dominate the majority of the market. This highlights competitiveness. Using Game IQ subgenres and breaking down by geography, we were able to highlight areas of opportunity and disruption to answer:
Market Concentration: The Global Mobile Gaming Market Has a Very Long Tail
Although mobile gaming is home to some huge franchises, the global market as a whole is highly ‘democratic”. Our metrics reveal that, globally, the top 10 titles account for just 17% of market share in mobile game consumer spend in H1 2022. Meanwhile 65% of spend comes from the titles ranked #21 to #1000.
This suggests that mobile gaming remains as dynamic as ever, with plenty of room for fresh innovation and competition from established and new comers alike.
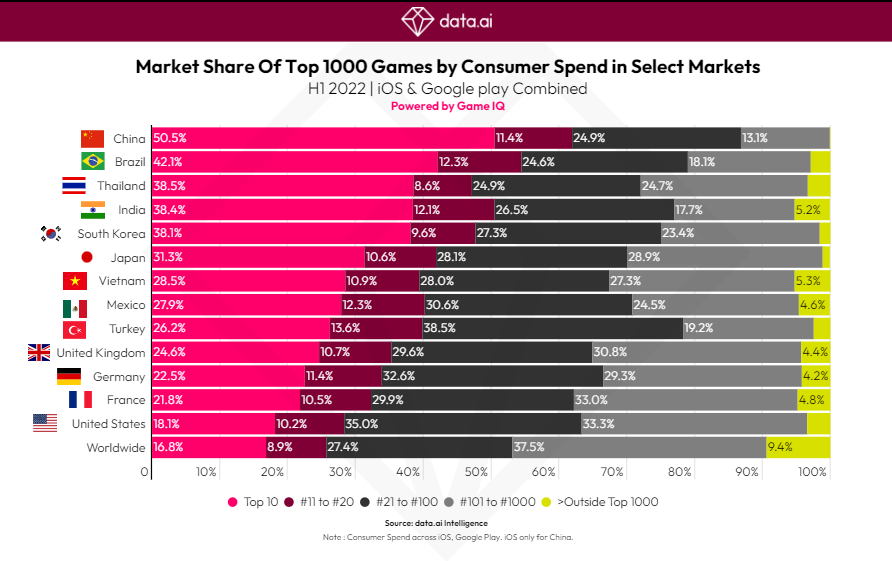
Regionally, our numbers show that Europe and the US skew this way too. In the latter, the top 10 games account for 18% of total consumer spend. This implies there is a substantial opportunity for titles outside the biggest hits to carve out market share.
It’s a different story in other regions. In Brazil 42% of spend goes on the top 10, while in China it’s 50%. In these markets, it’s especially important to use a tool like data.ai to understand the competitive landscape and identify your partner, build, buy strategy.
Let’s Get Granular: There’s a Huge Variation in Opportunity by Subgenre
How dominant is the top title among the top 20 subgenres by consumer spend? Are some niches more saturated than others? The answers varied wildly from category to category. It’s important to factor this type of view into any market strategy — as some genres will be more difficult to crack into than others.
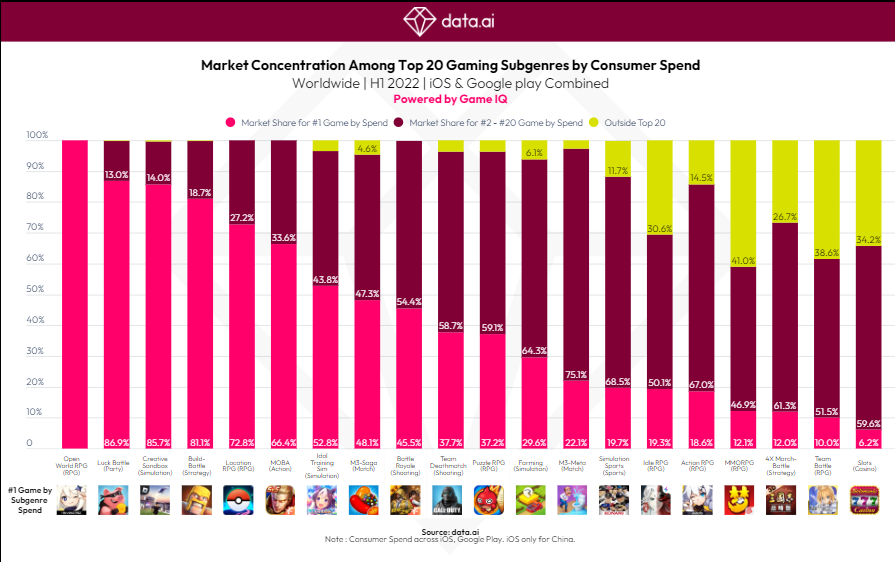
At the two extremes are Open World RPG and Slots. In the Open World RPG space there is only one major player: Genshin Impact. It accounts for 100% of consumer spend. The Luck Battle, Creative Sandbox and Build Battle subgenres are similarly top-heavy. At the other end, there’s Slots, where just 6% of consumer spend comes from the #1 title. This is a highly competitive subgenre.
It’s possible to be positive about both scenarios. A top-heavy market is there to be disrupted when the appeal of the dominant game inevitably wanes. Meanwhile a more distributed market indicates a consumer base open to innovation and new entrants — whether this be a new game, new genre or new gameplay mechanics.
Spotlight on the US: Market Concentration by Mobile Games Consumer Spend — The ‘Richest’ Subgenres Are Not ‘Winner-Take-All Markets’
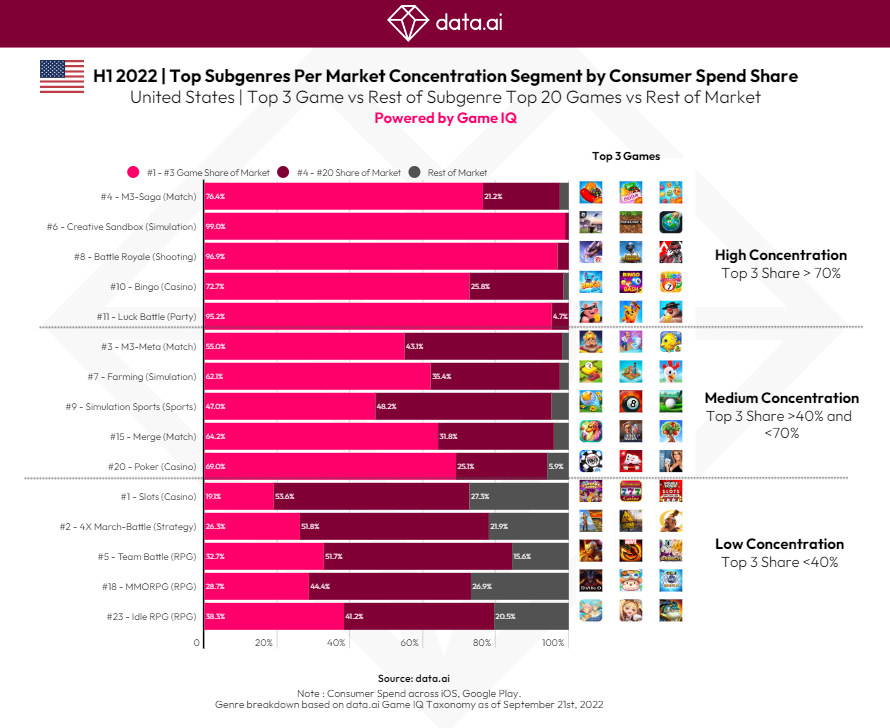
Our research indicates that among the US’s biggest subgenres by consumer spend in H1 2022 are #1 Slots (Casino), #2 4x March-Battle (Strategy) and #5 Team Battle (RPG). But here’s the thing: in all three of them the top 3 titles are far from dominant:
In the latter, top 3 titles were all developed by different publishers. These genres represent highly competitive niches with ample opportunity for multiple games to take home a piece of the pie.
Conversely, M3-Saga (Match) — #4 by consumer spend in the US, #6 Creative Sandbox (Simulation), and #8 Battle Royale (Shooting) represent highly concentrated markets where the top 3 games take home over 70% of consumer spend.
Spotlight on the US: Market Concentration of Mobile Games by Time Spent: Opportunity in the MMORPG Space?
We live in an economy in which attention is a key ‘currency’. In other words, people’s time is money. So how concentrated is US gamers’ attention on top titles? Well, at the top end is Creative Sandbox (Simulation), where the top 3 games grab 94% of all time spent. As with global consumer spend, Slots (Casino) is at the other extreme in the US, with just 14.8% of time spent going to the top 3 games.
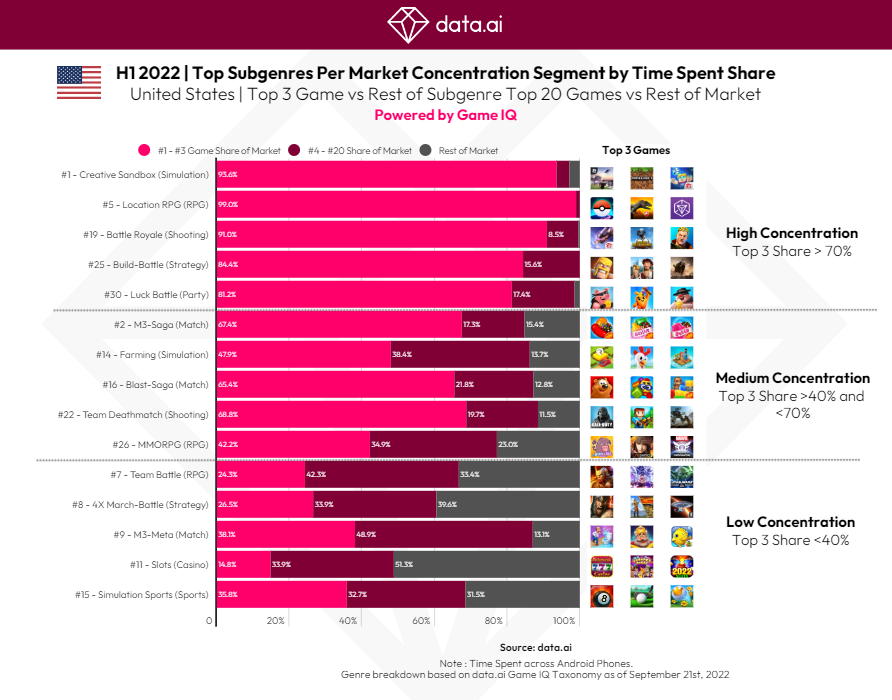
Looking elsewhere, it’s worth considering the MMORPG (RPG) space. This is a core genre that generates huge revenues. But the top 3 games account for a relatively modest 42%. There could be an opportunity here for new games to take market share or innovations in gameplay mechanics to take over share of this valuable currency: time.
To learn more about the data behind this article and what AppAnnie has to offer, visit www.appannie.com.


Sign up to receive our stories in your inbox.
Data is changing the speed of business. Investors, Corporations, and Governments are buying new, differentiated data to gain visibility make better decisions. Don't fall behind. Let us help.


Sign up to receive our stories in your inbox.
Data is changing the speed of business. Investors, Corporations, and Governments are buying new, differentiated data to gain visibility make better decisions. Don't fall behind. Let us help.