
About the Placer.ai Mall Indexes: These Indexes analyze data from more than 100 top-tier indoor malls, 100 open-air lifestyle centers (not including outlet malls) and 100 outlet malls across the country, in both urban and suburban areas. Placer.ai uses anonymized location information from a panel of 30 million devices and processes the data using industry-leading AI and machine learning capabilities to make estimations about overall visits to specific locations
When we look back at mall performance in 2022, the general takeaway is one of relative success for a segment that had been uniquely challenged by the pandemic and its retail effects. This was especially impressive considering that the impact of COVID was rapidly replaced by economic headwinds that limited a full return to business as usual. In short, 2022 was marked by volatility that hindered a full visit recovery for many within the mall sector.
And these headwinds are still lingering presenting ongoing challenges to retail formats of all kinds. So how did mall visits kick off 2023, and did it provide a step forward for this segment?
Strong Start
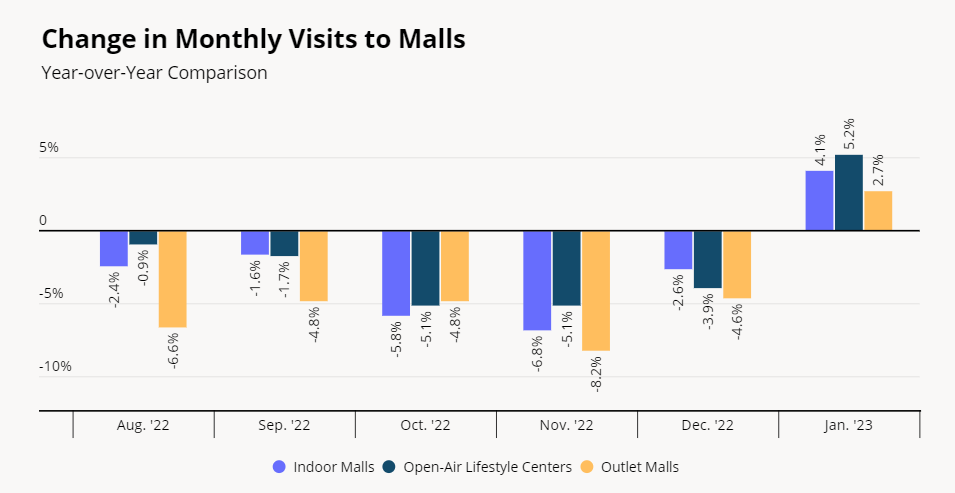
Looking at visits year over year (YoY), indoor malls, open-air lifestyle centers and outlet malls saw visits increases of 4.1%, 5.2% and 2.7% respectively. The wider trend of YoY uptick is significant because of the draw these formats have shown in the face of powerful economic challenges. They also indicate the lingering power of key shifts to tenancy strategies that many top-tier malls have deployed.
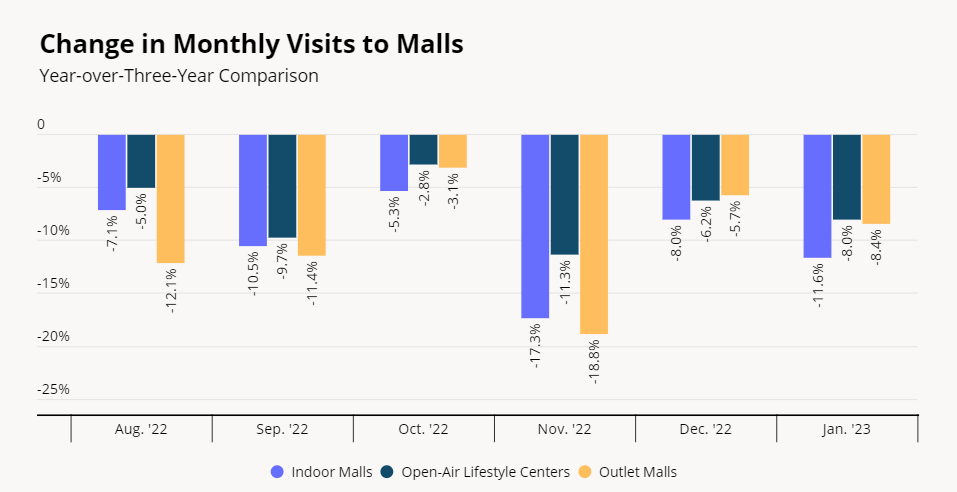
Yet, there are elements that make the context more friendly. For example, the comparison to January 2022, when the rise of the Omicron variant had a significant impact on retail visits nationwide. For this reason, year-over-three-year (Yo3Y) visits remained down with all formats seeing declines compared to the pre-pandemic period.
Weekly Visits, Nuanced Context
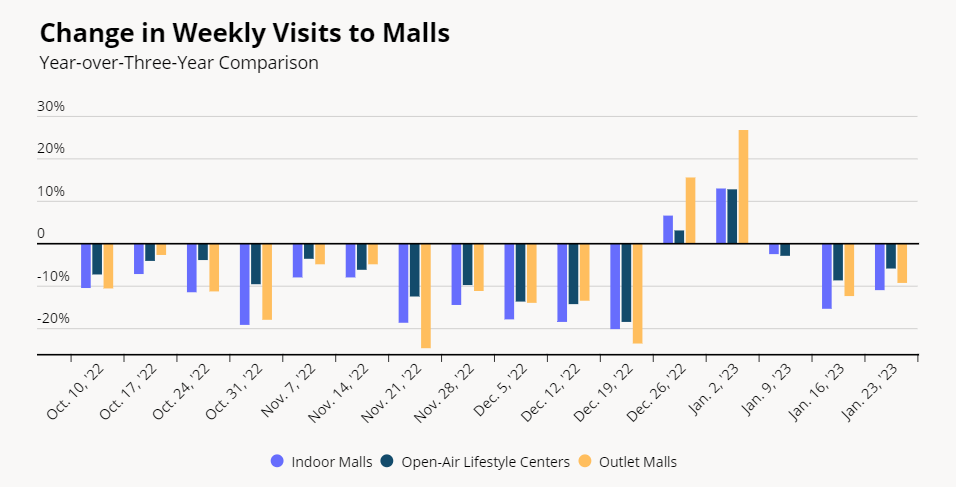
However, a weekly visit analysis presents a more nuanced approach that better identifies the strengths and weaknesses these segments have shown. For example, the weeks beginning on December 26th, January 2nd and even January 9th shine through with even greater power in a Yo3Y analysis. While visits may have been down overall, those weeks showed significant strength.
All three weeks showed visits near or above the same period in 2020, another sign of the continued power of top-tier malls considering the challenging economic environment currently affecting retail. These lifts also speak to some of the unique elements that defined the 2022-2023 holiday season. For one, the presence of key holidays like Christmas and New Year’s on Sundays meant that official days off took place on a Monday without a holiday. This created more opportunity for retail strength as shopping didn’t conflict with holiday celebrations. In addition, presents in the form of gift cards and online shopping-driven returns all led to an increase in the brick-and-mortar retail environment in the immediate aftermath of the holidays.
And while visits did return to declines compared to 2020 the weeks beginning January 16th and 23rd, the gaps did show a positive trajectory decline week over week.
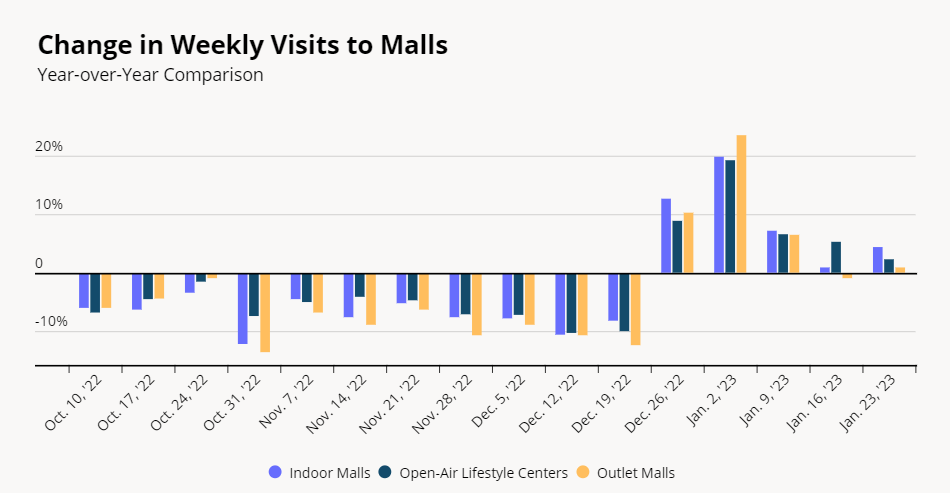
The same story comes through looking at weekly visits YoY with major peaks hitting in late December and early January. Here, the declines in YoY strength indicate that the aforementioned boost from a COVID affected January 2022 was starting to dissipate by late January. However, when this is seen in combination with the growing strength from a Yo3Y perspective, the clear conclusion is that a more normal mall situation may be coming soon.
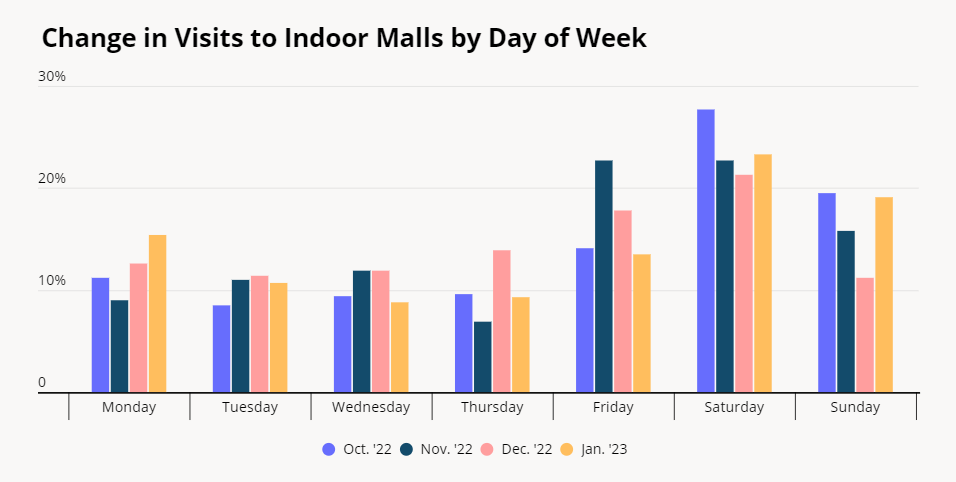
A final indication of the return of mall normalcy is the distribution of visits throughout the week. Where December saw the relative decline of Sunday visits – because of the holidays falling out on these days – January has seen the return of weekend shopping.
Has normalcy returned to mall shopping? Will this recovery trigger a wave of strength for the format? Or will lingering economic headwinds like inflation continue to limit their full power?
To learn more about the data behind this article and what Placer has to offer, visit https://www.placer.ai/.


Sign up to receive our stories in your inbox.
Data is changing the speed of business. Investors, Corporations, and Governments are buying new, differentiated data to gain visibility make better decisions. Don't fall behind. Let us help.


Sign up to receive our stories in your inbox.
Data is changing the speed of business. Investors, Corporations, and Governments are buying new, differentiated data to gain visibility make better decisions. Don't fall behind. Let us help.