Source: https://www.advan.us/blog.php
As we near the last stretch of the US summer season, we looked again at foot traffic data for US airports as one measure of the impact being felt by the travel industry.
In our blog post on June 19th, we noted that traffic at US international hubs was severely depressed, with some regional hubs seeing a little more activity.
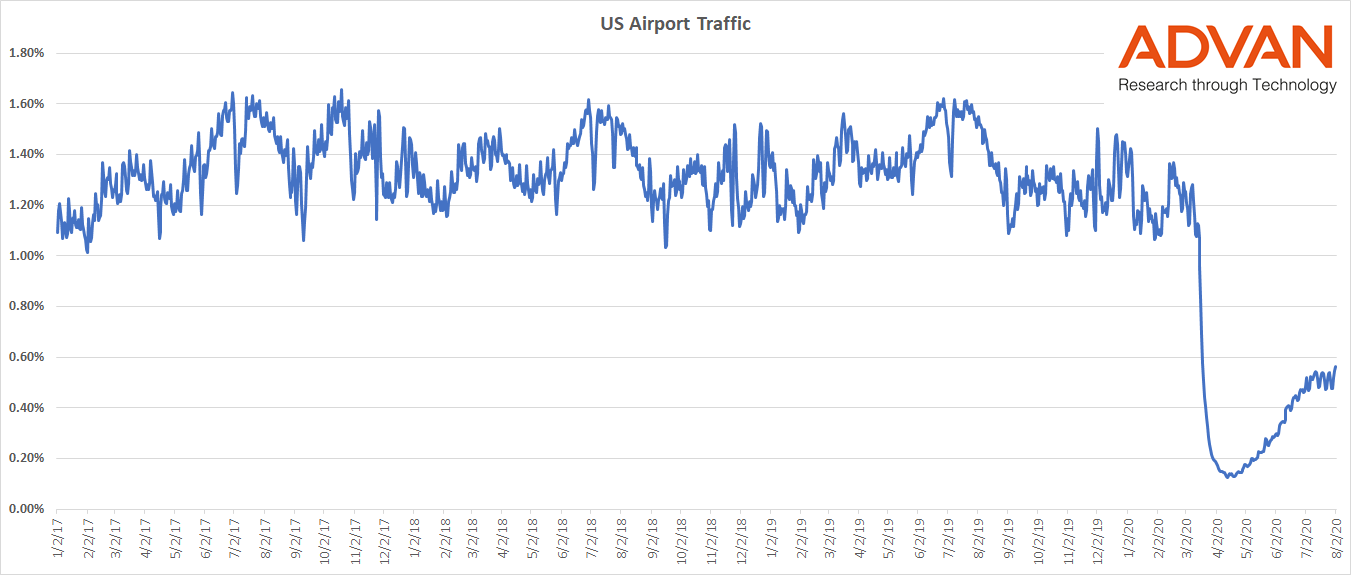
As a key indicator of overall air travel, the chart below shows foot traffic at all US airports. The big trend is clearly the steep drop in March as the US border closed, and cities and states around the US shut down, with many restricting travel from other states.
In late May we did start to see some pick up in activity, which gathered momentum in June, albeit remaining well below pre-covid levels.
Most recently, however, over the last 2-3 weeks with case numbers rebounding, airport foot traffic has flattened again and is steady at levels way below the normal for this season.
To learn more about the data behind this article and what Advan has to offer, visit https://advanresearch.com/.


Sign up to receive our stories in your inbox.
Data is changing the speed of business. Investors, Corporations, and Governments are buying new, differentiated data to gain visibility make better decisions. Don't fall behind. Let us help.


Sign up to receive our stories in your inbox.
Data is changing the speed of business. Investors, Corporations, and Governments are buying new, differentiated data to gain visibility make better decisions. Don't fall behind. Let us help.


