Overview
Welcome to the April 2023 Apartment List National Rent Report. Our national rent index increased by 0.5 percent over the course of March, the second straight monthly increase and a slight acceleration over last month’s pace. This month’s increase is of a similar magnitude to the typical March price change that we saw in pre-pandemic years. After 2022 closed out with record-setting price declines, it appears that rental demand is rebounding in line with the usual seasonal trend.
Year-over-year rent growth is continuing to decelerate, and now stands at 2.6 percent, its lowest level since April 2021. Year-over-year growth is now pacing slightly below the average rate from 2018 to 2019 (2.8 percent), and is likely to decline even further in the months ahead.
Even as rent growth has turned positive again, we continue to see easing on the supply side of the market. Our vacancy index currently stands at 6.6 percent, which now puts it back in-line with the average pre-pandemic rate. With a record number of multi-family apartment units currently under construction, we expect that supply constraints will continue to soften. 2023 could be the first time since the early stages of the pandemic that we see property owners competing for renters, rather than the other way around.
Rents increased in March in 78 of the nation’s 100 largest cities, up from 62 cities that saw prices rise last month. At the same time, 28 of the top 100 cities are currently logging negative year-over-year growth, up from 25 cities last month. Boston saw the nation’s sharpest month-over-month increase, with prices there up by 2.7 percent in March.
Rents nationally increase by 0.5% month-over-month; prices up 2.6% year-over-year
The national median rent increased by a record-setting 17.6 percent over the course of 2021. This rapid growth in rent prices has been a key contributor to overall inflation, which remains top-of-mind for policymakers and everyday Americans alike. While our index has shown that rent growth has been consistently cooling since early last year, the housing component of the official inflation estimates produced by the Bureau of Labor Statistics (the Consumer Price Index, or CPI) continues to rise.1 This is because movements in market rents lead movements in average rents paid, meaning that our index can signal what is likely ahead for the housing component of CPI.
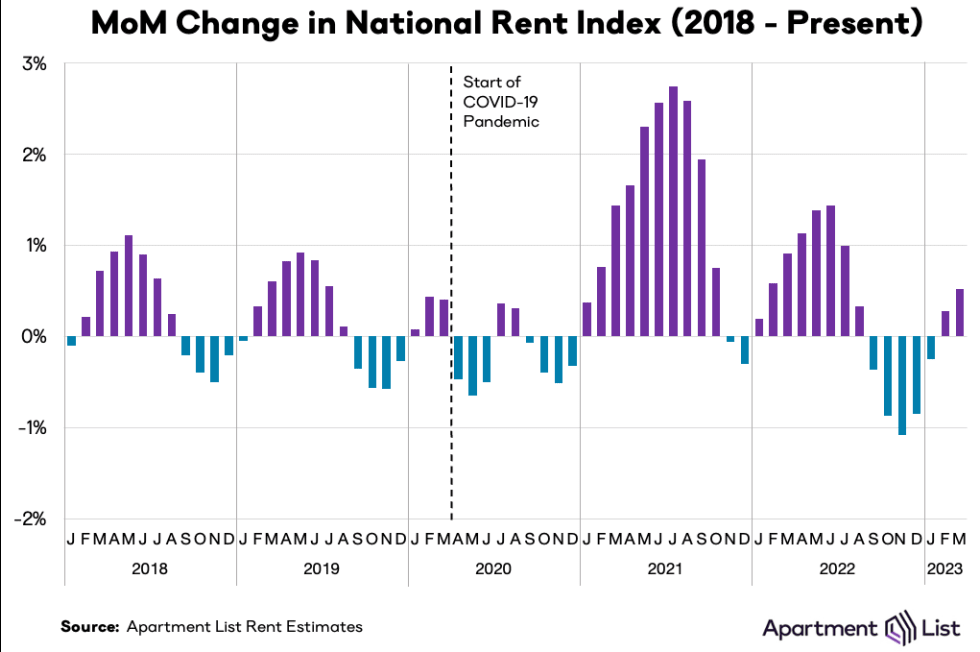
We estimate that the national median rent increased by 0.5 percent month-over-month in March. This marks the second straight month of positive rent growth following a five-month period of prices falling. This month’s increase represents a slight acceleration from the 0.3 percent increase we saw in February. The timing of this recent turn is consistent with the usual seasonal trend in the rental market. It’s typical to see prices dip in the fall and early winter as moving activity slows, but things normally begin to pick back up around this time of year, and rent growth then tends to accelerate until the early summer peak.
But even as rent growth has tracked that typical seasonal pattern, the recent winter dip went well beyond what we normally see. The 3.4 percent decline in rents from last August through January was sharper than any other five-month period in the history of our estimates (starting in 2017). This month’s 0.5 percent rent growth was just slightly below the average March increase of pre-pandemic years; month-over-month growth came in at 0.7 percent in March 2018 and 0.6 percent in March 2019.
This month’s data suggests that we’re beginning to see a mild rebound in rental demand, following a particularly slow off-season to close out 2022. That said, the surging rent growth that we saw in 2021 and the first half of last year is solidly behind us. Even if demand continues to strengthen, a robust supply of new inventory hitting the market this year should keep prices in check. It looks like 2023 is shaping to be a year of modest positive rent growth.
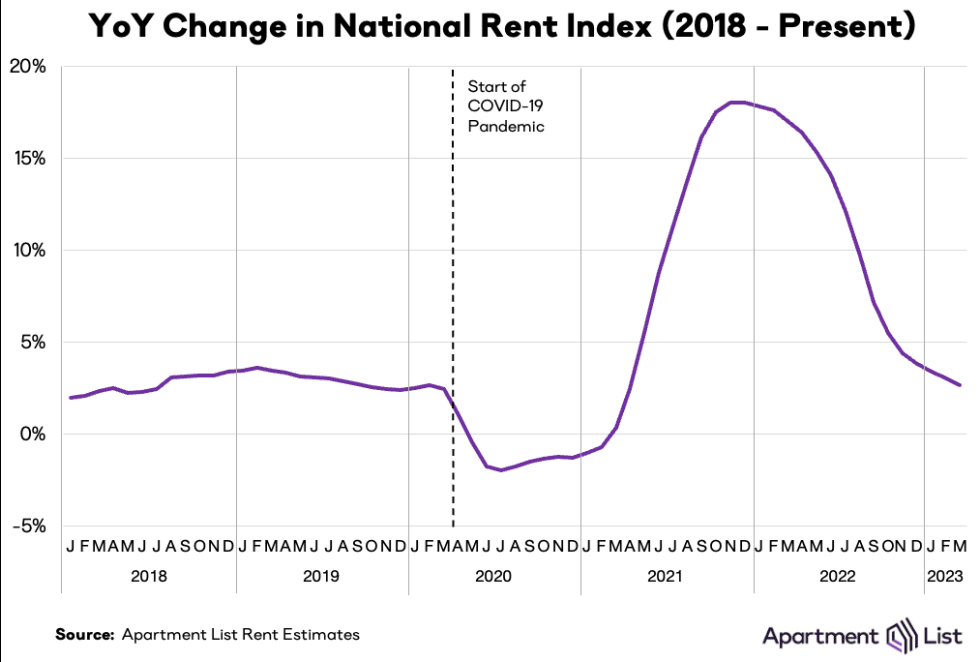
Year-over-year rent growth is continuing to decelerate and now stands at 2.6 percent, down from 3 percent last month. This month marks the lowest year-over-year growth rate that we’ve seen since April 2021 and represents a return to a level of rent growth that was the norm in the years leading up to the pandemic. From 2018 to 2019, year-over-year rent growth averaged 2.8 percent, slightly faster than the current level. And it’s likely that the year-over-year growth rate will continue to fall in the coming months, as we expect rent growth through the first half of this year to be slower than it was last year.
Vacancy index back at pre-pandemic baseline
As we’ve explored in detail, much of the 2021 rent boom was attributable to a tight market in which more households were competing for fewer vacant units. Our vacancy index spiked above 7 percent in the early months of the pandemic in 2020, as many Americans consolidated households and moved in with family amid the uncertainty and economic disruption of the pandemic’s onset. After that, however, rapid household formation drove a sharp tightening of the vacancy rate, which eventually fell to a low of 4.1 percent in fall 2021.
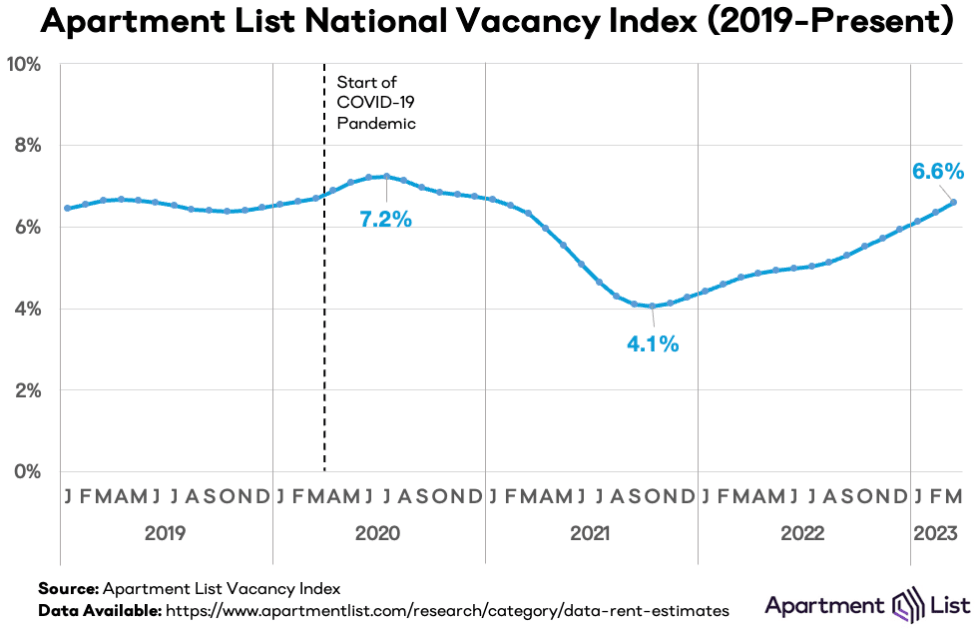
But after bottoming out at 4.1 percent in October 2021, our national vacancy index has been gradually easing for a year and a half, and the rate of easing has picked up steam since last summer. From January through August of last year, our vacancy index was ticking up by an average of 11 basis points per month; but from last September through this month, the average increase has been 21 basis points per month. The vacancy rate now sits at 6.6 percent, exactly matching the average rate from 2018 to 2019.
This easing has shown no signs of slowing, and it’s likely that the vacancy rate will even surpass that pre-pandemic threshold in the months ahead. New apartment construction is recovering from pandemic-related disruptions, and there are now more multifamily units under construction than at any point since 1970. As this new inventory hits the market over the course of the year, we could begin to see property owners competing for renters to fill their units, a marked change from the prevailing conditions of the past two years, in which renters have been competing for a limited supply of available inventory.
Vacancy trends are highly localized, and they have been a key indicator of rapidly evolving conditions in local markets across the U.S. throughout the pandemic. To explore the topic in greater detail, monthly vacancy data are now available for download for hundreds of cities, metros, and states, and can be easily linked to our existing rent estimates using Federal Information Processing System (FIPS) codes.
**
Rents rise month-over-month in 78 of 100 largest cities; 28 cities have seen prices fall year-over-year**
The chart below visualizes monthly rent changes in each of the nation’s 100 largest cities from January 2019 to present. The color in each cell represents the extent to which prices went up (red) or down (blue) in a given city in a given month. In 2020, we can see that rents fell sharply in many of the nation’s largest and most expensive cities, while smaller and more affordable ones picked up steam, leading to some convergence in prices. Meanwhile, the dark red band in 2021 represents the rent heatwave which peaked in July and August 2021 when all 100 cities in this chart saw prices go up. The rightmost columns show the recent cooldown and now the return back to positive growth.
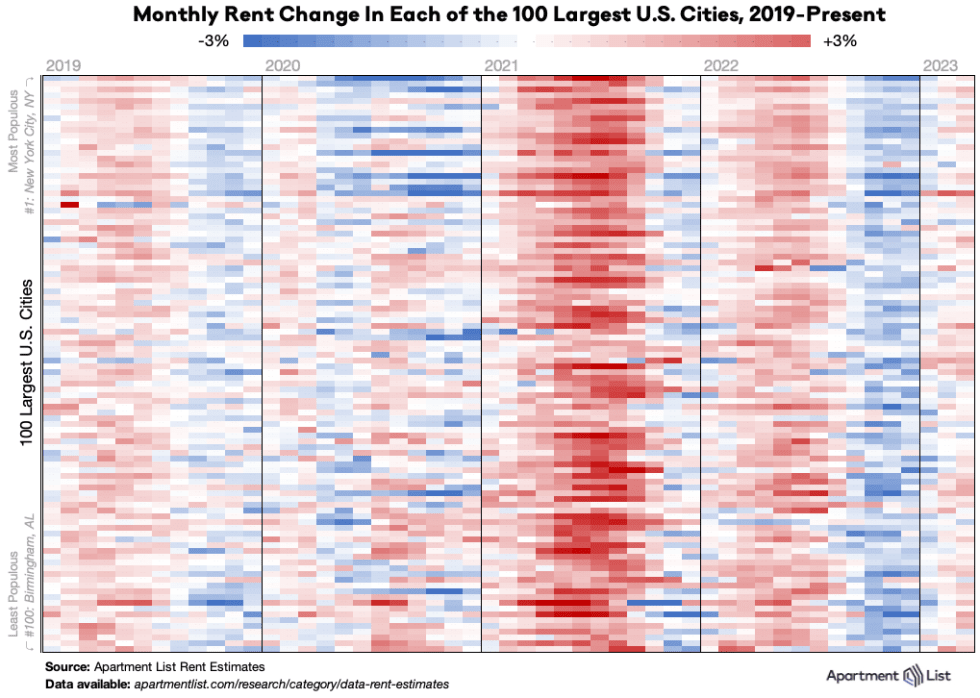
Rents increased this month in 78 of the nation’s 100 largest cities, while an additional 4 cities saw prices remain flat. The largest city-level increase this month was in Boston where rents spiked sharply by 2.6 percent from February to March. Rents in Boston are exhibiting a more pronounced seasonal trend than in other parts of the country. After falling sharply by 10.1 percent from last August through December, Boston rents have now shot back up by 7.8 percent over the past three months. Year-over-year, rents in Boston are up by 6.1 percent, the #10 fastest increase among the 100 largest cities.
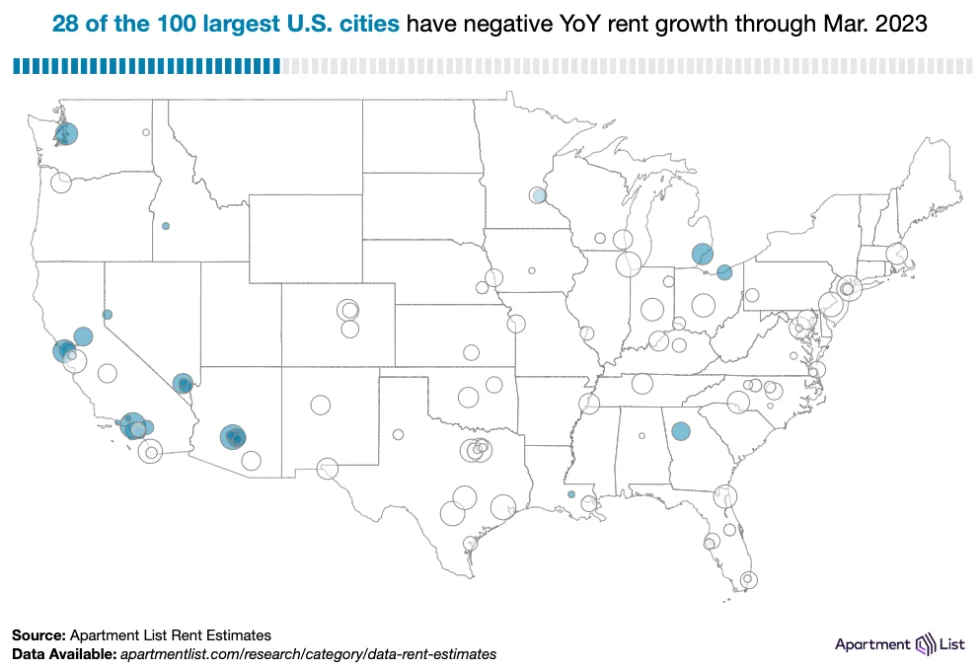
At the other end of the spectrum, there are a considerable number of cities that have seen prices fall since this time last year. 28 of the 100 largest cities currently have negative year-over-year growth, up from 25 cities last month. San Francisco and Los Angeles were among the cities to dip into negative territory this month. The sharpest year-over-year decline was in Scottsdale, AZ, where prices have fallen by 5.4 percent since last March. Price declines have been concentrated along the West Coast – particularly in the Phoenix and Las Vegas metros, which have begun to cool after booming in the early pandemic.
Midwestern markets have seen the fastest rent growth over the past year
At the metro level, the fastest rent growth over the past year has been occurring in the Midwest. The following table shows the ten metropolitan areas that have experienced the fastest rent growth over the past six months, over the past year, and since the pandemic started in March 2020:
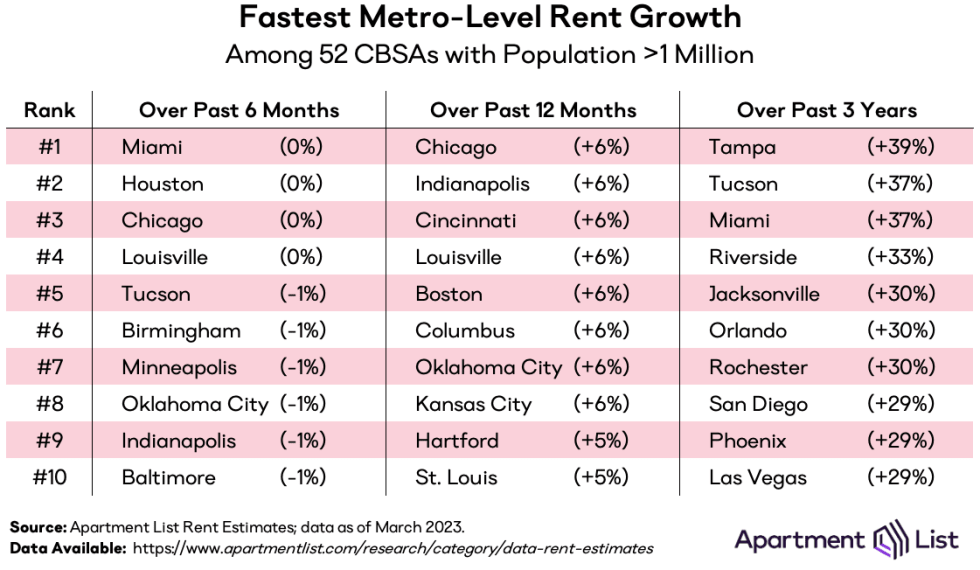
The three metros with the fastest year-over-year rent growth are all located in the Midwest. Chicago leads the pack, with prices there up by 6.3 percent year-over-year, followed by Indianapolis with an increase of 6.2 percent, and Cincinnati at 6 percent. Three other Midwestern metros – Columbus, Kansas City, and St. Louis – also make the top 10. With many previously affordable Sun Belt markets having seen rents spike by 30 percent or more over the past two and a half years, markets in the Midwest may now represent some of the last bastions of affordability, and could therefore be drawing new attention.
Of course, given the recent rental market cooldown, even the metros currently topping this list are experiencing relatively modest growth compared to what we were seeing in 2021 and the first half of last year. Last June, for example, all but one of the 52 metros with a population over one million logged year-over-year growth rates greater than Chicago’s current 6.3 percent rate which is now the nation’s fastest. And over the past six months, not a single large metro has seen prices increase.
The Bay Area rental market continues to sputter
As mentioned above, the city of San Francisco dipped into negative year-over-year rent growth this month. That sluggishness is affecting not just the city-proper, but the broader San Francisco Bay Area as a whole. The San Francisco metro is one of just six large metros to experience negative year-over-year growth, and Bay Area rents are still 4.5 percent lower than they were in March 2020, making it the only metro where rents are still discounted compared to the pandemic’s onset. The neighboring San Jose metro ranks second for slowest growth over the past three years, and fifth for slowest growth over the past six months. With existing softness in the tech industry now being compounded by the collapse of Silicon Valley Bank – a key lender for Bay Area start-ups – it’s unlikely that we’ll see a strong rebound in Bay Area rents anytime soon.
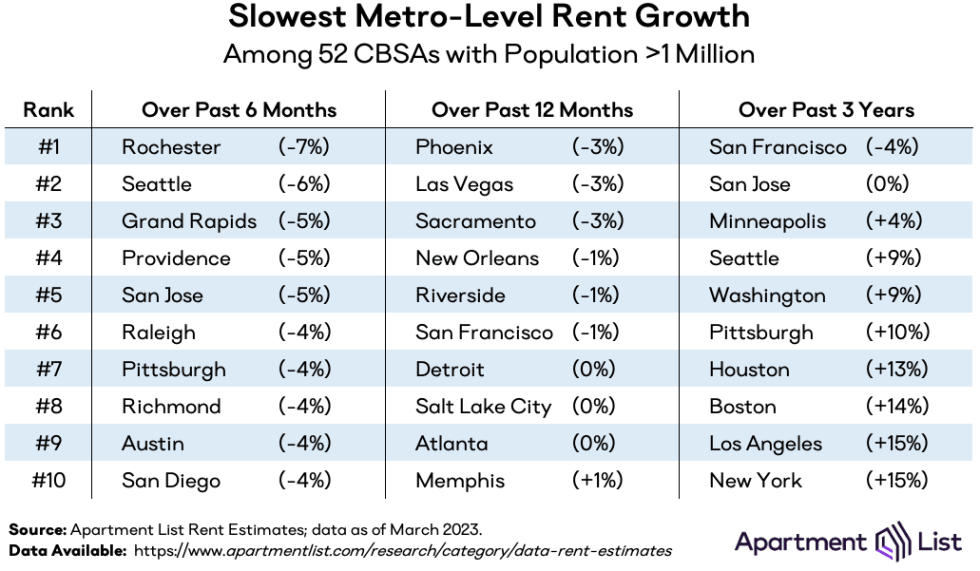
After San Francisco and San Jose the right-most column of the table is largely populated by other pricey coastal metros, including Seattle; Washington, D.C.; Boston; Los Angeles; and New York. Even as many of these markets have rebounded over the past year and a half, they have still had among the most modest rent growth over the course of the pandemic as a whole. That said, just five metros have experienced rent growth of less than 10 percent since March 2020.
Notably, the table above also shows how some of the markets that had been booming fastest in the recent past have now quickly cooled off. Mirroring the city-level data above, the Las Vegas and Phoenix metros have seen the sharpest rent declines over the past twelve months, despite the fact that both metros still rank among the top ten for fastest pandemic-era rent growth.
Conclusion
March’s 0.5 percent increase represents a slightly faster rate of growth than we saw last month, confirming the rents are firmly back on an upward trajectory. That said, year-over-year growth fell again to 2.6 percent – dipping below the pre-pandemic average from 2018 to 2019 – and will likely decelerate even further in the months ahead. And even if demand continues to rebound, a strong construction pipeline should temper rent growth for the remainder of the year. Prices may not fall further, but they are also unlikely to increase significantly.
To learn more about the data behind this article and what Apartment List has to offer, visit https://www.apartmentlist.com/.


Sign up to receive our stories in your inbox.
Data is changing the speed of business. Investors, Corporations, and Governments are buying new, differentiated data to gain visibility make better decisions. Don't fall behind. Let us help.


Sign up to receive our stories in your inbox.
Data is changing the speed of business. Investors, Corporations, and Governments are buying new, differentiated data to gain visibility make better decisions. Don't fall behind. Let us help.