Home Price Index Highlights: October 2021
Overall HPI Growth
National home prices increased 18% year over year in October 2021, according to the latest CoreLogic Home Price Index (HPI®) Report . The October 2021 HPI gain was up from the October 2020 gain of 7.4% and was the highest 12-month growth in the U.S. index since the series began in 1976. The increase in home prices was fueled by low mortgage rates, low for-sale supply and an influx in homebuying activity from investors. Projected increases in for-sale supply and moderation in demand as prices grow out of reach for some buyers could slow home price gains over the next 12 months.
HPI Growth by Price and Property Type Tiers
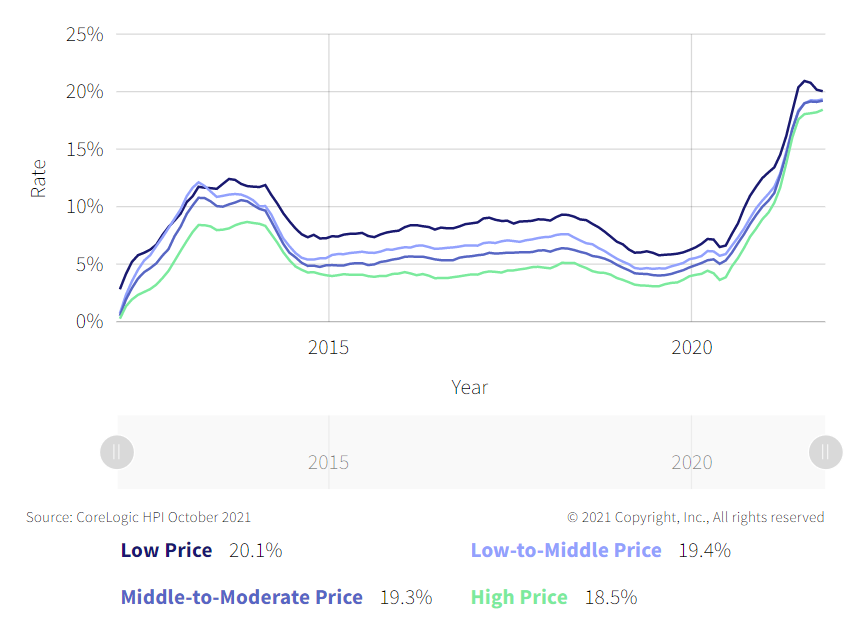
CoreLogic analyzes four individual home-price tiers that are calculated relative to the median national home sale price.[1] Home price growth leveled off at a high rate for all four price tiers in October. The lowest price tier increased 20.1% year over year in October 2021, compared with 19.4% for the low- to middle-price tier, 19.3% for the middle- to moderate-price tier, and 18.5% for the high-price tier. The difference in HPI growth rates between the low- and high-price tiers has been narrowing for all of 2021 and in October was the smallest in ten years.
CoreLogic also provides the HPI separately for detached — or freestanding — properties and attached -properties (such as condos or townhouses). Appreciation for detached properties (19.5%) was 1.5 times that of attached properties (12.9%) in October as continued use of remote work allowed many employees to buy homes further from their office and in areas where property prices and population density are lower and detached housing is more common.
Figure 1: Home Prices Accelerate at All Price Levels
Year-Over-Year Change in HPI by Price Tier
State-Level Results
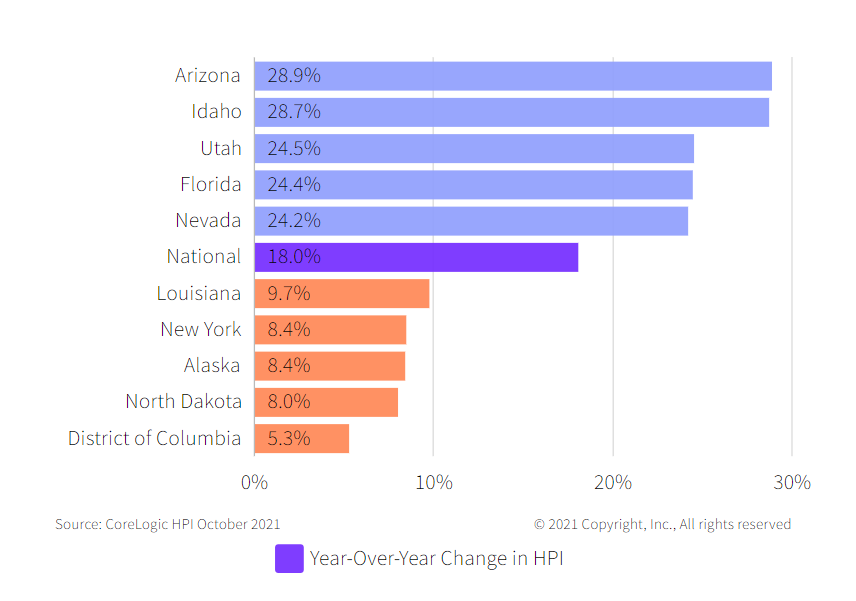
Figure 2 shows the year-over-year HPI growth in October 2021 for the 5 highest- and lowest-appreciating states. While all states showed annual increases in HPI in October, appreciation was strongest in the Mountain West. Arizona appreciated 28.8% year over year in October followed by Idaho (+28.7%) and Utah (+24.5%). At the low end, Washington, D.C., saw home prices increase 5.3%, and home prices in North Dakota increased 8%.
The surge in home price appreciation was felt across the country, with most states showing higher appreciation in October 2021 than in October 2020. Florida had the biggest acceleration in home price growth from October 2020 (+7.3%) to October 2021 (+24.4%). Washington, D.C. saw a slowdown in appreciation with prices increasing 5.3% in October 2021 compared with 5.5% in October 2020.
Figure 2: Appreciation Was Strongest in the Mountain West
States With the Highest and Lowest Year-Over-Year Change in HPI for October 2021
U.S. annual home price growth remained strong at 18% in October, the highest recorded in the 45-year history of the index. Nonetheless, monthly price growth has slowed from its April peak and signals a moderation in price growth that the CoreLogic HPI Forecast projects will continue to slow in coming months. Home price gains are projected to slow to a 2.5% increase by October 2022, as affordability and economic concerns deter some potential buyers and additional for-sale inventory comes to the market.
To learn more about the data behind this article and what CoreLogic has to offer, visit https://www.corelogic.com/.


Sign up to receive our stories in your inbox.
Data is changing the speed of business. Investors, Corporations, and Governments are buying new, differentiated data to gain visibility make better decisions. Don't fall behind. Let us help.


Sign up to receive our stories in your inbox.
Data is changing the speed of business. Investors, Corporations, and Governments are buying new, differentiated data to gain visibility make better decisions. Don't fall behind. Let us help.