
Through October 2021 with Forecasts from October 2022
Introduction
The CoreLogic Home Price Insights report features an interactive view of our Home Price Index product with analysis through October 2021 and forecasts through October 2022.
CoreLogic HPI™ is designed to provide an early indication of home price trends. The indexes are fully revised with each release and employ techniques to signal turning points sooner. CoreLogic HPI Forecasts™ (with a 30-year forecast horizon), project CoreLogic HPI levels for two tiers—Single-Family Combined (both Attached and Detached) and Single-Family Combined excluding distressed sales.
The report is published monthly with coverage at the national, state and Core Based Statistical Area (CBSA)/Metro level and includes home price indices (including distressed sale); home price forecast and market condition indicators. The data incorporates more than 40 years of repeat-sales transactions for analyzing home price trends.
HPI National Change
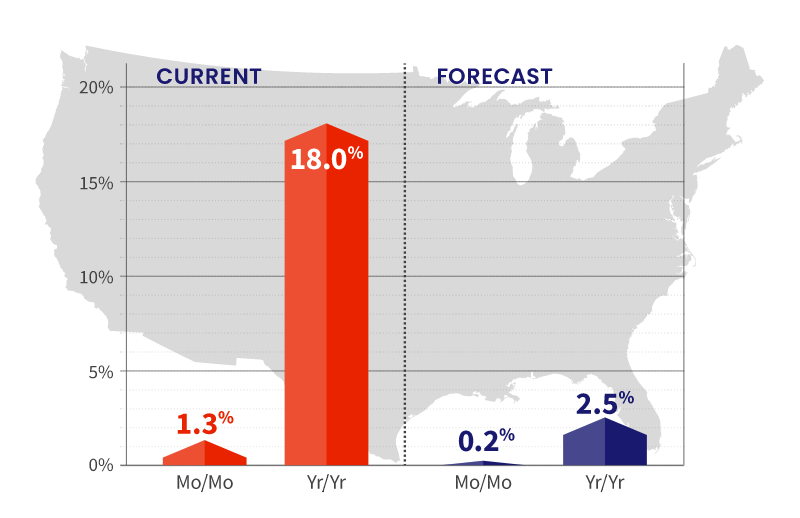
October 2021 National Home Prices
Home prices nationwide, including distressed sales, increased year over year by 18% in October 2021 compared with October 2020. On a month-over-month basis, home prices increased by 1.3% in October 2021 compared with September 2021 (revisions with public records data are standard, and to ensure accuracy, CoreLogic incorporates the newly released public data to provide updated results).
Forecast Prices Nationally
The CoreLogic HPI Forecast indicates that home prices will increase on a month-over-month basis by 0.2% from October 2021 to November 2021, and on a year-over-year basis by 2.5% from October 2021 to October 2022.
“New household formation, investor purchases and pandemic-related factors driving demand for the limited supply of available for-sale homes continues to propel the upward spiral of U.S. home prices. However, we expect home price growth to moderate over the near term as many buyers take a break for the holidays.”
-Frank Martell
President and CEO of CoreLogic
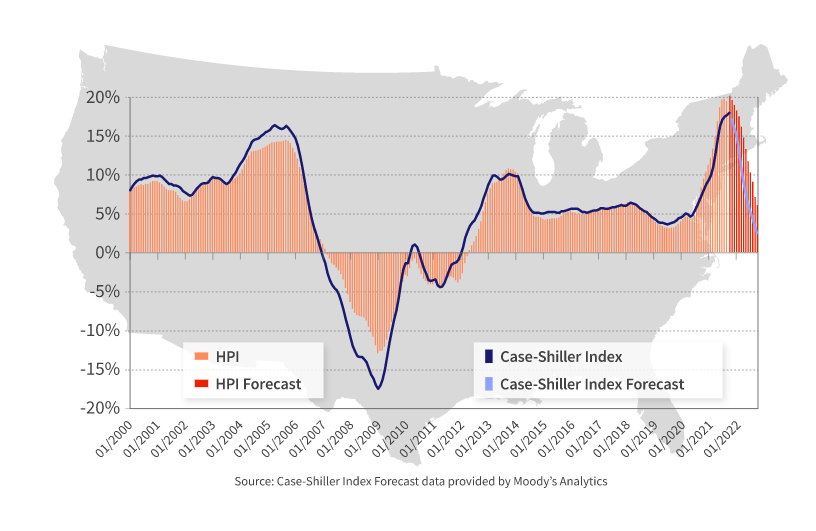
HPI & Case-Shiller Trends
This graph shows a comparison of the national year-over-year percent change for the CoreLogic HPI and CoreLogic Case-Shiller Index from 2000 to present month with forecasts one year into the future. We note that both the CoreLogic HPI Single Family Combined tier and the CoreLogic Case-Shiller Index are posting positive, but moderating year-over-year percent changes, and forecasting gains for the next year.
Economic Impact on Home Prices
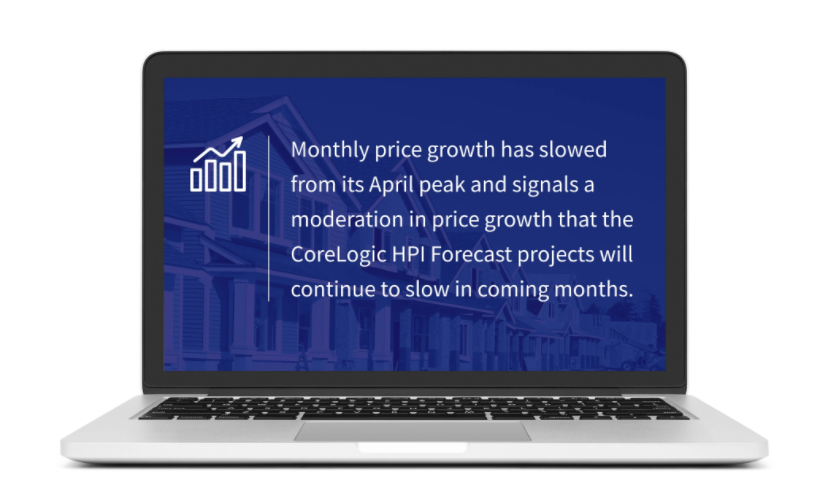
U.S. annual home price growth remained strong at 18% in October, the highest recorded in the 45-year history of the index. Nonetheless, monthly price growth has slowed from its April peak and signals a moderation in price growth that the CoreLogic HPI Forecast projects will continue to slow in coming months.
Despite affordability challenges, a recent CoreLogic consumer survey shows that over half of respondents across every age cohort said that owning a home has always been a goal of theirs — further supporting the outlook that consumer desire for homeownership remains.
“Single-family detached houses remain the preferred home for buyers during the pandemic. This is reflected in the 19.5% annual price rise for detached houses, which marks another record-high for the CoreLogic Home Price Index.”
– Dr. Frank Nothaft
Chief Economist for CoreLogic
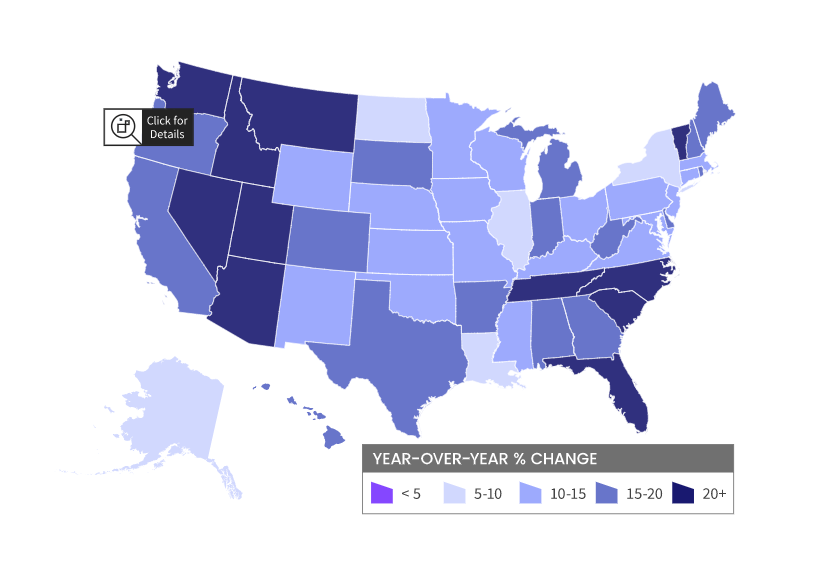
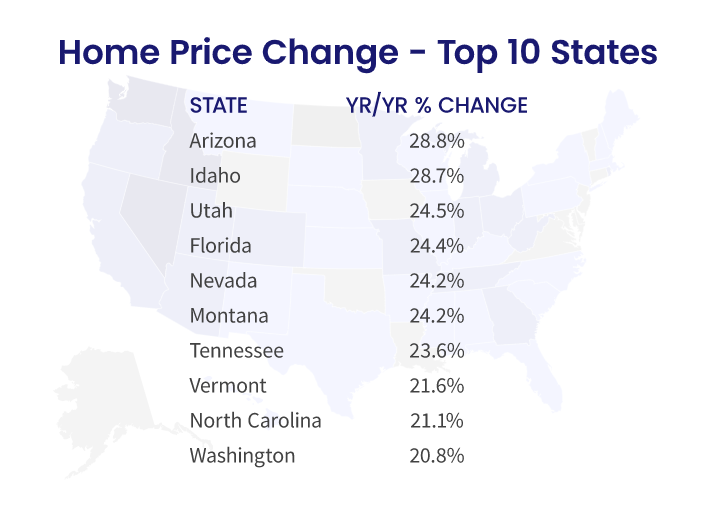
HPI National and State Maps – October 2021
The CoreLogic HPI provides measures for multiple market segments, referred to as tiers, based on property type, price, time between sales, loan type (conforming vs. non-conforming) and distressed sales. Broad national coverage is available from the national level down to ZIP Code, including non-disclosure states.
Nationally, home prices increased 18% year over year in October. No states posted an annual decline in home prices. The states with the highest increases year-over-year were Arizona (28.8%), Idaho (28.7%), and Utah (24.5%).
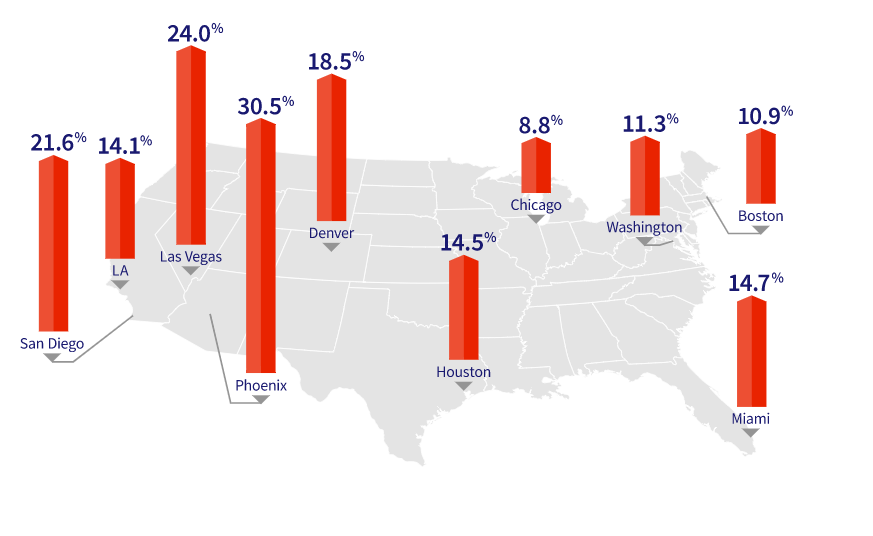
HPI Top 10 Metros Change
The CoreLogic HPI provides measures for multiple market segments, referred to as tiers, based on property type, price, time between sales, loan type (conforming vs. non-conforming) and distressed sales. Broad national coverage is available from the national level down to ZIP Code, including non-disclosure states.
These large cities continue to experience price increases in October, with Phoenix leading the way at 30.5% year over year.
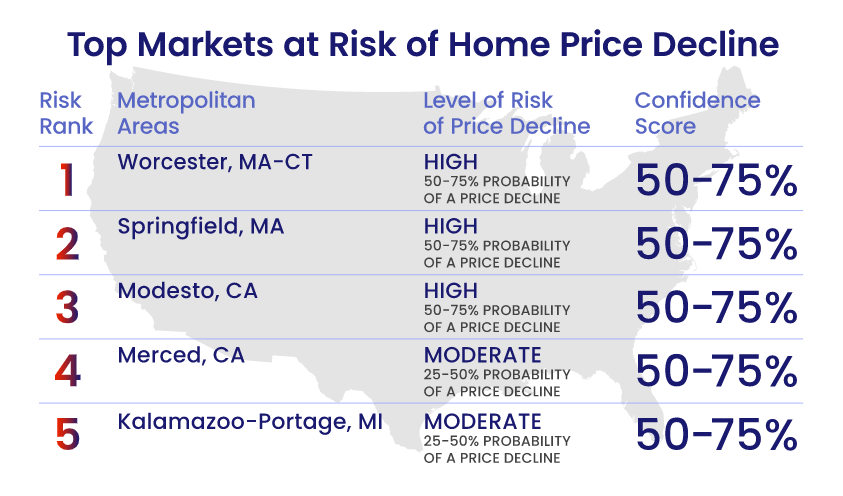
Markets to Watch: Top Markets at Risk of Home Price Decline
While home price changes on the local level vary, October gains across all of the top 10 metros surpassed their 2020 levels. However, metro areas where affordability constraints are prevalent continue to persist as prices rise. For instance, in October, home prices in San Diego increased 21.6% year over year and are forecasted to increase an additional 7.6% over the next 12 months.
Conversely, The HPI Forecast also reveals the continued disparity in home price growth across metros. In markets like Houston, which was hit hard by the collapse of the oil industry and the recent hurricane season, home prices are expected to decline 1.2% by October 2022.
The CoreLogic Market Risk Indicator (MRI), a monthly update of the overall health of housing markets across the country, predicts that metros such Springfield, Massachusett; Worcester, Massachusetts; and Modesto, California are at the highest risk (50-70% probability) of a decline in home prices over the next 12 months. Merced, California, and Kalamazoo-Portage, Michigan, are also at moderate risk (25-50%) of a decline.
Summary
CoreLogic HPI features deep, broad coverage, including non-disclosure state data. The index is built from industry-leading real-estate public record, servicing, and securities databases—including more than 40 years of repeat-sales transaction data—and all undergo strict pre-boarding assessment and normalization processes.
CoreLogic HPI and HPI Forecasts both provide multi-tier market evaluations based on price, time between sales, property type, loan type (conforming vs. non-conforming) and distressed sales, helping clients hone in on price movements in specific market segments.
Updated monthly, the index is the fastest home-price valuation information in the industry—complete home-price index datasets five weeks after month’s end. The Index is completely refreshed each month—all pricing history from 1976 to the current month—to provide the most up-to-date, accurate indication of home-price movements available.
To learn more about the data behind this article and what CoreLogic has to offer, visit https://www.corelogic.com/.


Sign up to receive our stories in your inbox.
Data is changing the speed of business. Investors, Corporations, and Governments are buying new, differentiated data to gain visibility make better decisions. Don't fall behind. Let us help.


Sign up to receive our stories in your inbox.
Data is changing the speed of business. Investors, Corporations, and Governments are buying new, differentiated data to gain visibility make better decisions. Don't fall behind. Let us help.