CoreLogic®, a leading global property information, analytics and data-enabled solutions provider, today released its latest Single-Family Rent Index (SFRI), which analyzes single-family rent price changes nationally and across major metropolitan areas. U.S. annual single-family rent growth continued to slow year over year in January, declining for the ninth straight month to 5.7%. Orlando, Florida posted the country’s largest annual gain for the third consecutive month, while Miami dropped out of the top three highest-growth markets for the first time since the summer of 2021.
The CoreLogic Home Price Insights report features an interactive view of our Home Price Index product with analysis through January 2023 with forecasts through January 2024. CoreLogic HPI™ is designed to provide an early indication of home price trends. The indexes are fully revised with each release and employ techniques to signal turning points sooner. CoreLogic HPI Forecasts™ (with a 30-year forecast horizon), project CoreLogic HPI levels for two tiers—Single-Family Combined (both Attached and Detached) and Single-Family Combined excluding distressed sales.
For homebuyers, affordability, job opportunities and outdoor amenities are major driving factors for relocation. Our previous analysis showed that homebuyers who relocated to another metro in recent years often chose metros adjacent to their current location and/or had a lower cost of living. Although homebuyers were weighing these considerations before COVID-19, the migration rate to cities featuring these factors grew during the pandemic. With the combination of low for-sale inventory, low interest rates and a shift to a more flexible working environment, more people moved out of expensive metros in search of affordability, outdoor amenities and warmer weather.
The share of single-family home purchases made by investors\[1\] held steady in the fourth quarter of 2022. After falling to 21% in June of last year, the share of investor purchases rose to 26% in September and has remained about the same since. Figure 1 shows that the investor share plateaued in the fourth quarter of last year at around 2 percentage points lower than its high of 28% in February 2022; however, this is still much higher than at any time pre-pandemic.
The CoreLogic Loan Performance Insights report features an interactive view of our mortgage performance analysis through December 2022. Measuring early-stage delinquency rates is important for analyzing the health of the mortgage market. To more comprehensively monitor mortgage performance, CoreLogic examines all stages of delinquency as well as transition rates that indicate the percent of mortgages moving from one stage of delinquency to the next.
CoreLogic®, a leading global property information, analytics and data-enabled solutions provider, today released its latest Single-Family Rent Index (SFRI), which analyzes single-family rent price changes nationally and across major metropolitan areas. Rent price gains declined in December for the eighth straight month on an annual basis, but the 6.4% national increase remained higher than pre-pandemic levels. Although major tech company layoffs are making headlines, a still relatively healthy U.S. job market is keeping rent prices elevated, with the national unemployment rate hovering near a decade low in December.
Housing prices have increased for over a decade. Following the fallout from the 2000s housing crisis, which ended in July 2012, home prices have posted year-over-year increases every month. As prices appreciated, the spread in housing costs across the country grew further apart. This level of dispersion hit an all-time high in July 2022, when the difference between the 40th most-expensive MSA and the 160th most-expensive MSA was $268,000.
The CoreLogic Home Price Insights report features an interactive view of our Home Price Index product with analysis through December 2022 with forecasts through December 2023. CoreLogic HPI™ is designed to provide an early indication of home price trends. The indexes are fully revised with each release and employ techniques to signal turning points sooner. CoreLogic HPI Forecasts™ (with a 30-year forecast horizon), project CoreLogic HPI levels for two tiers—Single-Family Combined (both Attached and Detached) and Single-Family Combined excluding distressed sales.
The CoreLogic Loan Performance Insights report features an interactive view of our mortgage performance analysis through November 2022. Measuring early-stage delinquency rates is important for analyzing the health of the mortgage market. To more comprehensively monitor mortgage performance, CoreLogic examines all stages of delinquency as well as transition rates that indicate the percent of mortgages moving from one stage of delinquency to the next.
The nation’s overall mortgage delinquency rates have improved significantly over the last year, according to the latest CoreLogic Loan Performance Insights Report. Data shows the serious delinquency rate for October 2022 declined one percentage point from 12 months prior to 1.2%. Compared to the peak serious delinquency rate for mortgages in August 2020, the rate in October was down three percentage points, which was mostly driven by strong labor market conditions since the U.S. economy reopened.
CoreLogic®, a leading global property information, analytics and data-enabled solutions provider, today released its latest Single-Family Rent Index (SFRI), which analyzes single-family rent price changes nationally and across major metropolitan areas. Single-family rental price increases dropped to 7.5% year over year in November, with all four tracked price tiers posting lower gains than a year earlier. November marked the seventh consecutive month of annual deceleration, and while Florida metro areas continued to post the nation’s highest rental cost gains, other Sun Belt cities such as Phoenix and Las Vegas that formerly showed the highest rent increases are now at the bottom.
In the spring of 2020, downtown areas became unattractive places for many people because of the emergence of COVID-19. The economic shutdown meant that urban cores lost their lifestyle value, remote work meant they lost their commuting value and physical distancing stripped them of their social value. These factors, among others, led to a flight from dense urban areas, both to the suburbs and beyond.
Millennials have made up the largest share of home purchase mortgage applications for the last six years. According to the CoreLogic Loan Application Database, Millennial homebuyer share rose to its highest level in 2022, comprising about 54% of overall home-purchase applications (Figure 1). The Millennial home purchase share has steadily increased since 2015, rising about two to three percentage points per year. At the same time, Gen Z — the generation succeeding Millennials whose members were born after 1997 — is entering the housing market. This year, the cohort comprised about 4% of overall home-purchase applications.
The CoreLogic Loan Performance Insights report features an interactive view of our mortgage performance analysis through October 2022. Measuring early-stage delinquency rates is important for analyzing the health of the mortgage market. To more comprehensively monitor mortgage performance, CoreLogic examines all stages of delinquency as well as transition rates that indicate the percent of mortgages moving from one stage of delinquency to the next. The report is published monthly with coverage at the national, state and Core Based Statistical Area (CBSA)/Metro level and includes transition rates between states of delinquency and separate breakouts for 120+ day delinquency.
Housing is expensive, and this year, homeowners saw housing affordability decline as their monthly mortgage payments jumped to the highest levels in 15 years. With inflation simultaneously pushing the cost of goods up everywhere, current economic conditions are exerting pressure on current and future homeowners leaving many wondering if they can afford a mortgage. Over the last year, home prices increased by double digits, with CoreLogic’s most recent Home Price Insights report showing a 10.1% year-over-year increase in October 2022. And this rise in prices is independent of interest rates which spiked to over 7% in mid-
CoreLogic®, a leading global property information, analytics and data-enabled solutions provider, today released its latest Single-Family Rent Index (SFRI), which analyzes single-family rent price changes nationally and across major metropolitan areas. U.S. rental price growth slowed for the sixth straight month on an annual basis in October to 8.8%, the lowest rate of appreciation in more than a year but still three times higher than the pre-pandemic level. Despite the continued cooling, a shortage of available properties is keeping costs elevated, a trend that is partially fueling year-over-year gains in the lower-priced tier.
The CoreLogic Homeowner Equity Insights report, is published quarterly with coverage at the national, state and Core Based Statistical Area (CBSA)/Metro level and includes negative equity share and average equity gains. The report features an interactive view of the data using digital maps to examine CoreLogic homeowner equity analysis through the third quarter of 2022. Negative equity, often referred to as being “underwater” or “upside down,” applies to borrowers who owe more on their mortgages than their homes are worth. Negative equity can occur because of a decline in home value, an increase in mortgage debt or both.
The CoreLogic Home Price Insights report features an interactive view of our Home Price Index product with analysis through October 2022 with forecasts through October 2023. CoreLogic HPI™ is designed to provide an early indication of home price trends. The indexes are fully revised with each release and employ techniques to signal turning points sooner. CoreLogic HPI Forecasts™ (with a 30-year forecast horizon), project CoreLogic HPI levels for two tiers—Single-Family Combined (both Attached and Detached) and Single-Family Combined excluding distressed sales.
CoreLogic®, a leading global property information, analytics and data-enabled solutions provider, today released its latest Single-Family Rent Index (SFRI), which analyzes single-family rent price changes nationally and across major metropolitan areas. Consistent evidence of a single-family rental market cooldown follows nearly two years of above-trend rental price hikes. Year-over-year single-family rent growth slowed for the fifth consecutive month in September 2022 to 10.2%, down from a high of 13.9% in April 2022.
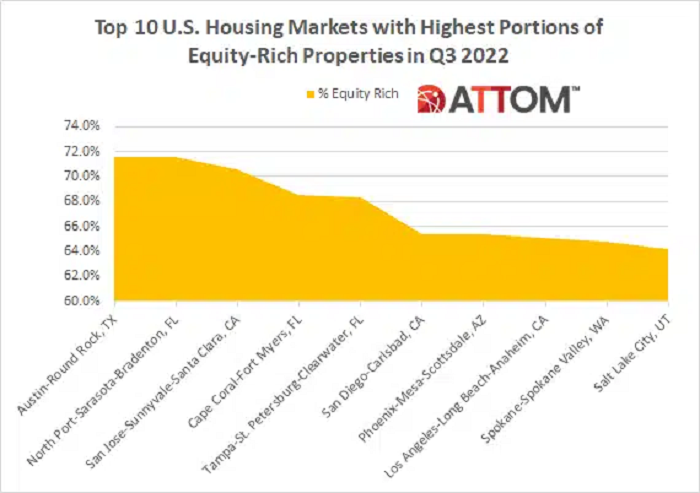
According to ATTOM’s Q3 2022 U.S. Home Equity & Underwater Report, 48.5 percent of mortgaged residential properties in the U.S. were considered equity-rich in the third quarter. The report noted that figure was up from 48.1 percent in Q2 2022 and 39.5 percent in Q3 2021. ATTOM’s latest home equity and underwater analysis also noted the latest increase fell below other gains in recent years, but still marked the 10th straight quarterly rise, and resulted in virtually half of all mortgage payers landing in equity-rich territory.