Data Through Q3 2022
Introduction
The CoreLogic Homeowner Equity Insights report, is published quarterly with coverage at the national, state and Core Based Statistical Area (CBSA)/Metro level and includes negative equity share and average equity gains. The report features an interactive view of the data using digital maps to examine CoreLogic homeowner equity analysis through the third quarter of 2022.
Negative equity, often referred to as being “underwater” or “upside down,” applies to borrowers who owe more on their mortgages than their homes are worth. Negative equity can occur because of a decline in home value, an increase in mortgage debt or both.
This data only includes properties with a mortgage. Non-mortgaged properties (that are owned outright) are not included.
Homeowner Equity Q3 2022
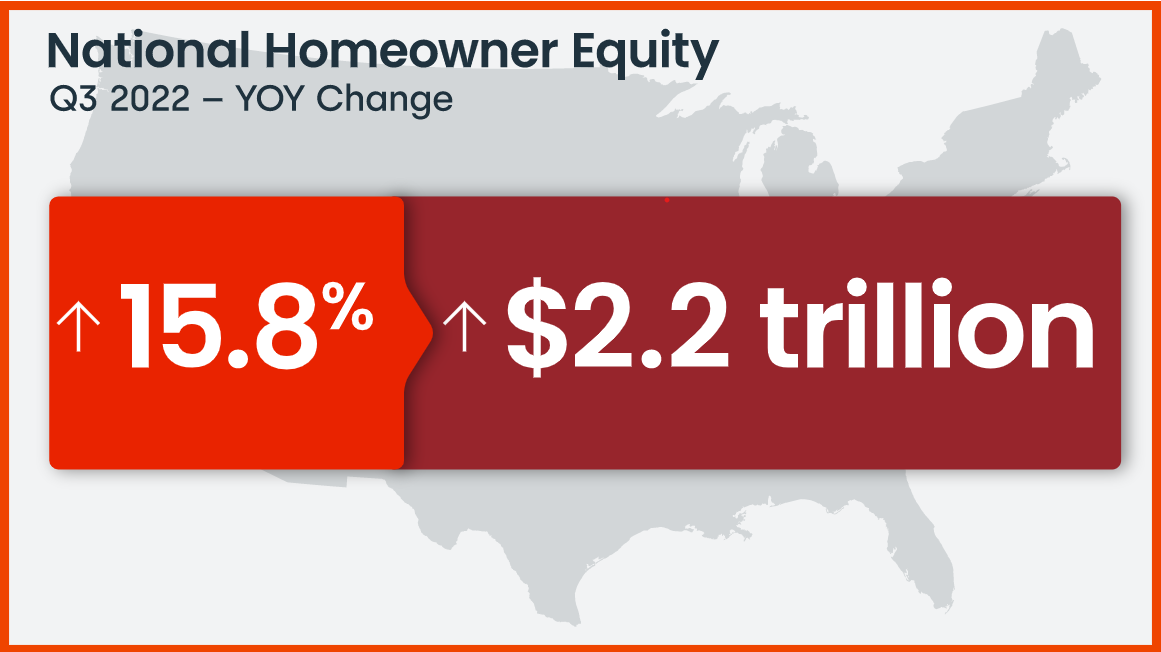
CoreLogic analysis shows U.S. homeowners with mortgages (roughly 63% of all properties*) have seen their equity increase by a total of over $2.2 trillion since the third quarter of 2021, a gain of 15.8% year over year.
*Homeownership mortgage source: 2020 American Community Survey.
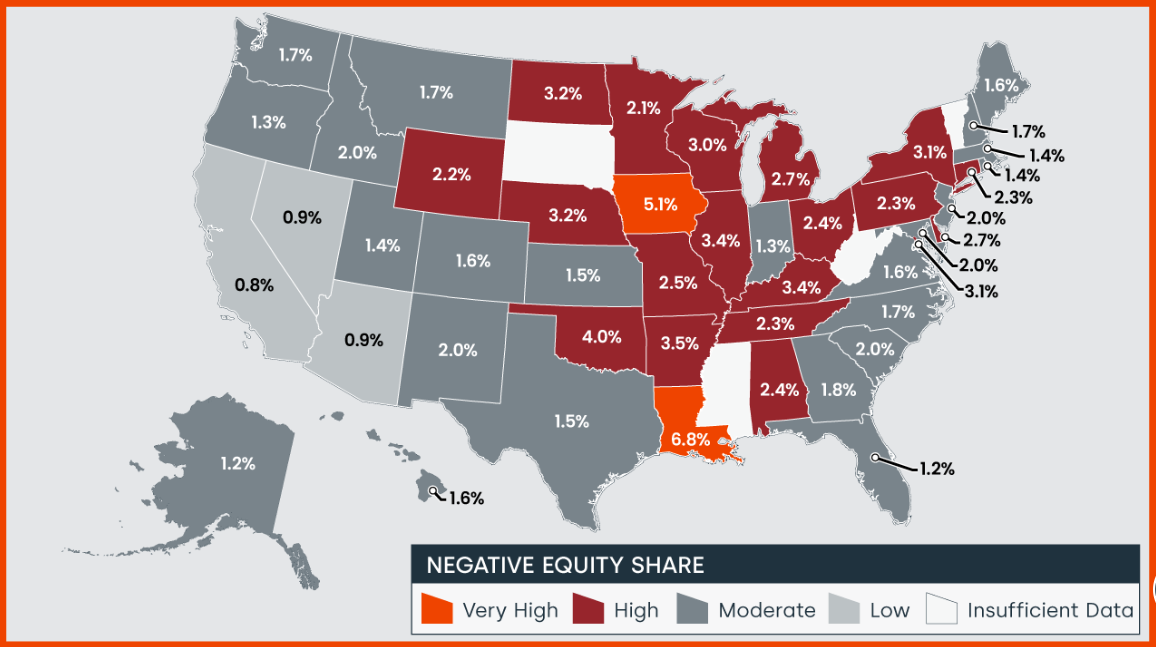
Negative Equity Down From Q3 2022
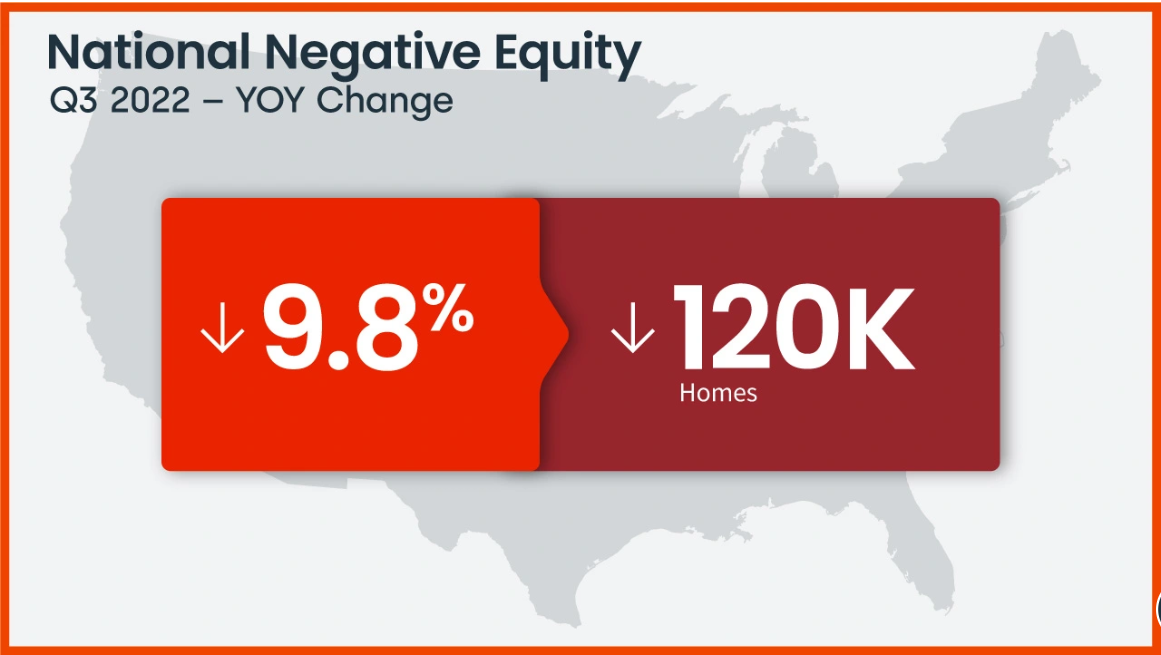
In the third quarter of 2022, the total number of mortgaged residential properties with negative equity increased by 4% from the second quarter of 2022 to 1.1 million homes, or 1.9% of all mortgaged properties. On a year-over-year basis, negative equity fell by 9.8% from 1.2 million homes, or 2.2% of all mortgaged properties, in the third quarter of 2021.
Because home equity is affected by home price changes, borrowers with equity positions near (+/- 5%) the negative equity cutoff are most likely to move out of or into negative equity as prices change, respectively. Looking at the third quarter of 2022 book of mortgages, if home prices increase by 5%, 127,000 homes would regain equity; if home prices decline by 5%, 172,000 would fall underwater. The CoreLogic HPI Forecast TM projects home prices will increase by 3.9% from September 2022 to September 2023.
U.S. Home Equity Gains Slow Sharply From Q2 to Q3
Nationwide, annual home equity gains began to slow in the third quarter of 2022, with the average borrower netting $34,300, compared with the nearly $60,000 year-over-year gain recorded in the second quarter and an additional 43,000 properties falling underwater. The quarter-over-quarter decline in equity is partially due to slowing home price growth across the country, as annual appreciation fell from about 18% in June to just slightly more than 10% in October. As home price gains are projected to relax into single digits for the rest of 2022, then possibly move into negative territory by the spring of 2023, equity increases will likely slow accordingly in some parts of the country.
National Aggregate Value of Negative Equity: Q3 2022
The national aggregate value of negative equity was approximately $317.7 billion at the end of the third quarter of 2022. This is up quarter over quarter by approximately $13.2 billion, or 4.3%, from $304.5 billion in the second quarter of 2022 and up year over year by approximately $37 billion, or 13.2%, from $280.7 billion in the third quarter of 2021.
Negative equity peaked at 26% of mortgaged residential properties in the fourth quarter of 2009, based on the CoreLogic equity data analysis which began in the third quarter of 2009.
“At 43.6%, the average U.S. loan-to-value (LTV) ratio is only slightly higher than in the past two quarters and still significantly lower than the 71.3% LTV seen moving into the Great Recession in the first quarter of 2010. Therefore, today’s homeowners are in a much better position to weather the current housing slowdown and a potential recession than they were 12 years ago. Weakening housing demand and the resulting decline in home prices since the spring’s peak reduced annual home equity gains and pushed an additional number of properties underwater in the third quarter. Nevertheless, while these negative impacts are concentrated in Western states such as California, homeowners with a mortgage there still average more than $580,000 in home equity.”
–Selma Hepp
Interim Lead of the Office of the Chief Economist
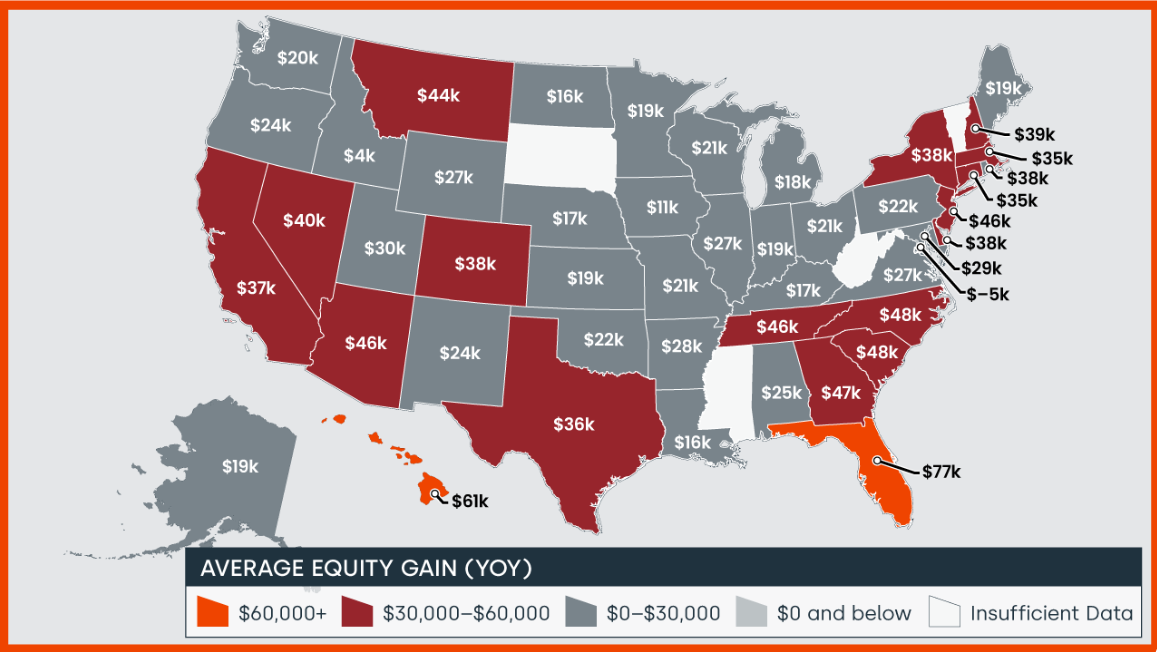
National Homeowner Equity
In the third quarter of 2022, the average homeowner gained approximately $34,300 in equity during the past year.
Florida, Hawaii and South Carolina experienced the largest average equity gains at $76,700, $61,500 and $48,000 respectively. Washington, D.C. was the only place in the country to see annual home equity losses, at $5,000.
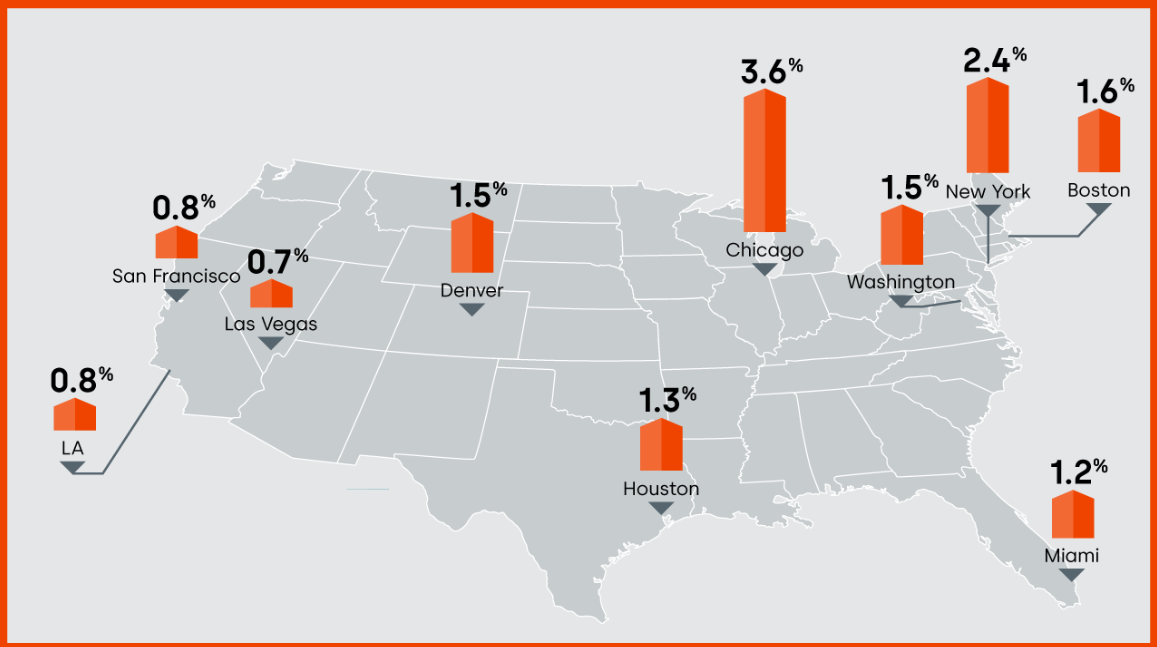
10 Select Metros Change
CoreLogic provides homeowner equity data at the metropolitan level, in this graphic 10 of the largest cities, by housing stock are depicted.
Negative equity has seen a recent decrease across the country. Las Vegas is the least challenged with the negative equity share of all mortgages at 0.7%, followed by Los Angeles and San Francisco (both 0.8%).
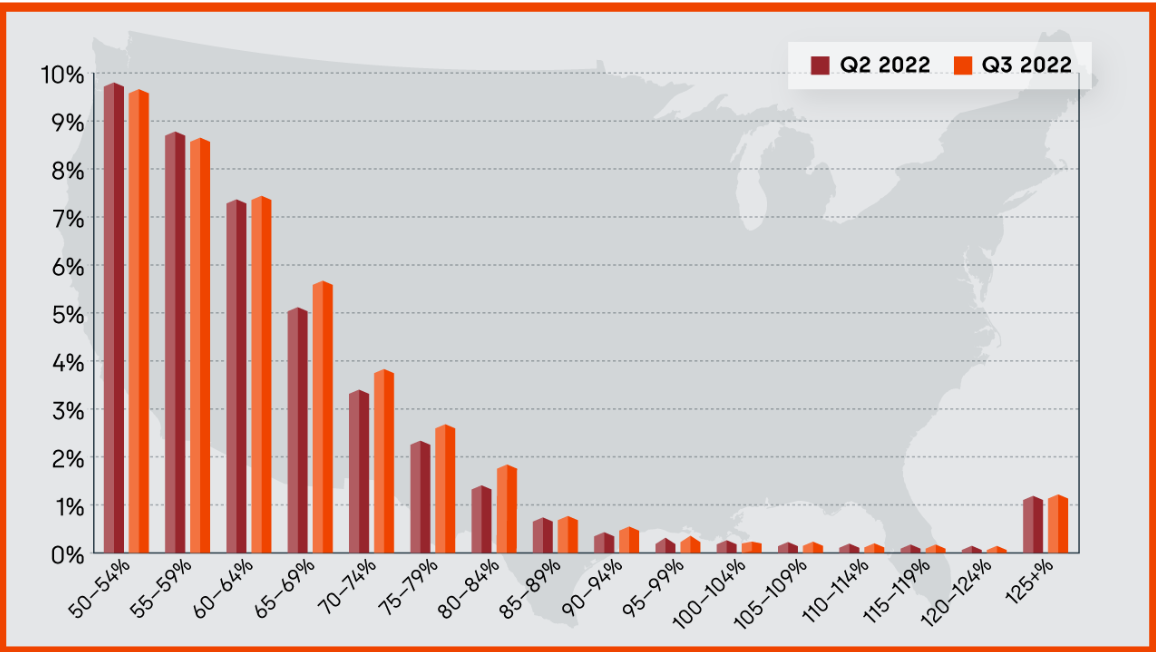
Loan-to-Value Ratio (LTV)
The graph represents National Homeowner Equity Distribution across multiple LTV Segments.
Summary
CoreLogic began reporting homeowner equity data in the first quarter of 2010; at that time, the equity picture for homeowners was rather bleak in the United States. Since then, many homes have regained equity and the outstanding balance on the majority of mortgages in this country are now equal to or in a positive position when compared to their loan balance.
To learn more about the data behind this article and what CoreLogic has to offer, visit https://www.corelogic.com/.


Sign up to receive our stories in your inbox.
Data is changing the speed of business. Investors, Corporations, and Governments are buying new, differentiated data to gain visibility make better decisions. Don't fall behind. Let us help.


Sign up to receive our stories in your inbox.
Data is changing the speed of business. Investors, Corporations, and Governments are buying new, differentiated data to gain visibility make better decisions. Don't fall behind. Let us help.