
Mega-investor activity dipped during the quarter, as did purchases made by iBuyers.
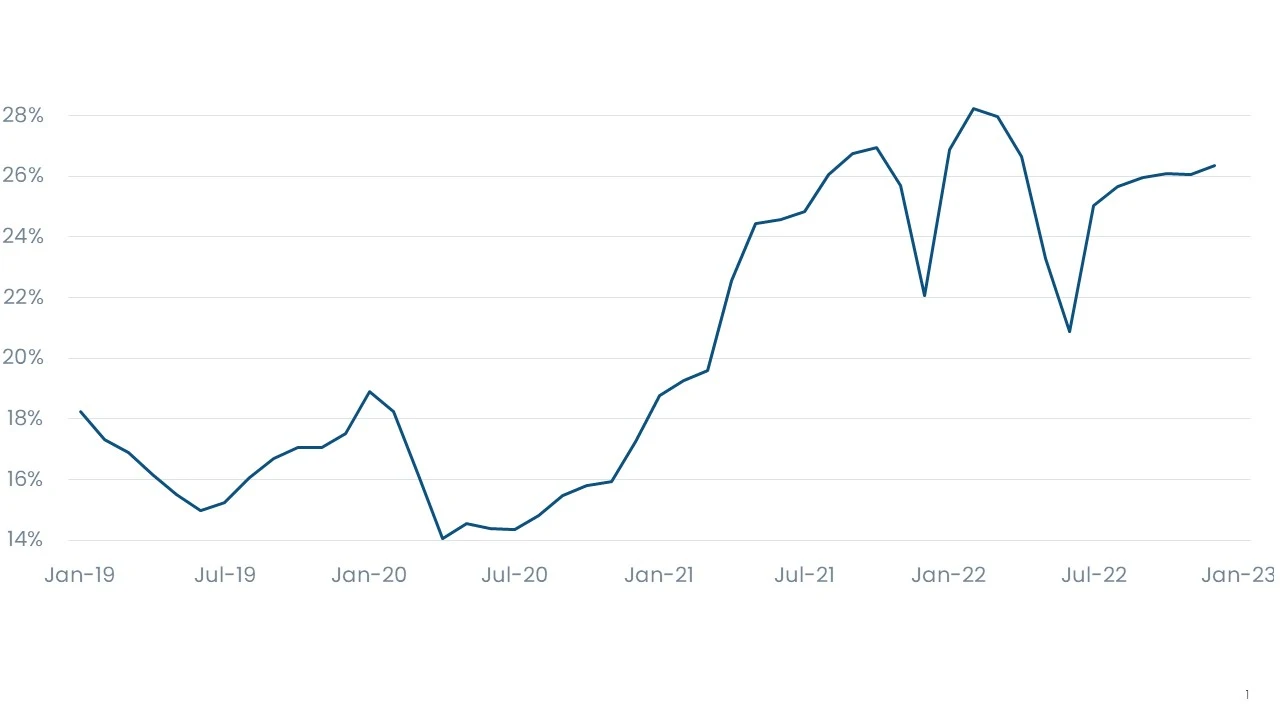
The share of single-family home purchases made by investors[1] held steady in the fourth quarter of 2022. After falling to 21% in June of last year, the share of investor purchases rose to 26% in September and has remained about the same since. Figure 1 shows that the investor share plateaued in the fourth quarter of last year at around 2 percentage points lower than its high of 28% in February 2022; however, this is still much higher than at any time pre-pandemic.
Figure 1: Share of Home Purchases Made by Investors by Month, January 2019 – December 2022
Examining the share of investor purchases is relative to non-investor[2] purchases. Sales levels show that the market in the fourth quarter of 2022 cooled for both investors and owner-occupied buyers. Figure 2 illustrates that the number of U.S. home purchases made by both investors and non-investors plummeted in the fourth quarter. During this period, investors purchased on average 81,000 homes, a 25% decline in activity compared with the fourth quarter of 2021.
However, fourth-quarter purchases align with the levels of investor activity seen in 2019 and 2020. Owner-occupied purchases, on the other hand, are well below the levels seen during those years. Overall, it appears that housing demand declined for both investors and owner-occupied buyers fairly evenly, with both likely deterred by high prices and elevated interest rates.
Figure 2: Monthly Home Purchases Made by Investors and Non-Investors, January 2019 – December 2022
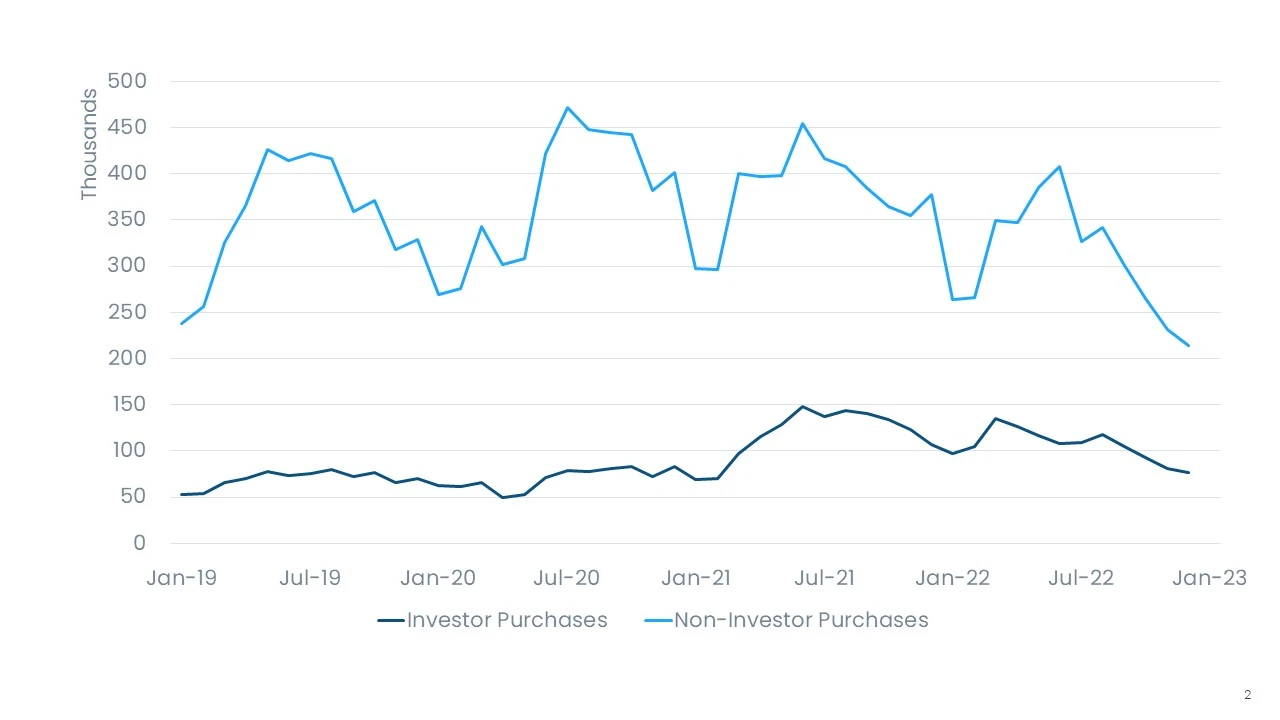
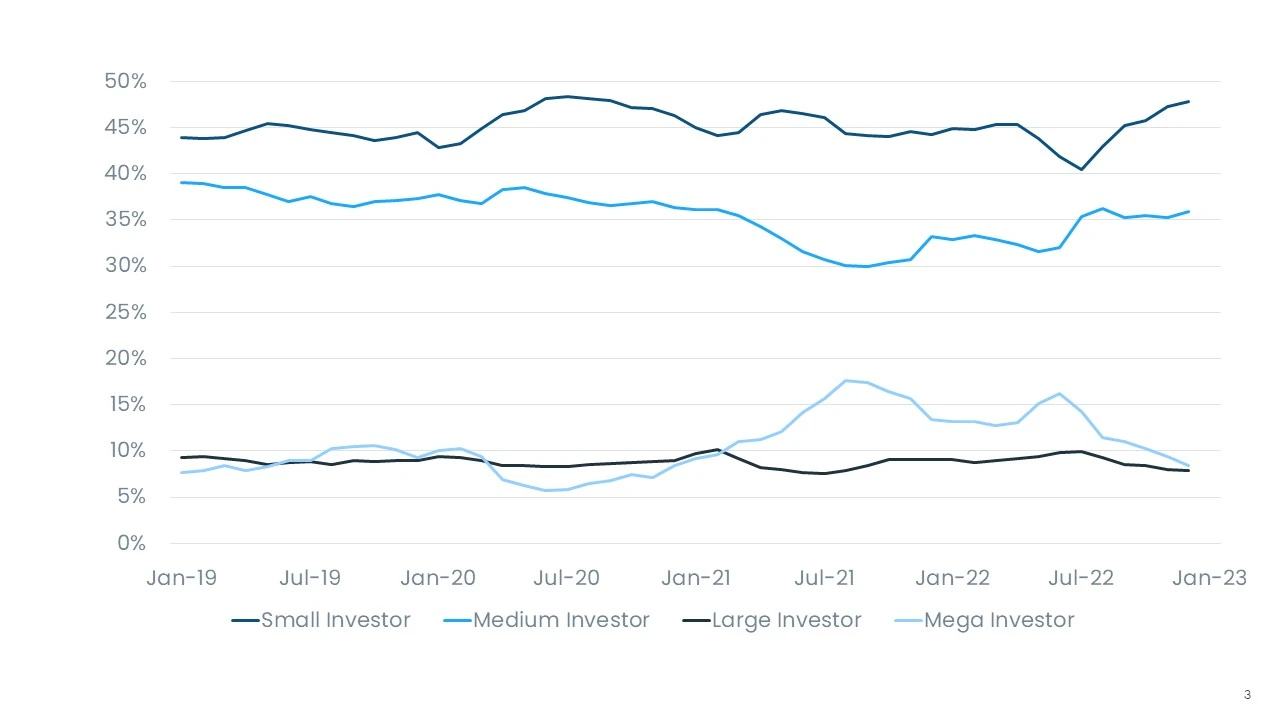
Figure 3 shows that mega-investors are retreating from the market relatively more quickly and that small investors (those who own fewer than 10 properties) are making up an increasingly bigger part of the investor share. Mega-investors’ share fell from 11% of investor purchases in September to 9% in December. In that same time frame, the small investor share rose from 45% to 48%. The medium investor share (those with 11 to 100 properties) remained steady, at around 35% of home purchases. Large investors (those with 101 to 1,000 properties) represented 8% of all investor purchases.
Figure 3: Share of Investor Purchases by Size, January 2019 – December 2022
However, Figure 4 shows that regardless of market share movement, activity greatly declined for all types of investors in the fourth quarter. In September, small investors purchased 47,000 single-family homes, compared with 36,000 in December. Medium investors made 32,000 purchases in September and 27,000 in December.
Large- and mega-investor activity also retreated throughout the quarter. In December, both of these groups made about 6,000 purchases. For mega investors, this is just over half of the 11,000 purchases made in September.
Figure 4: Monthly Home Purchase Levels by Investor Size, January 2019 – December 2022
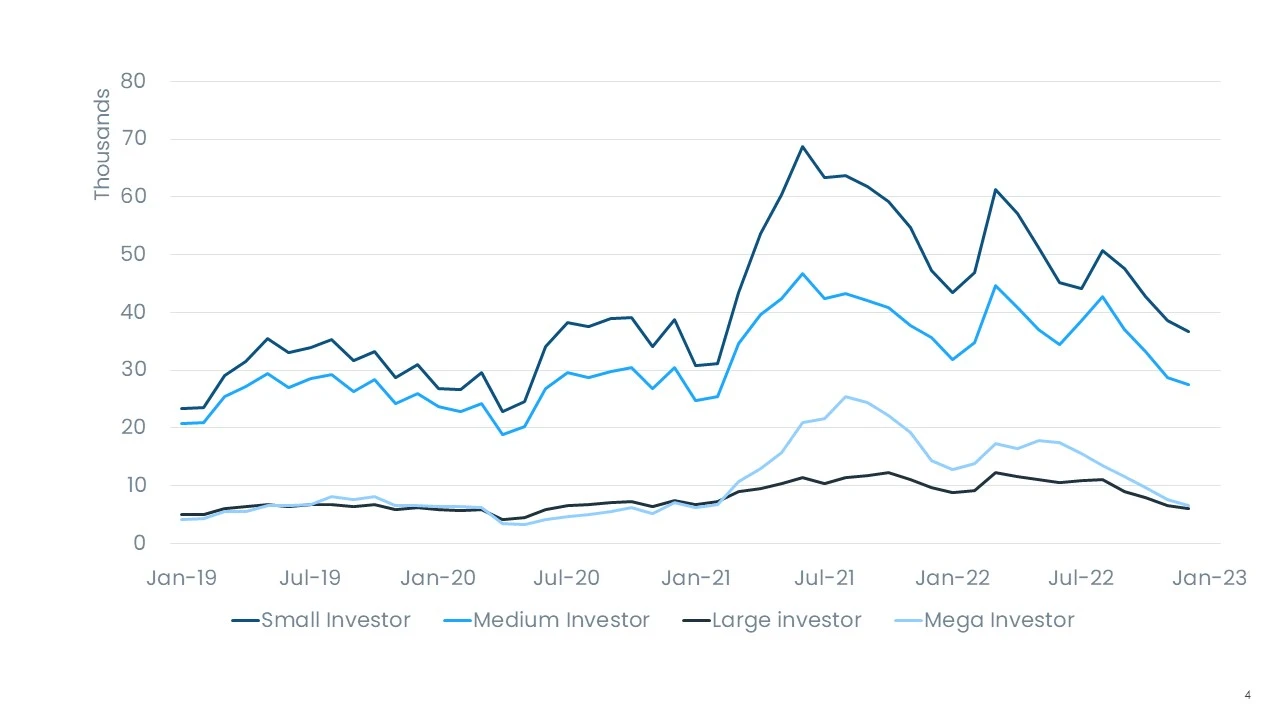
Figure 5 shows the share of homes purchased by investors that resold within six months since June 2022. Only 15.7% of homes purchased by investors in June had been resold by December, a number that is not that different from previous years.
Data through the second half of 2022 will likely show a decline in flipping. Home price growth began to fall in 2022, which makes flipping a home an uphill battle. In addition, CoreLogic’s Single-Family Rent Index shows that rents remain high but that the rate of growth is slowing considerably, meaning that most investors likely perceive holding properties to be a more favorable strategy than selling.
Figure 5: Share of Investor Purchases Resold Within Six Months, January 2019 – June 2022
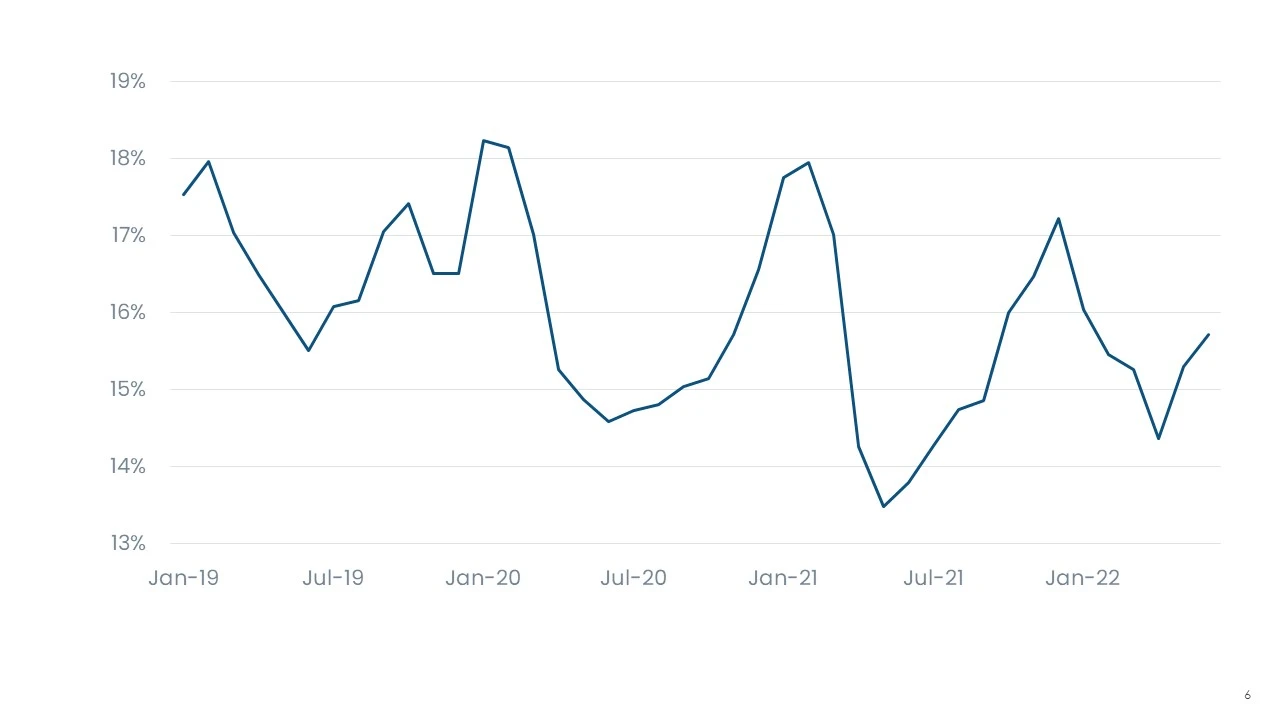
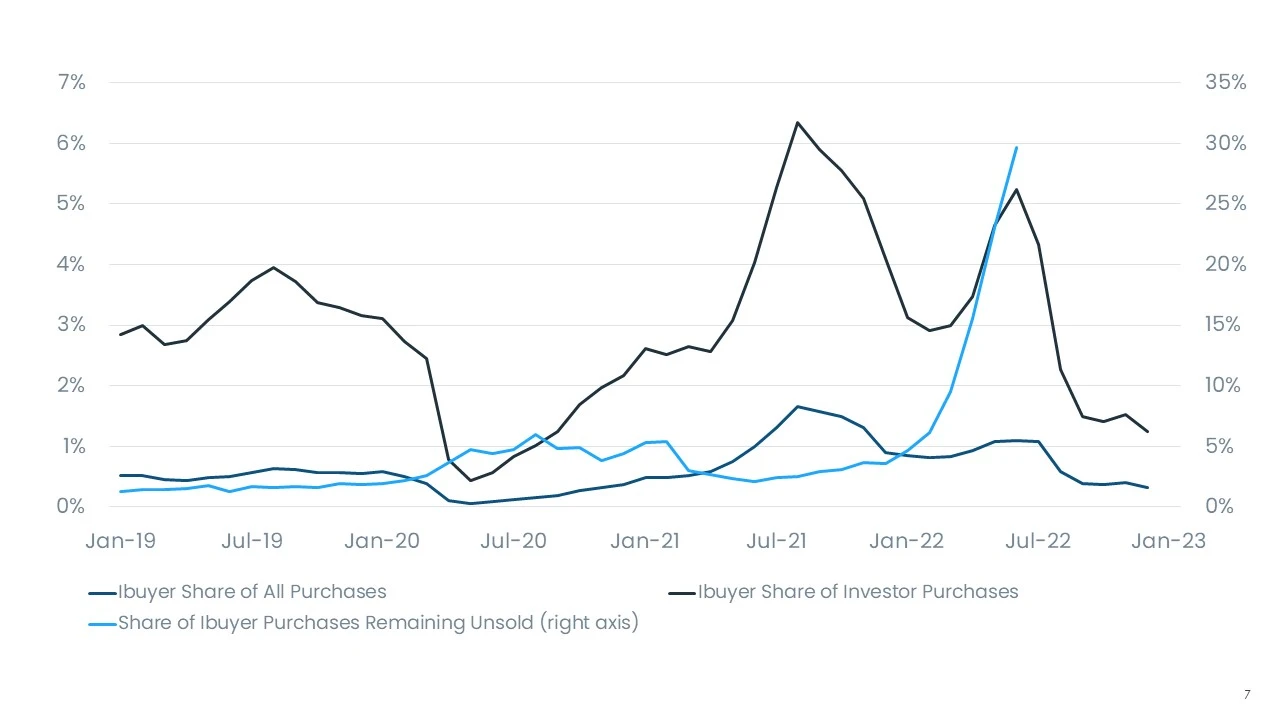
Figure 6 examines iBuyer market activity through December 2022. IBuyers made up 1.2% of all investor purchases in September, but that number dropped to 0.3% in December, a huge pullback from the record high 6% of iBuyer purchases in 2021.
Since iBuyers generally tend to flip homes and are reliant on home price appreciation, rental home price trends suggest that iBuyer activity will continue to decline, particularly given that iBuyers have still been struggling to resell the homes they purchased. Only 30% of such homes bought in June were resold by the end of the year, a clear sign that 2022’s mortgage rate hikes caused decreased demand from traditional buyers.
Figure 6: IBuyer Market Activity, January 2019 – December 2022
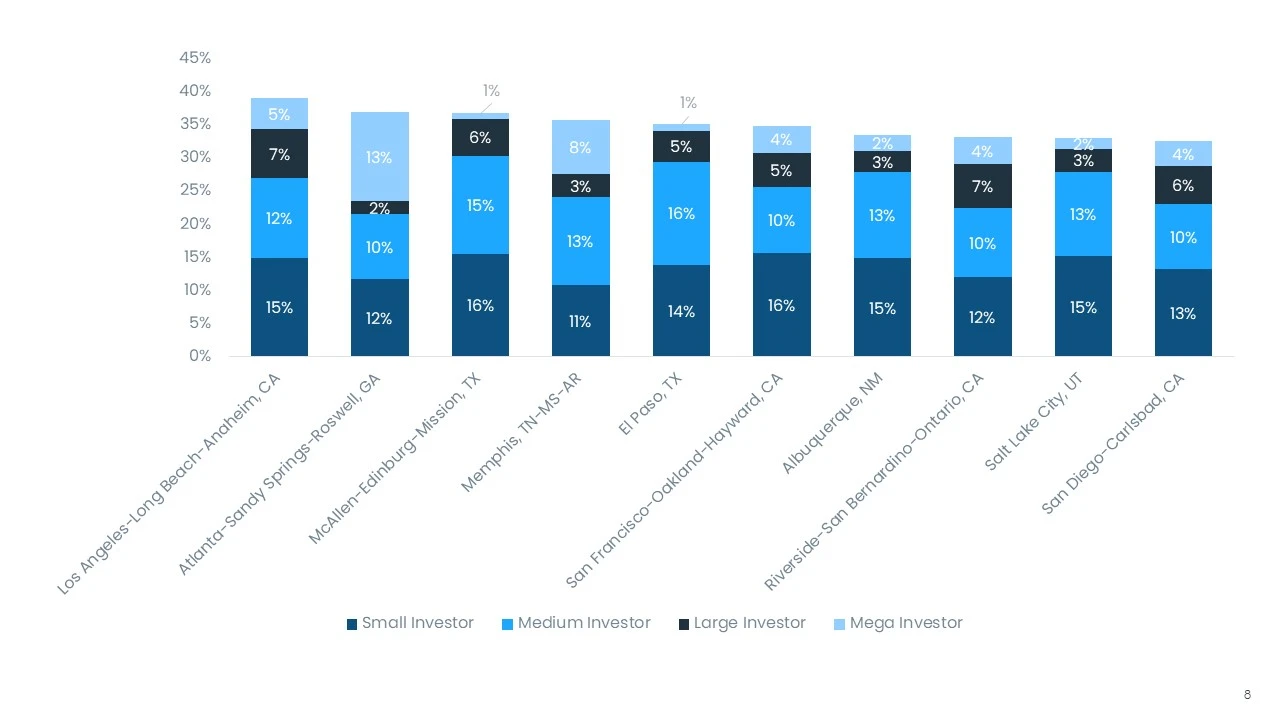
By region, the investor share was highest in Western Metropolitan Statistical Areas (MSAs) in the fourth quarter despite the home equity losses seen in the region as home prices fell. Figure 7 shows the 10 MSAs with the highest shares of investor purchases, including four California metros. The other MSAs in the top 10 are located in the southern or western U.S., which is consistent with patterns previously observed.
Atlanta’s mega investor presence has kept it in the top 10. It is the only MSA where mega investors made up more than 10% of purchases in the fourth quarter 2022. Aside from Memphis, no other MSA in the top 10 investment markets has a corresponding number of more than 5%, which makes Atlanta a major outlier.
Figure 7: Highest 10 Investor Shares by MSA, Q4 2022
As spring arrives, investor share should fall as owner-occupied buyers move back into the market. That said, investor activity appears to be settling into a pattern where the average share sits between 22% and 26%, close to numbers recorded before the pandemic. The big question in 2023 will be whether investor activity keeps pace with owner-occupied buyers.
Though home price growth has dropped since its peak, interest rates remain high enough that homes are still substantially more unaffordable than they were only a year ago. If this trend continues, rental demand should remain strong, and home investors should be able to mitigate elevated interest rates by paying with cash or making higher down payments. The last couple of years have proved volatile, but fundamentals point to investors maintaining a significant share of the real estate market.
To learn more about the data behind this article and what CoreLogic has to offer, visit https://www.corelogic.com/.


Sign up to receive our stories in your inbox.
Data is changing the speed of business. Investors, Corporations, and Governments are buying new, differentiated data to gain visibility make better decisions. Don't fall behind. Let us help.


Sign up to receive our stories in your inbox.
Data is changing the speed of business. Investors, Corporations, and Governments are buying new, differentiated data to gain visibility make better decisions. Don't fall behind. Let us help.