The total number of claims among the entire GLP-1 class of diabetes and obesity drugs grew rapidly in the past four years according to Earnest claims data; growing 4x in the past four years with particular accelerated growth in the past several months. February 2023 alone saw growth of 78% YoY, up from \~50% YoY in 2022 and \~30% YoY in 2021. As a sign of continued growth, new-to-brand prescriptions accelerated in 2H22, and now constitute 16% of prescription claims, up from a relatively steady \~10% in the past.
Customers are returning to major theater chains Cinemark, Regal, AMC, and Marcus, but they aren’t going at the same time as before the pandemic. Overall theater visits fell to nearly zero in the early months of Covid-19 in 2020. As theaters reopened in geographies with varying levels of restrictions and work-from-home adoption, the time of day people visited those theaters also changed.
Through the first 26 days of the tax filing season, the average refund size is down 7% YoY to $2,377 in Earnest Analytics’ IRS Payments dashboard, in-line with reported figures**. The IRS began accepting and processing tax returns on January 23, 2023 and Americans have until April 18, 2023 to file. As the tax season kicked off, the IRS warned taxpayers should expect smaller refunds in 2023 relative to 2022 due tax law changes such as the elimination of the Advance Child Tax Credit and Recovery Rebate credit to claim pandemic stimulus payments.
On Nov 3rd, Netflix launched its lower priced and first ever ad-supported plan at $6.99 per month. Its three other streaming plans are all ad-free; the lowest priced “Basic” plan at $9.99 per month. As of January 31st, 2023, the plan has barely made a dent in the composition of subscribers, according to Earnest’s Orion spend data. The new ad-supported plan constituted 0.46% of total subscribers, slightly up from 0.33% in December, but barely noticeable among its overall streaming plan composition of Premium’s 45% share, Standard’s 43% share, and Basic’s 11% share.
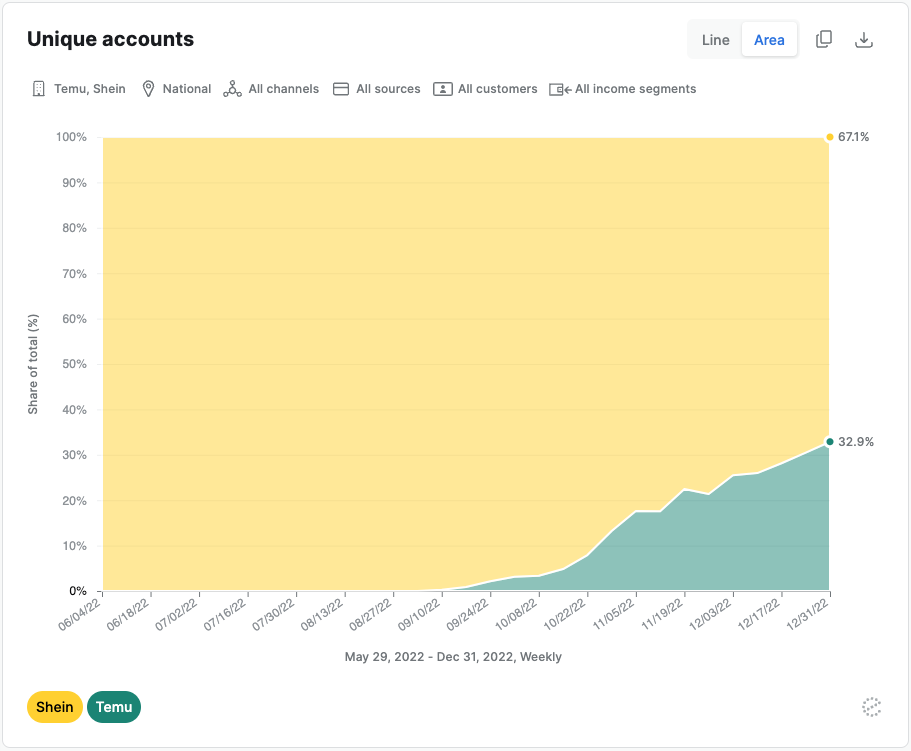
Chinese-owned discount online marketplace Temu reached half as many weekly active users as the largest US fast fashion brand Shein in only three months according to Earnest’s Vela transaction data. The Pinduoduo owned newcomer to the US market achieved customer growth levels that took Shein four years and a pandemic to reach. Temu offers basement bargains for everything from Lenovo earbuds to 99 cent holiday outfits. Its market entrance comes on the heels of hyper-discounted and social media hyped fast fashion brand Shein’s rise.
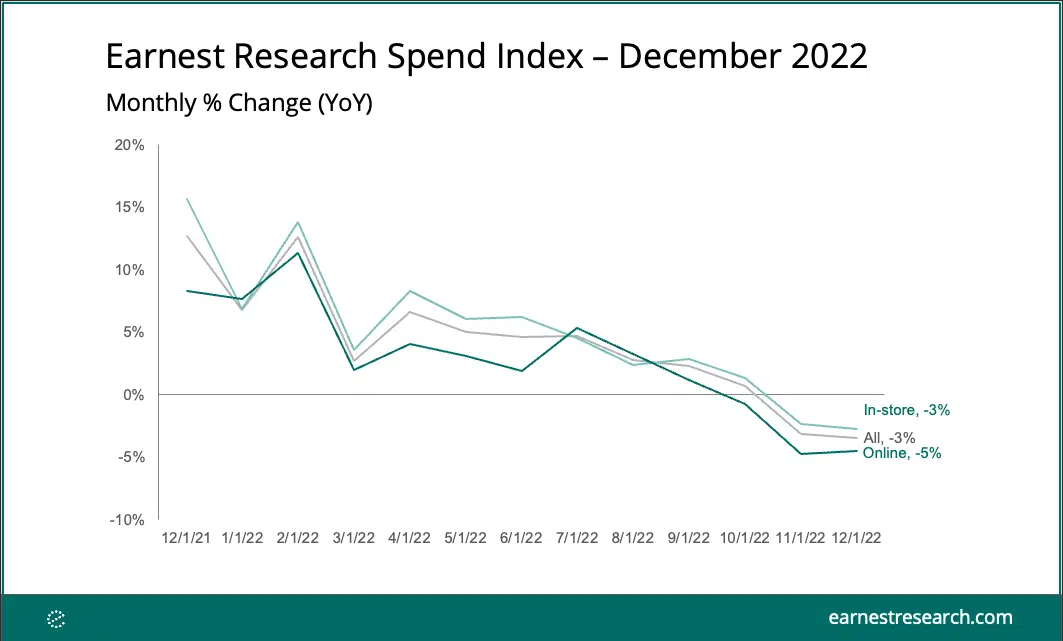
Earnest Analytics Spend Index powered by Orion transaction data decelerated in December, as a deceleration in In-store more than offset a slight Online acceleration. Gyms, Workout Classes, Garden & Outdoor, and Air Travel grew fastest in the month. Active & Athleisure, Off-Price Department Stores, Footwear, Sports Gear, and Casual Dining also stood out with the fastest acceleration since November.
Consumer holiday spending measured by the Vela credit and debit card data in Earnest Analytics Spend Index (EASI) increased 5.9% YoY in 2022, a stark contrast from the significant demand growth experienced in the 2021 holiday season but relatively in-line with historical periods as multi-decade high inflation continues to benefit nominal growth. In 2022, holiday spending growth was driven by similar levels of transaction and average ticket growth, though transaction growth was much lower than pre-pandemic levels, a potential sign that inflation continues to squeeze consumer budgets.
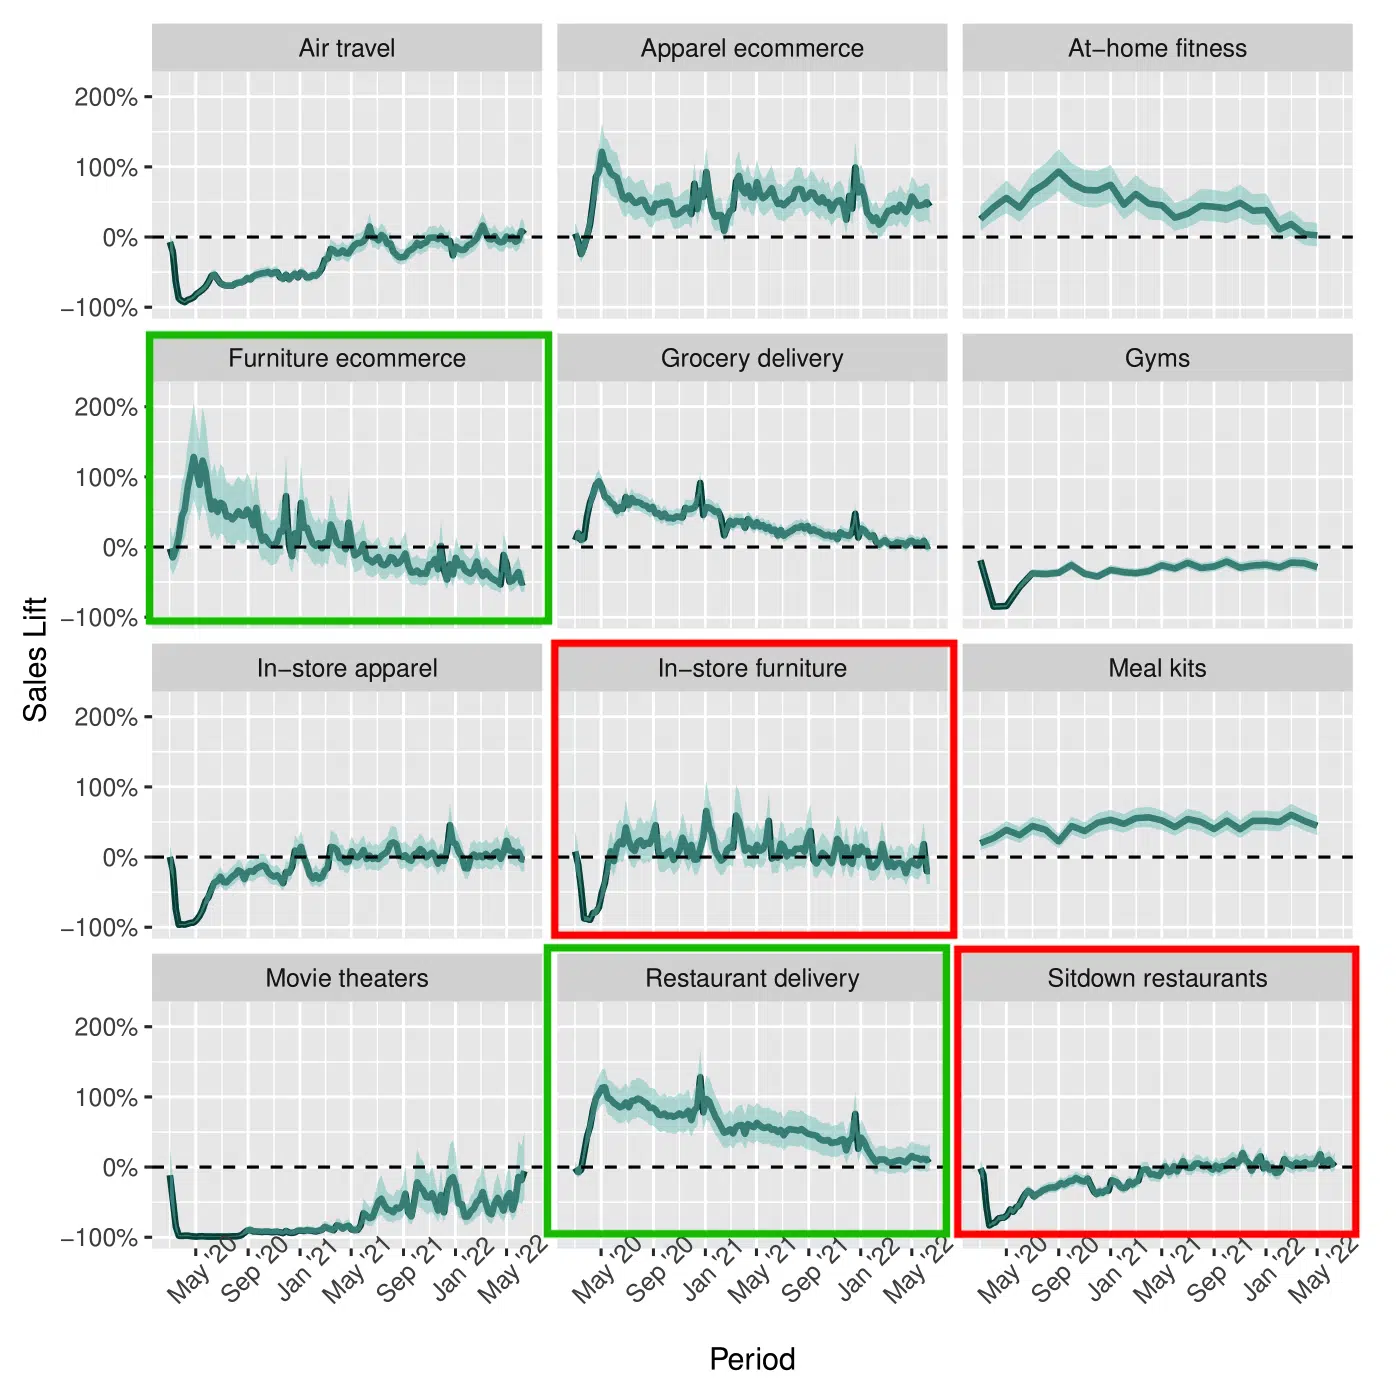
The COVID-19 pandemic disrupted consumer spending patterns in countless ways, driving us away from crowded venues and retail stores towards at-home alternatives such as delivery and e-commerce services. Our paper uncovers the short- and long-term impacts of COVID across 12 categories, revealing not only the effects of the pandemic immediately after its onset, but how those effects have evolved as we move into the “new normal.” We do so by first predicting what category-level activity would have been in the absence of the pandemic in these 12 categories, then comparing what consumers actually spent to this “no-pandemic baseline.”
Consumers with credit card debt outspent at non-discretionary retailers as much as, if not more than, discretionary retailers, which continued into the holiday season. Driving this increase could be depletion of stimulus check payments. Government assistance during the pandemic initially buoyed debt paydowns in 2020 and 2021, possibly depressing spending by former debt-holders. Now that most stimulus programs are over, consumers are again increasingly moving into debt.
The Earnest First Choice Retailer Rankings are based on the credit and debit card spend of millions of de-identified U.S. consumers from the Orion spend panel. Earnest identifies each shopper’s First Choice Retailer by comparing their spend across 1000 retailers between Thanksgiving and Cyber Monday. For example, if Shopper A spent $70 at Amazon, $50 at Walmart, and $30 at Target, their First Choice Retailer would be Amazon.
Consumer spend growth measured by the Vela credit and debit card data in Earnest Analytics Spend Index (EASI) decelerated to 5% YoY in the first 16 days of the holiday shopping season (starting Nov. 1). This was notably slower than early holiday 2020 and 2021 shopping season levels at 11% YoY and 19% YoY, respectively, and slightly lower than 2019’s 7% YoY growth rate.
Low-income consumers are moving their wallets to dollar stores according to Earnest Analytics’ credit and debit card data in the face of high inflation. Spending by households making under $55k per year at national dollar store chains like Big Lots (BIG), Dollar General (DG), Dollar Tree (DLTR), Five Below (FIVE), and Olli’s Bargain Outlet (OLLI) materially outgrew spending across other major categories since April. Hobbies & Toys, Health & Beauty, Supermarkets, Home Furnishings, Household Goods, and Home Improvement.
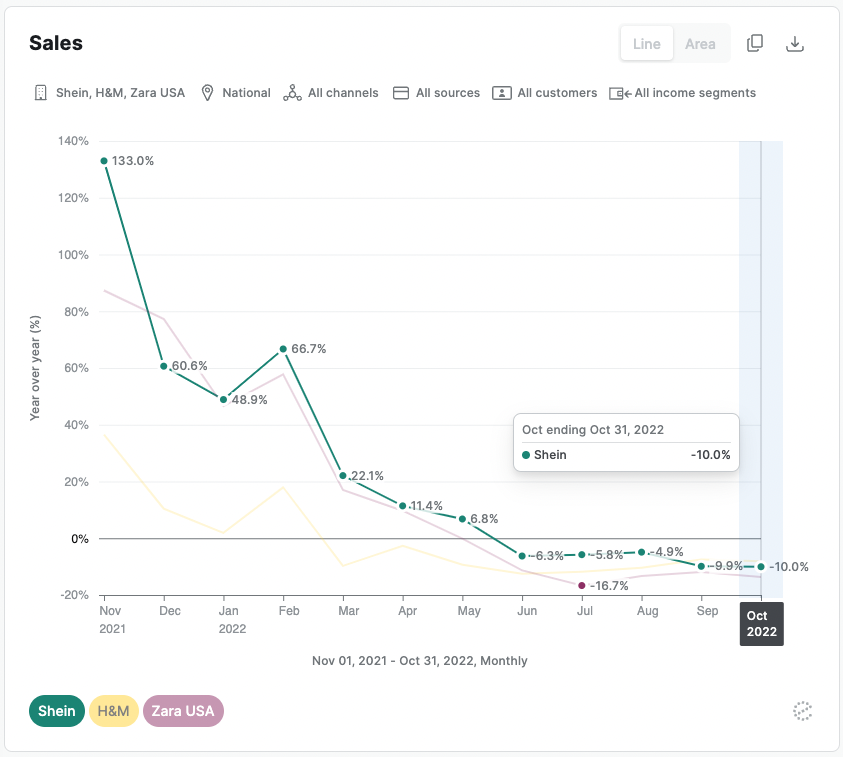
An overall slowdown in fast fashion growth is catching up to Shein. The ecommerce retailer experienced five consecutive months of US slowing sales according to credit and debit card data. Shein maintains its market dominance, with 30% share in October, as rival fast fashion retailers H&M and Zara experienced in-line sales declines. The sales slowdown is a huge reversal for a company that grew double digits in the first five months of 2022. Before that, Shein unseated H&M and Zara during the pandemic to become the largest US fast fashion retailer by sales.
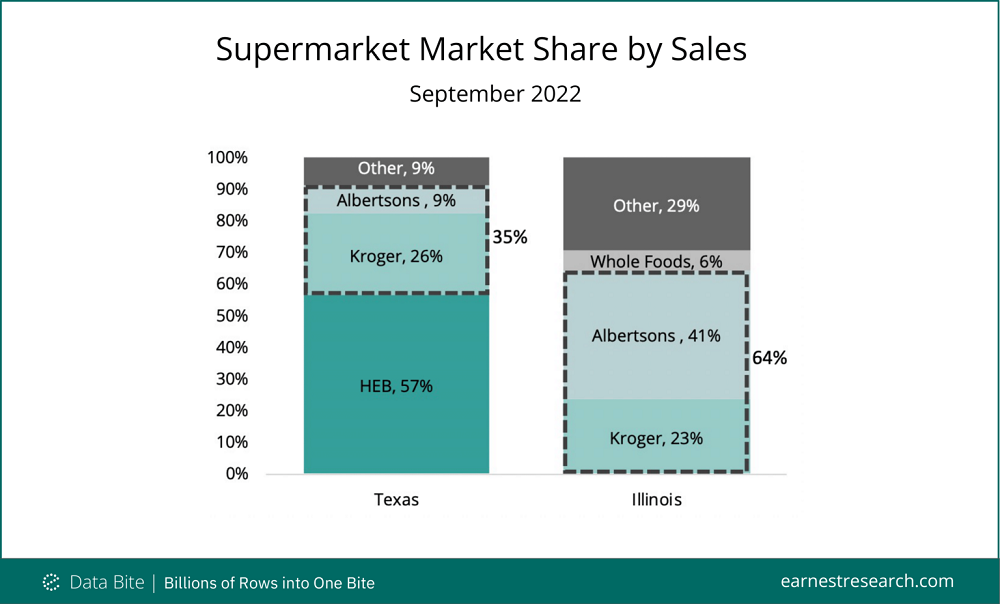
Albertson’s (ACI) short run as a public company may be coming to a close as it enters talks to merge with the nation’s second largest grocer and largest supermarket chain, Kroger (KR). However, the companies must first prove to regulators that their combined footprint is not a threat to a competitive economy. According to Earnest spend data, the biggest sales overlaps are in Texas and Illinois.
Back to school spending fell 8.6% YoY at key retailers* for the 8 weeks ended September 14, 2022. This is an improvement from the 10.0% YoY decline at the start of the season (four weeks ending August 17th) in states where class had begun. Most notably, spending was materially slower than the largely flat growth during the pre-pandemic 2019 season.
Back to school spending in states where class is back in session** fell 10% YoY at key retailers* for the 4 weeks ended August 17, 2022 as schools reopened in a challenging inflationary environment. The decline comes after the initial shock of pandemic-driven remote learning in 2020 drove a similar 10% YoY decline, while assistance in the form of child tax credit payments in 2021 pushed growth near 25% YoY. Growth during this key spending period in August 2022 is a full 30 points slower than in 2021. Pre-pandemic back to school spending was largely flat during the same period in 2019.
Earnest data exhibited supermarket spending growth of 5.3% YoY in July, boosted by 7.1% growth in average ticket, offset by a 1.7% decrease in the number of transactions. Ticket growth was yet another acceleration from the 6.2% YoY growth in June; similarly, the transaction decline was another slowdown from -0.9% in June. With price levels on the grocery shelf not seen since March 1979 (Food at Home prices increased 13.1% in July, up from 12.2% in June according to the latest BLS figures) forcing some to trade down into value-oriented items, shoppers may find a better deal by switching to more budget-friendly grocers
Earnest Research transaction data captures consumer credit and debit card activity across thousands of companies and dozens of categories. As a result the data paints a picture of total consumer spending on most goods and services. See methodology note at the end for wallet share calculation explanation. Consumers spent over 6% of their total monthly wallet at Big Box retailers such as Walmart and Target in June 2022, followed by Supermarkets (Kroger, HEB, Publix, etc.), Online Marketplaces (Amazon, eBay, etc), and Gas Stations.
Inflation grew at a historical 7.9% in February 2022, as manufacturers passed along higher input costs as a result of higher demand and the conflict in Ukraine. However, not all brands increased prices at the same rate, leading to sudden market share changes across CPG and other retail categories, including cereal. General Mills ($GIS) topped major hot and cold cereal brands in price increases in March. Market share by sales shifted towards brands with higher price increases… but share of total units sold favored brands with mid to lower price increases
Annual federal tax refunds have been a reliable source of additional spending cash for American taxpayers. Covid-19 upended the regular February-April cadence of payments as many households received additional stimulus payouts and tax credits that almost doubled the amount normally deposited by the government. This tax season marks a return to more normal refund behavior, which could signal sales declines for retailers who benefited from consumers’ extra cash in 2020 and 2021.