
In the spring of 2020, as lockdowns and remote work began, home purchases shifted to areas farther from city centers, but that trend may be reversing
In the spring of 2020, downtown areas became unattractive places for many people because of the emergence of COVID-19. The economic shutdown meant that urban cores lost their lifestyle value, remote work meant they lost their commuting value and physical distancing stripped them of their social value. These factors, among others, led to a flight from dense urban areas, both to the suburbs and beyond.
Figure 1 shows the average distance (in miles) of a home purchase from the closest downtown metro area from January 2018 to September 2022. From 2018 to early 2020, the average home purchase was around 44 miles from downtown areas, but by December 2020, the average home purchase peaked at 47 miles from downtowns. This outward movement is the product of Americans’ reluctance to visit densely populated areas throughout most of 2020.
Figure 1: Average Distance (Miles) of Home Purchase from Nearest Metro Center
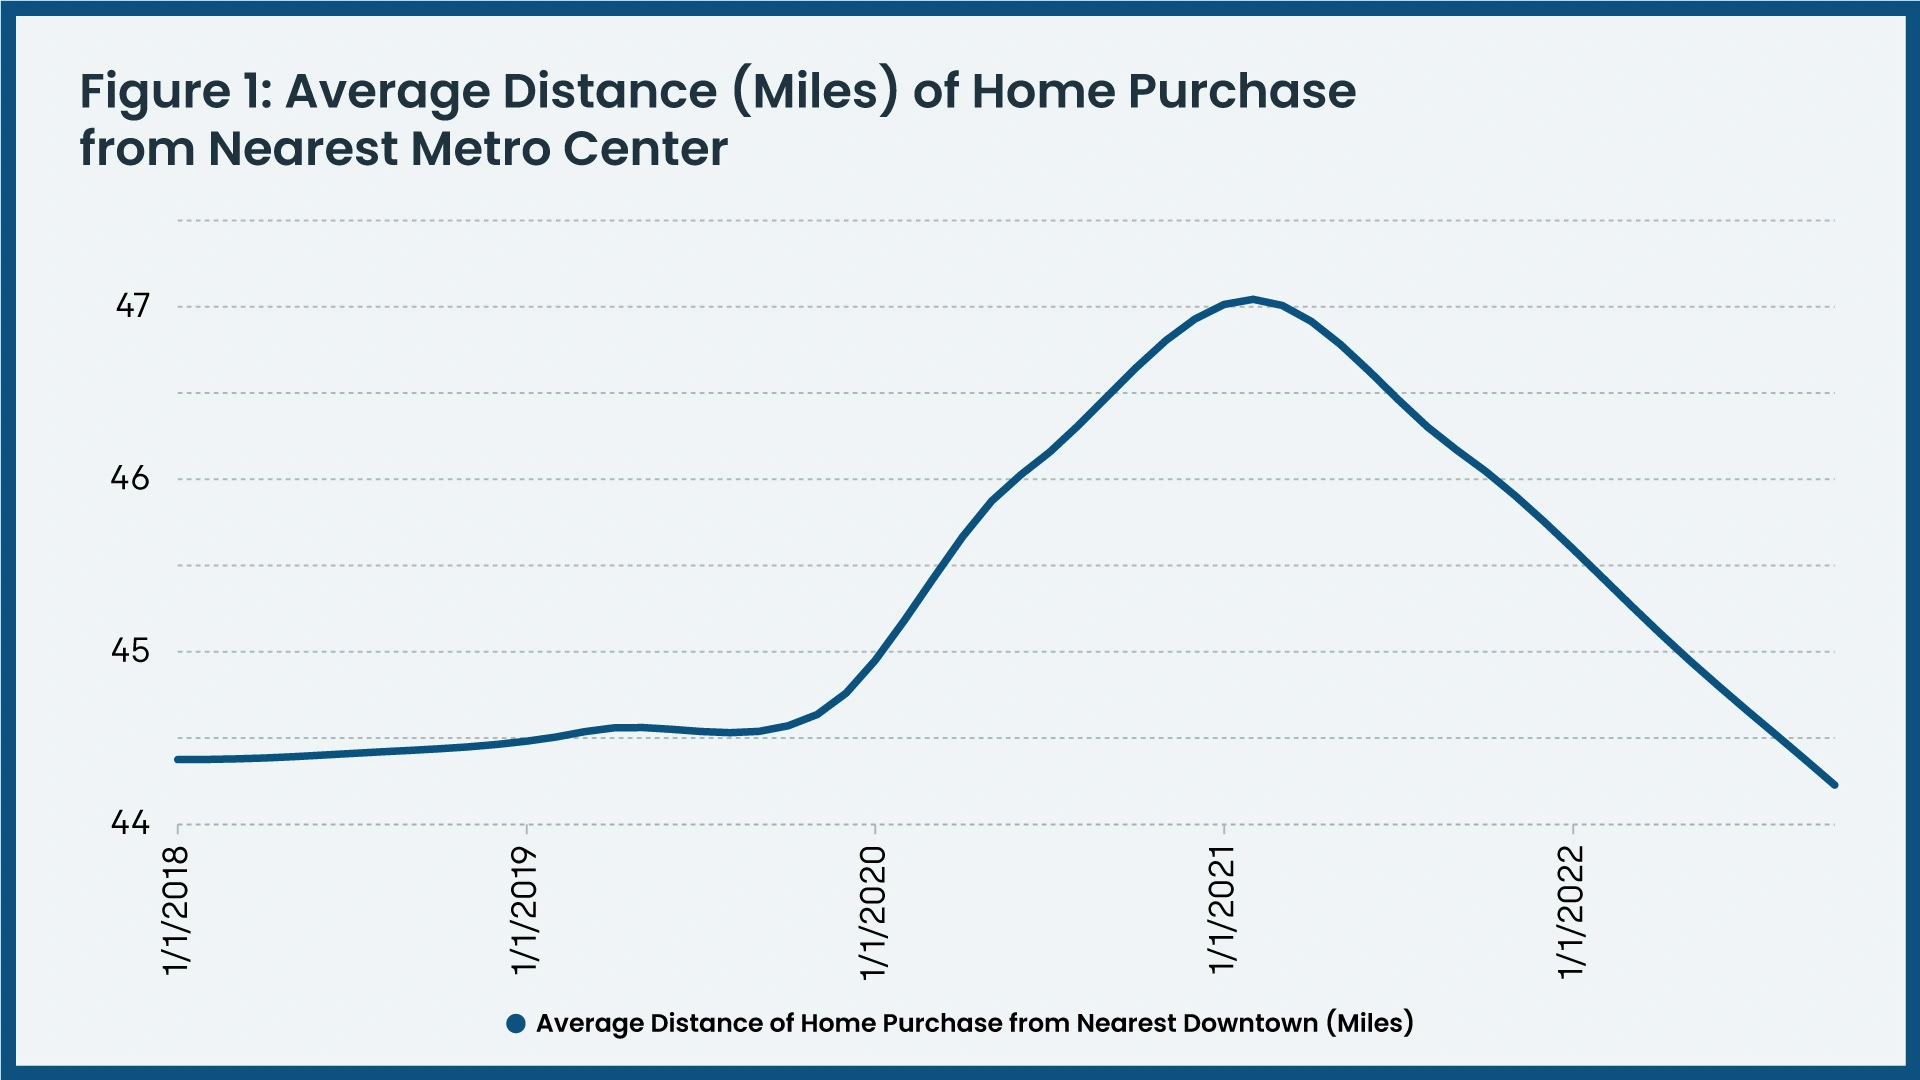
Figure 2 further shows this trend by dividing sales into the density of ZIP codes. The top line indicates homes that lie within the densest one-third of ZIP codes in a metro area, the middle line (bright blue) shows the second-densest one-third and the bottom line indicates those that lie in the least-dense one-third. There is a spike during 2020, where the least-dense ZIP codes went from accounting for an average of 28% of sales to 30% of sales. This change came largely at the expense of the densest ZIP codes, which fell from 36% to 34% of sales during that time period. This mirrors the information in Figure 1 and reflects the flight from highly populated areas during the first wave of the pandemic.
Figure 2: Share of Purchases by Density of ZIP Codes (1 = Most Dense in Metro Area, 3 = Least Dense in Metro Area)
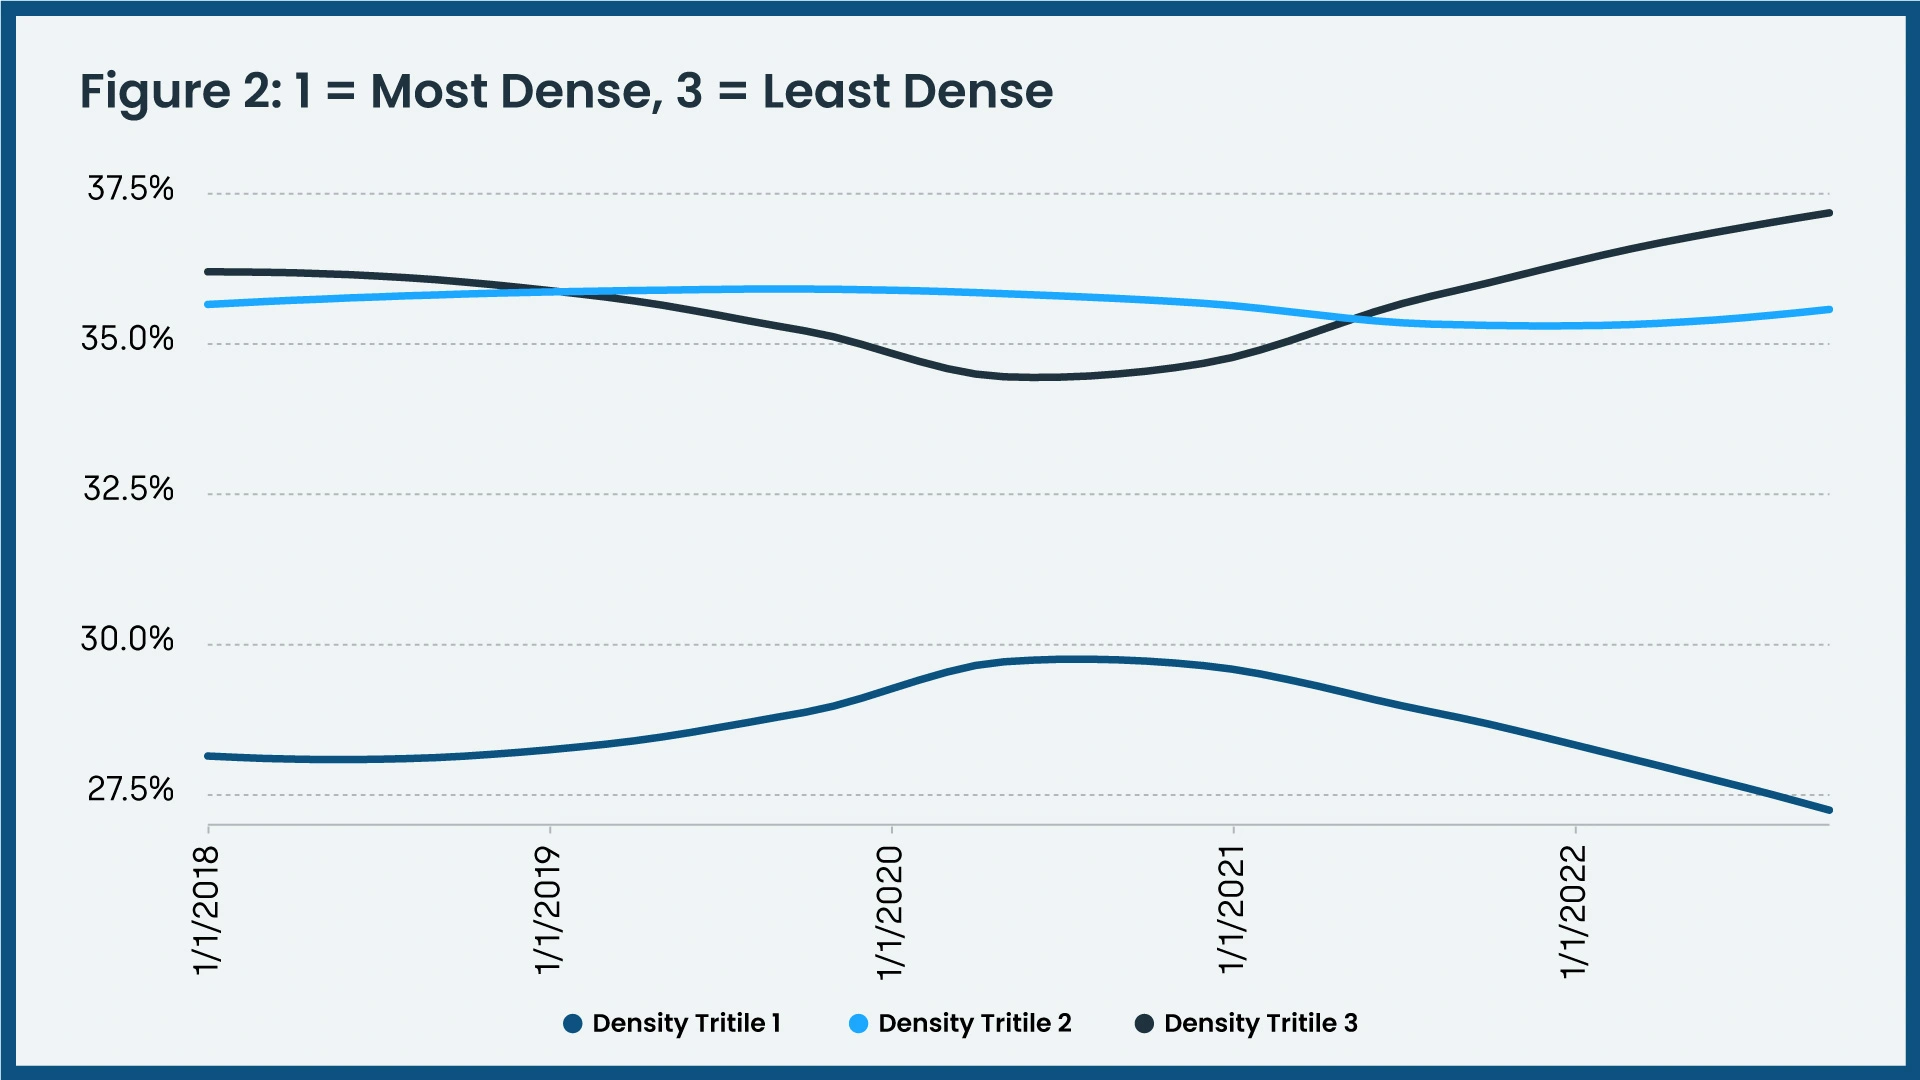
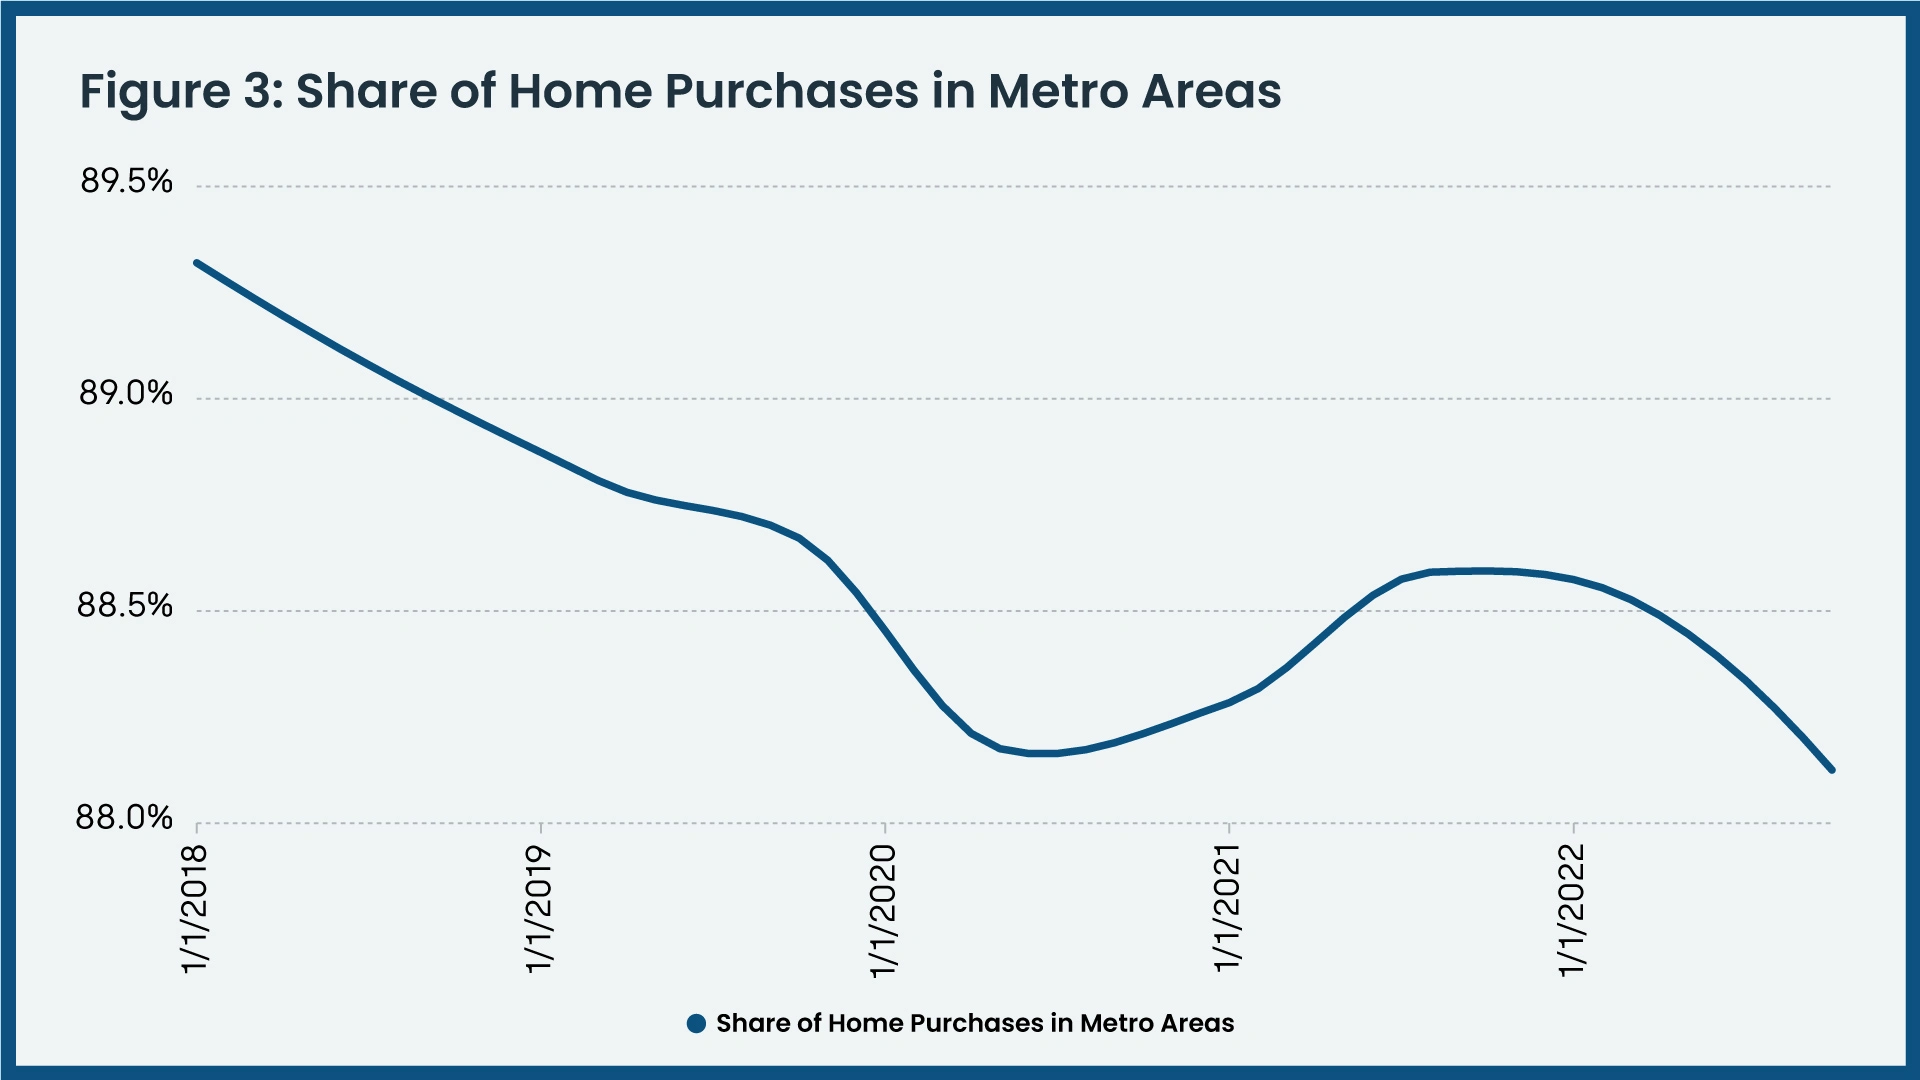
Figure 3 shows that homebuyers went beyond the suburbs and into rural areas. The line illustrates the share of sales that occurred within metropolitan areas (versus micropolitan and rural areas) from January 2018 to September 2022. The steep dip during 2020 again shows the impact of the pandemic on the pattern of housing sales. Many people who did not need to be in an office or work on-site chose to work from entirely remote locations, as outdoor amenities such as hiking, surfing or skiing became increasingly attractive. This is why smaller vacation communities, such as Hailey, Idaho; Key West, Florida and Summit Park, Utah were among the biggest leaders in home growth equity during 2021.
Figure 3: Share of Home Purchases in Metro Areas
Figures 1 through 3 also show that the exodus from dense cities hasn’t lasted. All three charts point to some reversal of previous trends, and it is possible that the preference for remote living that the pandemic caused is beginning to fade. Bars and restaurants are back open, social distancing is largely a thing of the past and at least some workers have returned to offices.
There are other forces at play, however, and the preference for more far-flung locations may not have changed. Home prices increased at all-time levels between 2018 and 2022. This may mean that preferences for large suburban and exurban homes still exist but that many buyers can’t afford such properties and must choose smaller homes closer to urban centers.
Furthermore, the timing of migration from dense areas dovetails with a rise in first-time homebuyer activity. It is very possible that many Americans bought suburban homes, given that they knew interest rates were as low as they might ever be, and thus made the move to outward-lying areas that many people make as they age. If this is true, we would expect to see an absence of younger, first-time homebuyers in the next few years who reorient purchase patterns closer to downtown areas.
To learn more about the data behind this article and what CoreLogic has to offer, visit https://www.corelogic.com/.


Sign up to receive our stories in your inbox.
Data is changing the speed of business. Investors, Corporations, and Governments are buying new, differentiated data to gain visibility make better decisions. Don't fall behind. Let us help.


Sign up to receive our stories in your inbox.
Data is changing the speed of business. Investors, Corporations, and Governments are buying new, differentiated data to gain visibility make better decisions. Don't fall behind. Let us help.