
Global exports of liquefied natural gas in June totaled approximately 28.2 million tons on board 472 vessels, much lower than June 2019’s pace of 29.3 million tons. Approximately 27.6 million tons arrived on 447 vessels at import terminals in June, compared to 29.5 million tons in June 2019.
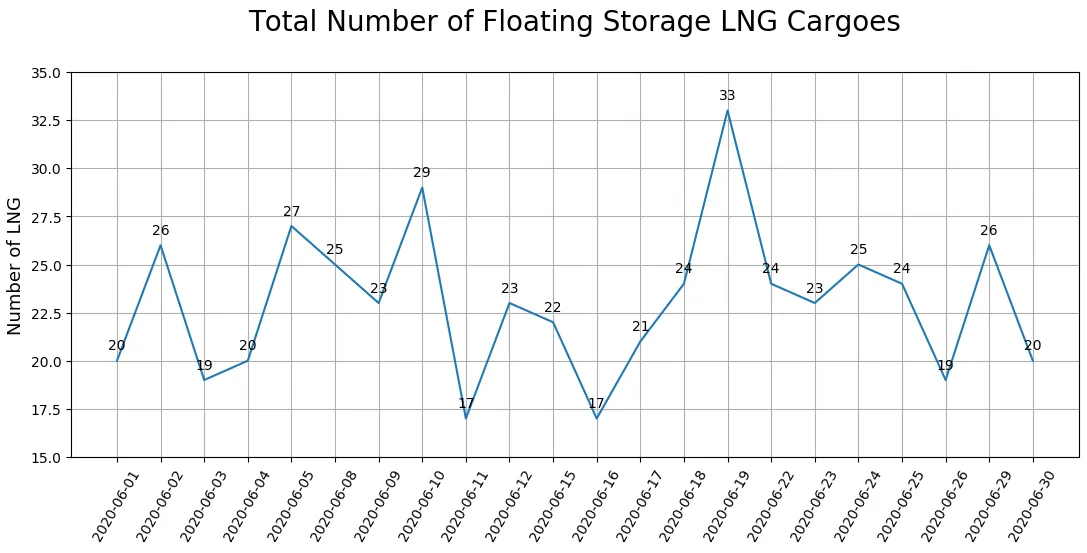
The number of floating LNG cargoes remained volatile last month, with the highest number of vessels at 33 occurring on June 19.
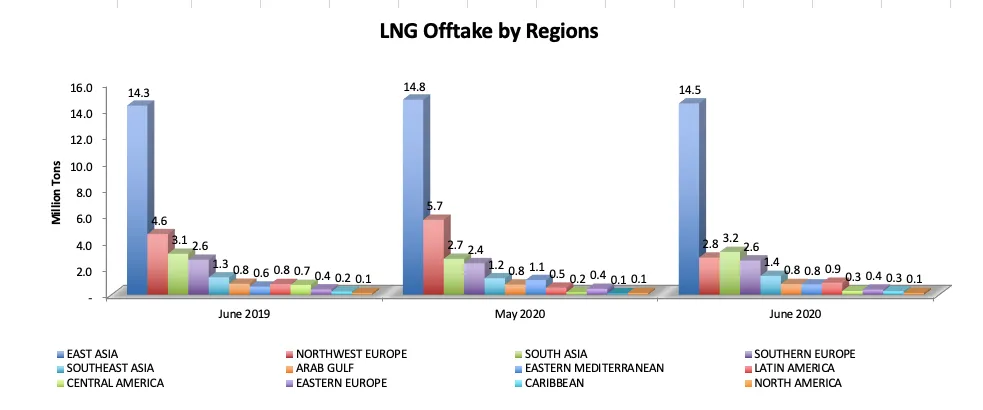
East Asia took in 14.5 million tons of LNG in June 2020, slightly higher than the 14.3 million tons taken in during June 2019. For South Asia, the 3.2 million tons imported in June represented a 4 percent increase from year-ago levels.
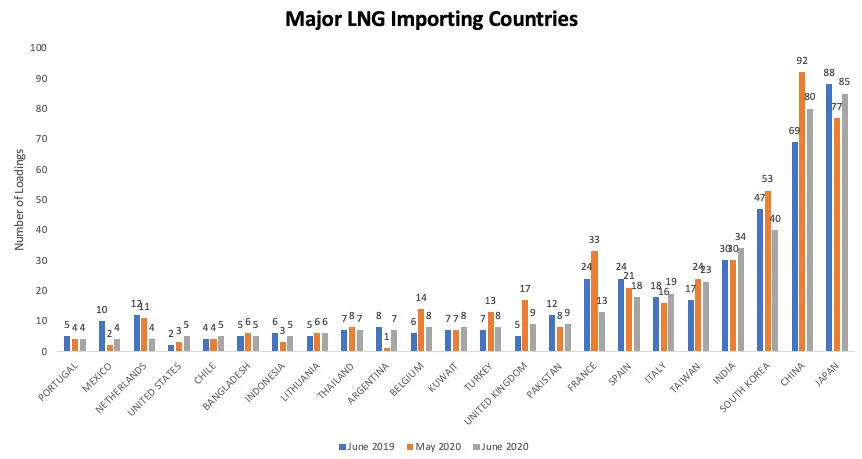
Chinese LNG imports remained strong with 5.2 million tons received on 80 vessels in June 2020, higher than June 2019 imports of 4.7 million tons, while Japanese imports rose from 4.7 million tons in May 2020 to 5.2 million tons in June 2020.
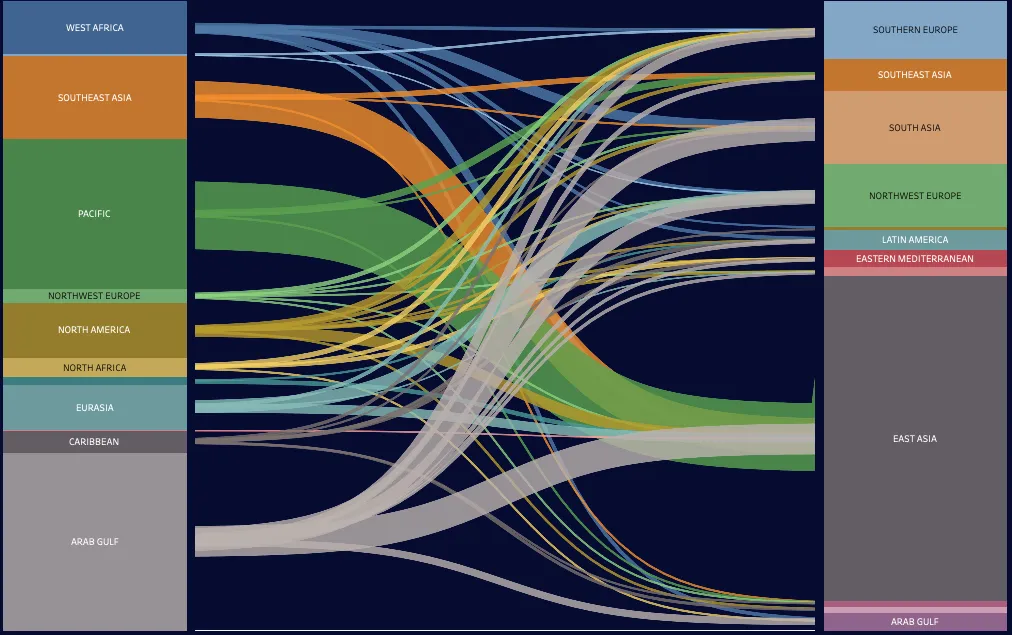
The Asia-Pacific region exported about 6.6 million tons of LNG in June, approximately 0.4 million tons less than in May and on par with year-ago levels. Exports from the Arab Gulf came in at 7.9 million tons, higher than the May pace of 7.8 million tons.
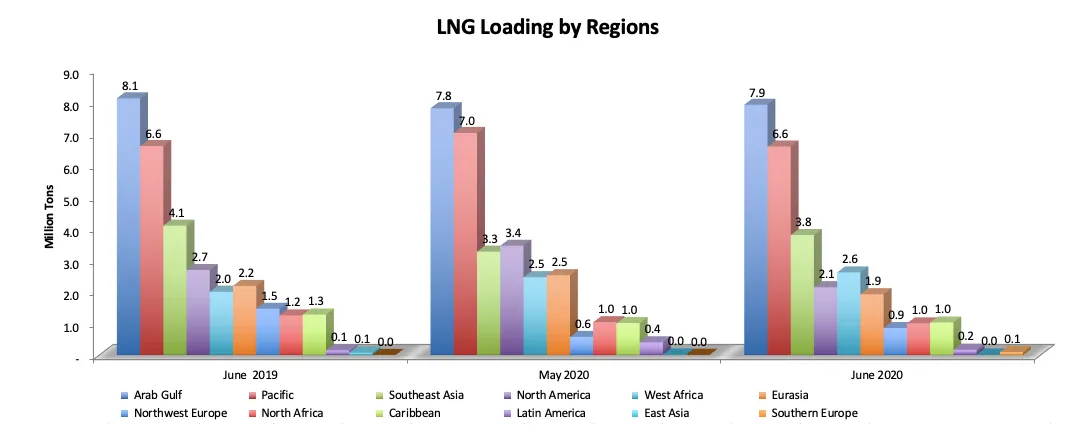
North America exports in June are down by 20% on a year-over-year basis to 2.1 million tons, and approximately 1.3 million tons lower than in the month prior. Northern Russia loaded 1.3 million tons in June, down by 0.2 million tons from May 2020 and 0.3 million tons lower than the volume loaded in June 2019.
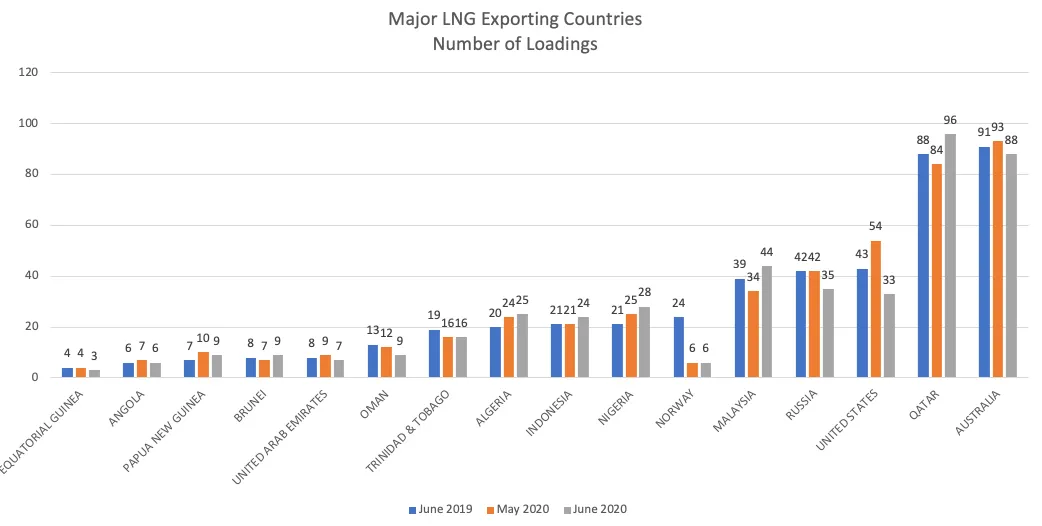
LNG exports were lower last month from Australia, United States & Norway, while exports from the Arab Gulf & West Africa exports remained normal.
The European reloading arbitrage window remained closed throughout June 2020, with ten out of 14 reloaded cargoes leaving from European terminals, with only one discharging in the NE Asian market.
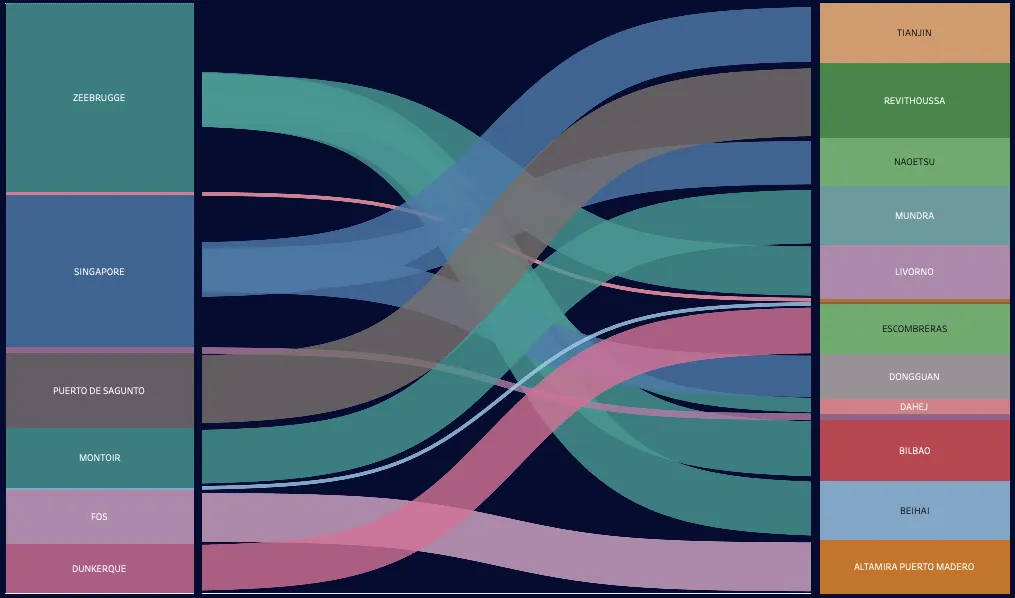
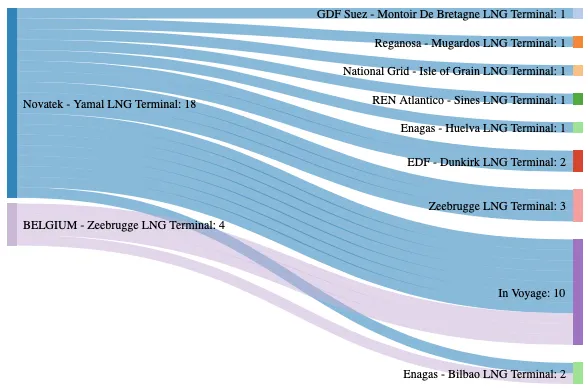
During June 2020, 18 vessels left from the Yamal LNG project in Northern Russia, with three vessels arriving at the port of Zeebrugge. Three cargoes left from the Zeebrugge Terminal, Belgium as part of a transshipment of Northern Russian LNG.
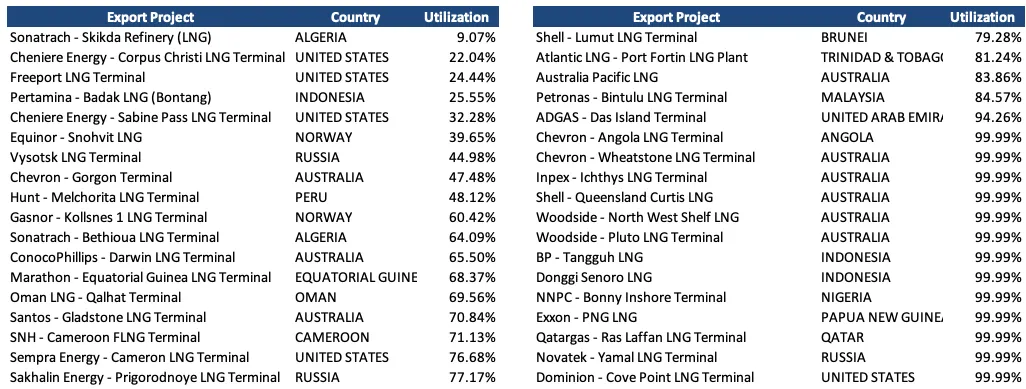
LNG export terminal utilization based upon ClipperData shipping tracking is listed below:
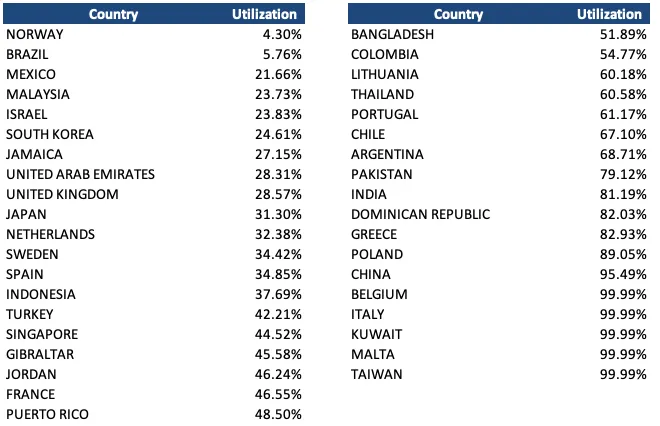
Below is countrywide LNG import terminal utilization:
To learn more about the data behind this article and what ClipperData has to offer, visit https://clipperdata.com/.


Sign up to receive our stories in your inbox.
Data is changing the speed of business. Investors, Corporations, and Governments are buying new, differentiated data to gain visibility make better decisions. Don't fall behind. Let us help.


Sign up to receive our stories in your inbox.
Data is changing the speed of business. Investors, Corporations, and Governments are buying new, differentiated data to gain visibility make better decisions. Don't fall behind. Let us help.


