
In general, we found that the areas that have returned Workers the most are the same - often low-income - areas hardest-hit by COVID-19, and that Workers in these areas tend to live around where they work. Conversely, the areas that have not returned as many Workers have a higher percentage of commuters, and are often more developed office building-oriented.
When we dig in a little deeper, further distinctions arise between different boroughs and neighborhoods.
There are more active Workers in neighborhoods most affected by COVID-19
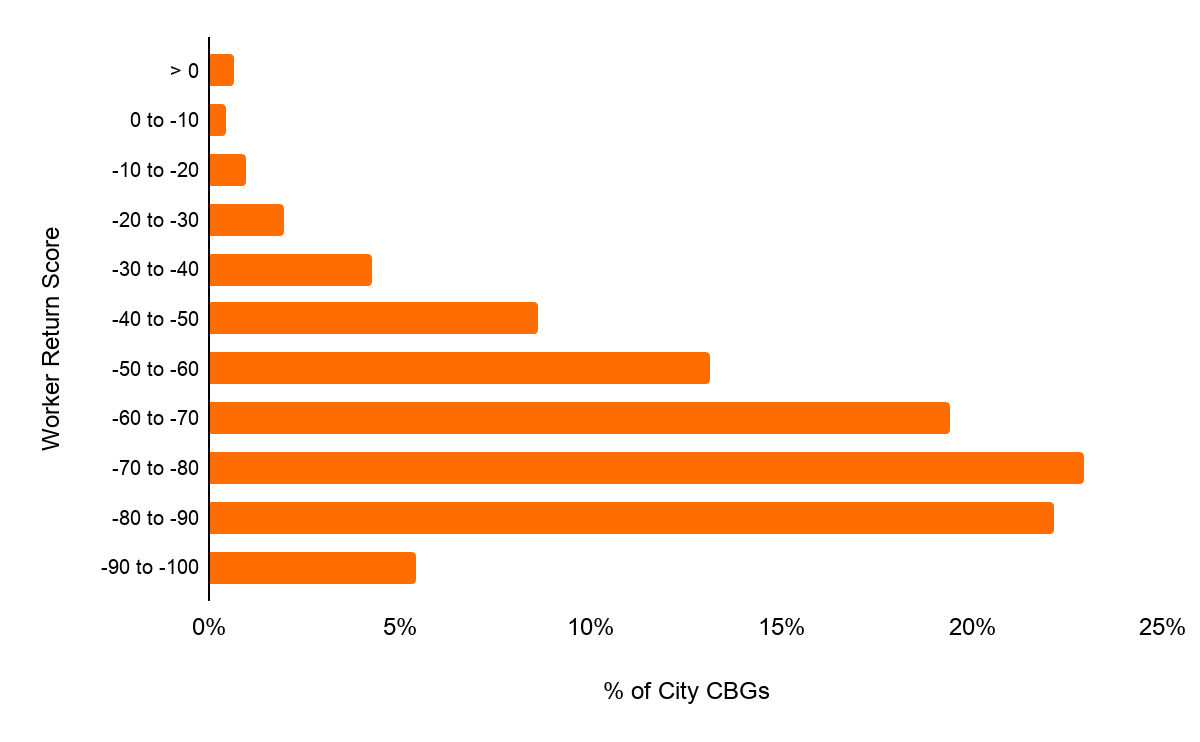
To begin, it will be useful to understand the distribution of Worker Return Score within New York City’s various CBGs. We can see from the chart that many areas in New York City have been slow to return a significant number of their workers. More than 80% of all CBGs have a Worker Return Score lower than -50.
The distribution gains a bit of differentiation when separated out by borough. Manhattan has been the slowest to return its workers by far. More than half of Manhattan CBGs are currently returning fewer than 30% of their Workers.
Meanwhile, Staten Island leads the pack in terms of commercial recovery. Nearly half of Staten Island CBGs are returning more than 50% of their Workers. The other three boroughs’ Worker Return Score distributions represent a middle ground, with none displaying the extreme aversion to returning of Manhattans’ Workers, nor the willingness to return of those on Staten Island.
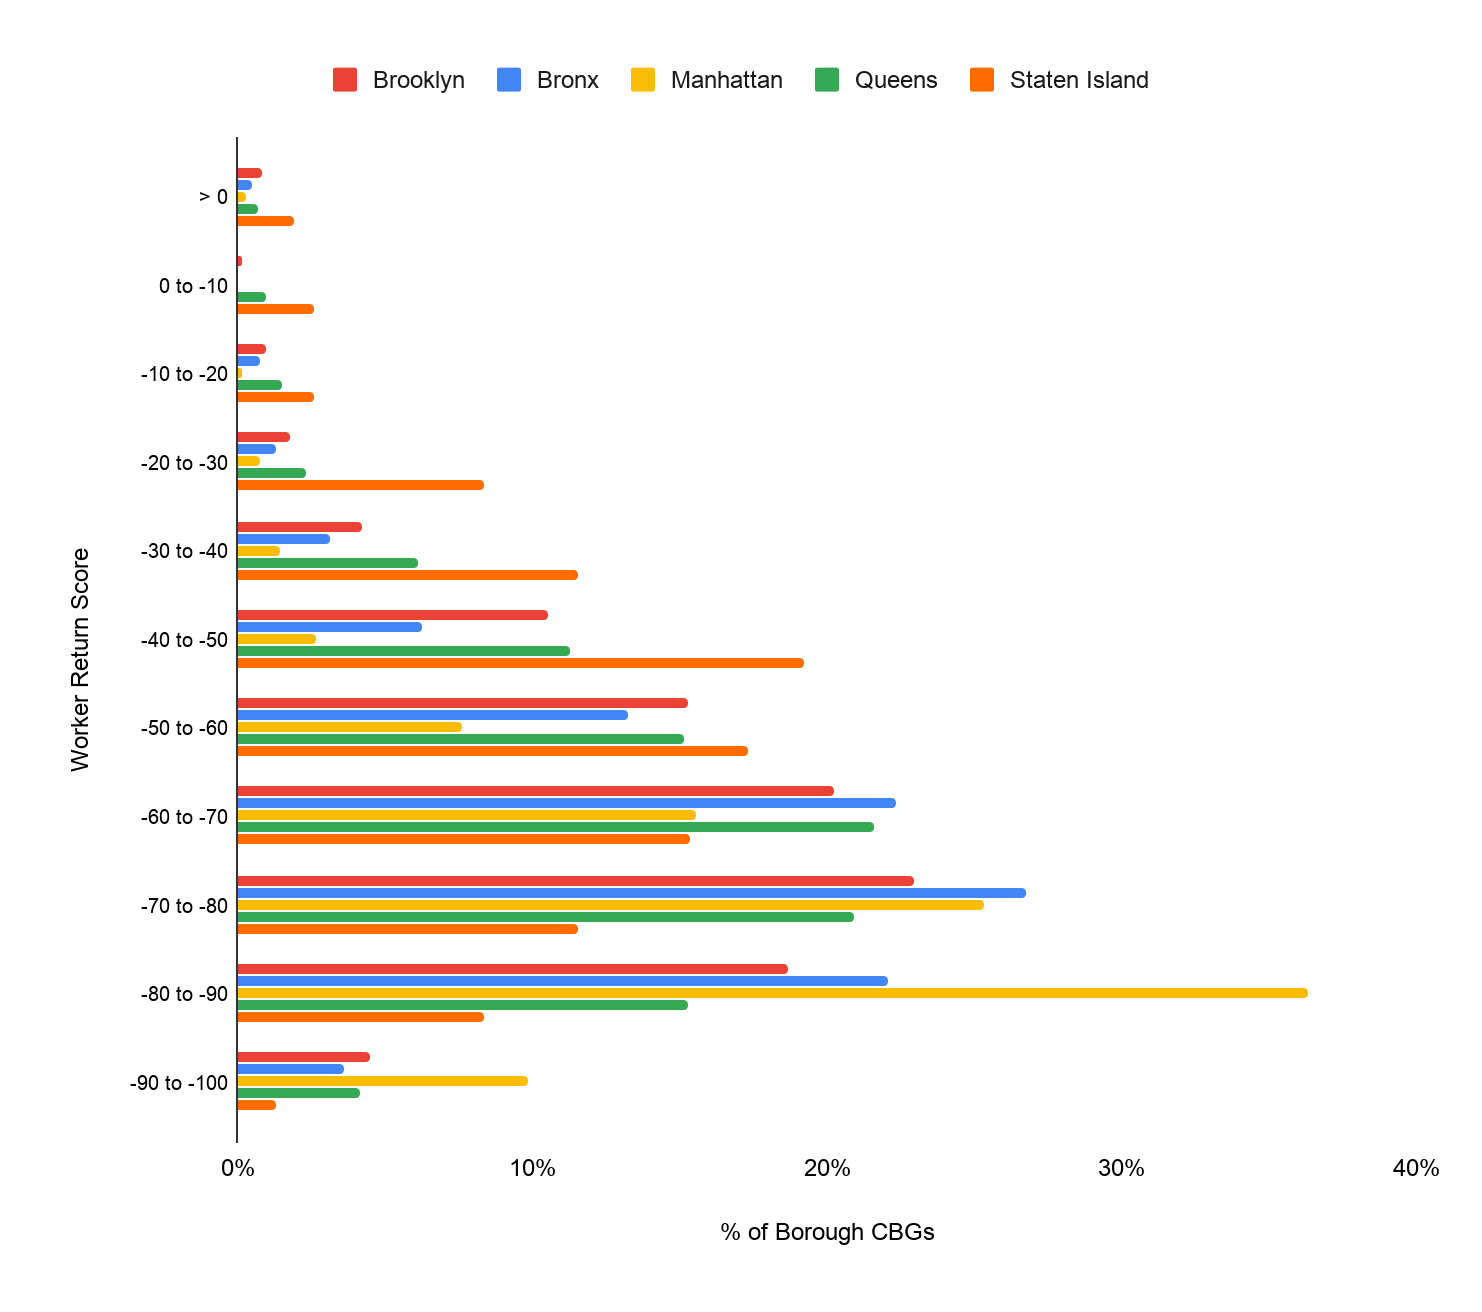
Borough CBGs by Worker Return Score Bucket
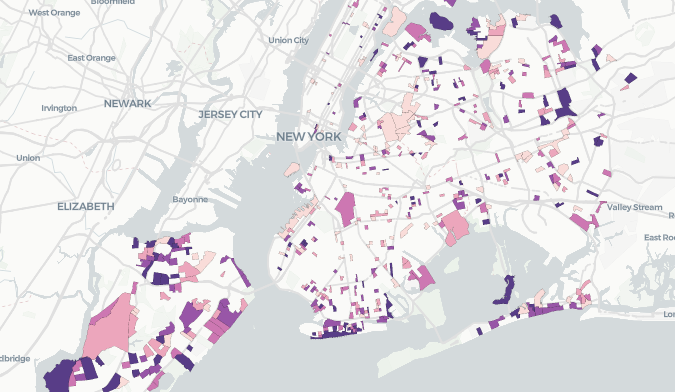
The map below looks at all NYC Census Block Groups with a Worker Return Score greater than -45. This group - “Reopening CBGs” - represents just over 20% of all CBGs in the city, providing a reliable sample size (and a nice geographic spread). As we would expect from the prior chart, Manhattan is barely represented at all in this cohort, while Staten Island is nearly half-covered.
Reopening CBGs
In the other three boroughs, the CBGs that have returned the most Workers are on the boroughs’ outer edges, frequently in areas where COVID-19 has flared - compare the locations of the CBGs in the map above with the map below, showing COVID-19 cases per 100,000 by zip code within New York City (1):
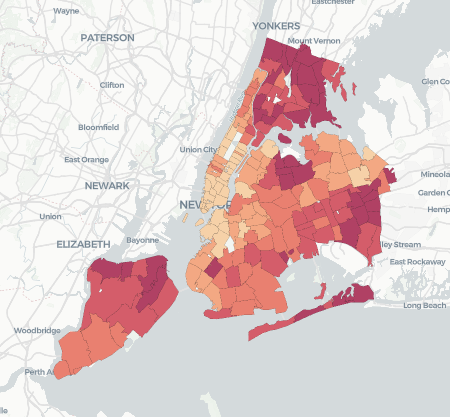
COVID-19 Cases per 100k
In other words, the CBGs with higher Worker Return Scores tend to be the neighborhoods most affected by COVID-19.
Locals work in open CBGs, while commuting Workers service unopened CBGs
The next map shows the concentration of the home locations(2) of people that work in the “Reopening CBG” group from the map above. What’s notable here is that hot-spots of residency in the map below match up well with the locations of the Reopening CBGs in the map above. In other words, many Workers in Reopening CBGs are also Residents in the neighborhoods where they work(3).
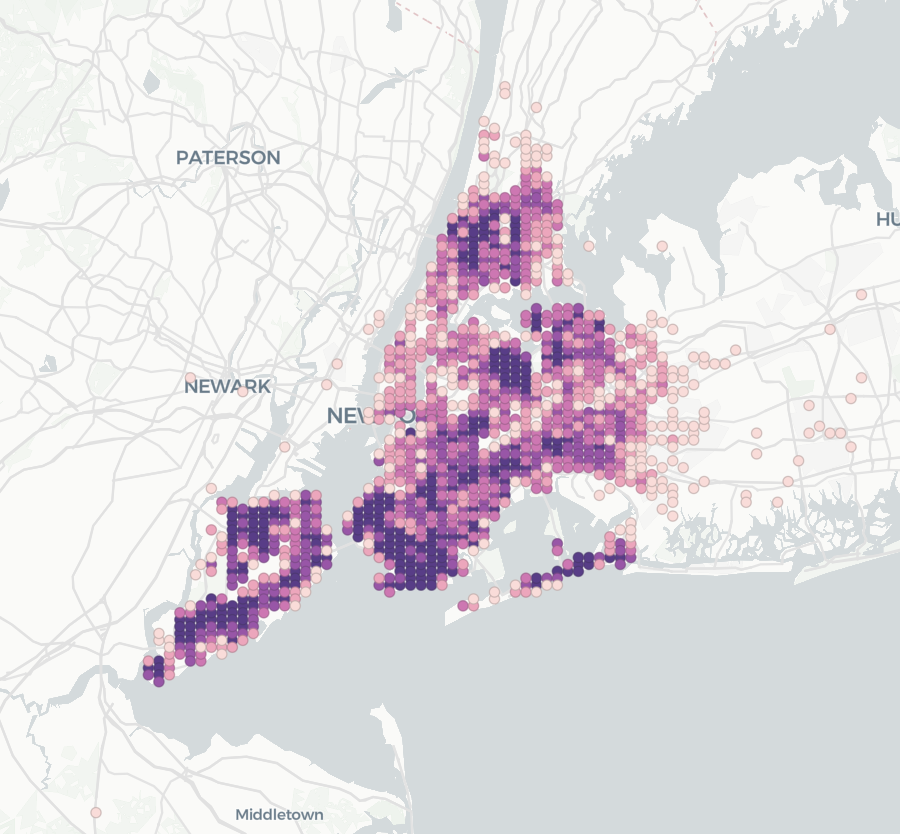
Residency Density for Workers in Reopening CBGs
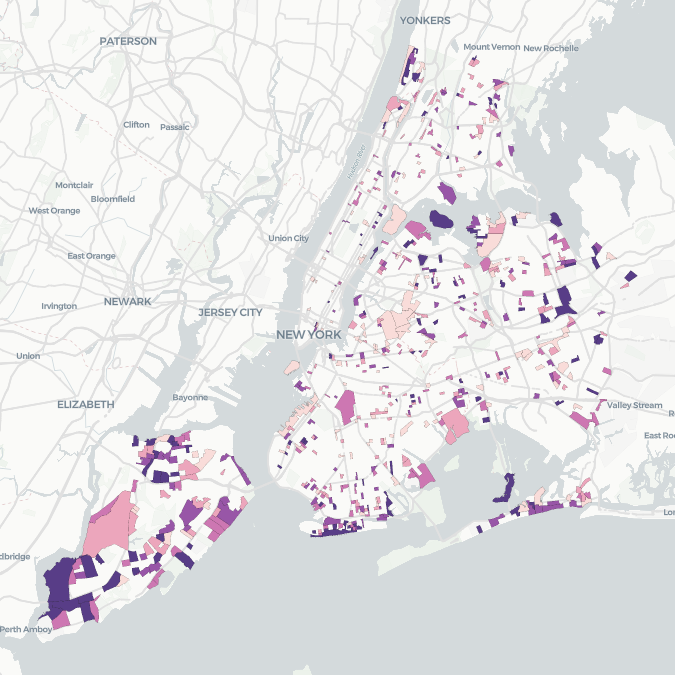
In contrast, the two maps below show the ~20% of CBGs where the Worker Return Score is below -80, i.e. “Shuttered CBGs”, along with the home locations of people that work there.
The first, most obvious difference is the heavy representation of Manhattan in this set of maps - both in the map of Shuttered CBGs themselves, and in the map of Worker residency. The second is the overall pattern of residency. As in the previous example, many Workers do appear to be Residents in the same neighborhoods they work - as mentioned, these two maps are considerably heavier in Manhattan and the neighborhoods directly adjacent to it, considerably lighter in the outer areas of the other boroughs. However, robust clusters of residency also appear in areas not represented in Shuttered CBGs. Staten Island and New Jersey light up as home locations for a significant number of commuting Workers whose place of employment is in a Shuttered CBG.
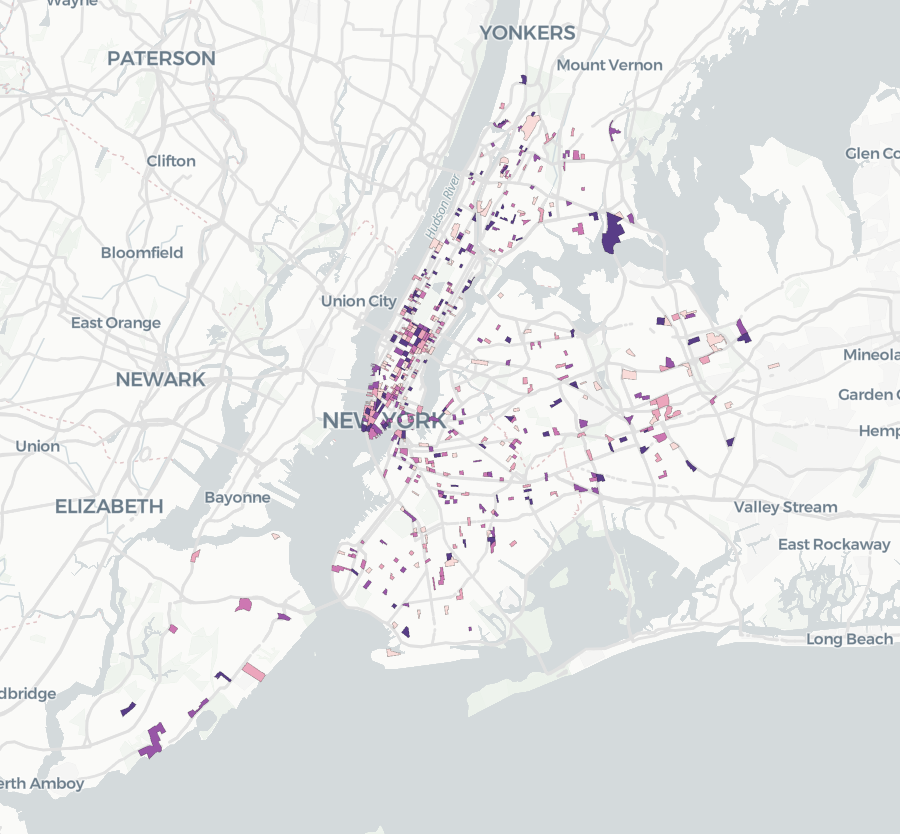
Shuttered CBGs
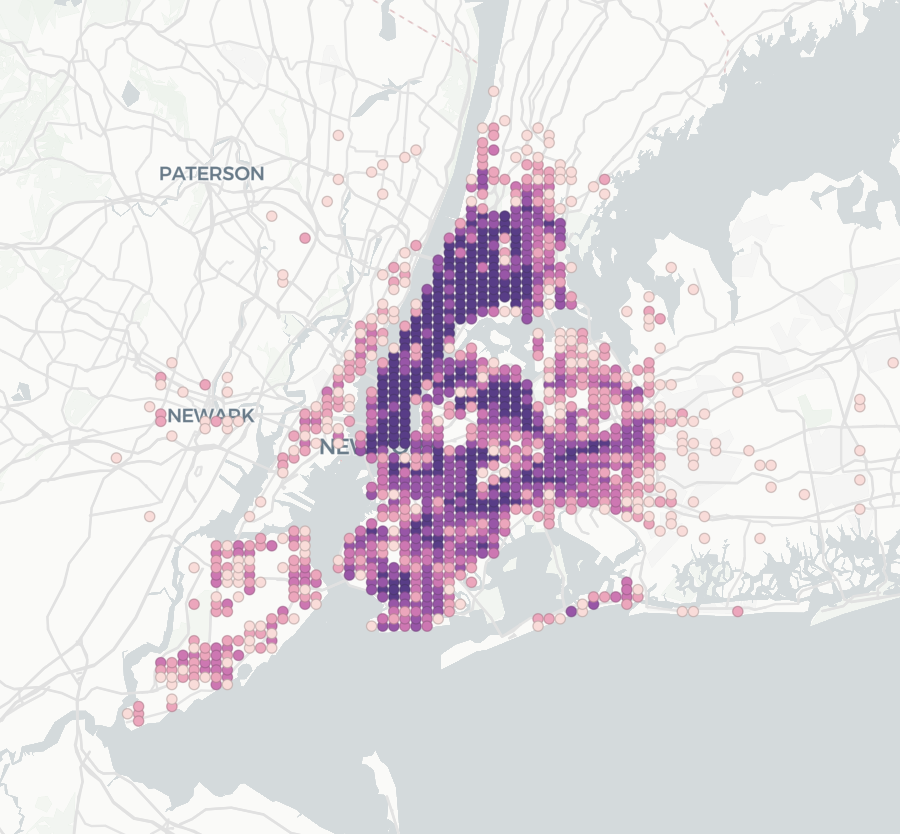
Residency Density for Workers in Shuttered CBGs
In review, the movement of Workers in and out of various CBGs may be tied to the demand for different services in each borough and the relative ability of area Residents to supply the required labor. In next week’s post, we will take a closer look at the impact on how New York City’s evolving mobility patterns have affected businesses in Reopening vs Shuttered CBGs.
(1): Source: New York City Department of Health and Mental Hygiene.
(2): All devices’ estimated home locations are snapped to a grid during processing to protect the privacy of the individuals they belong to. For analytical purposes, we only have access to the geo-hashed map shown below.
(3): Note that the percentage of Workers who are also Residents in the exact CBG in which they work does not change significantly by borough - so it is unlikely that higher Worker Return Scores are driven by incidental visits from Residents
To learn more about the data behind this article and what Unacast has to offer, visit https://www.unacast.com/.


Sign up to receive our stories in your inbox.
Data is changing the speed of business. Investors, Corporations, and Governments are buying new, differentiated data to gain visibility make better decisions. Don't fall behind. Let us help.


Sign up to receive our stories in your inbox.
Data is changing the speed of business. Investors, Corporations, and Governments are buying new, differentiated data to gain visibility make better decisions. Don't fall behind. Let us help.