
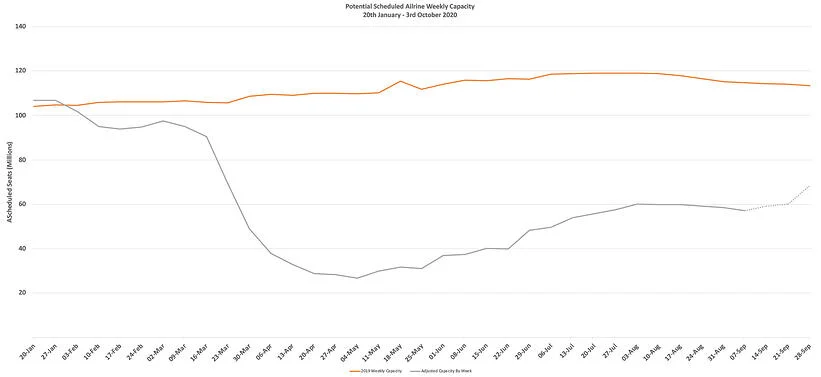
The first full week of September capacity follows the recent trend and we are now into the fifth consecutive week of capacity declines from what looks like the peak capacity week of the 3rd August. Project the current trend forward to the year end and global capacity will fall below 40 million in the last week of December; that will not be a happy Christmas for the airline industry. The last full week of December 2019 saw some 106.8 million scheduled seats, so we appear to be heading for less than half of global capacity by year end. Not quite the recovery shape that everyone expected and no need to ask what everyone will want for Christmas this year.
In the last seven days airlines have adjusted their schedules resulting in some 1.8 million seats being withdrawn at short notice as airlines grapple with the issues thrown at them every day by various travel requirements. At the moment some 59.1 million seats are planned for next week and an incredibly 68.3 million for the last week of September; network planners and revenue management teams are going to be cutting around 15 million seats through to the month end - GULP!
Chart 1 – Scheduled Airline Capacity by Week Compared to Schedules Filed on 20th January 2020 & Previous Year
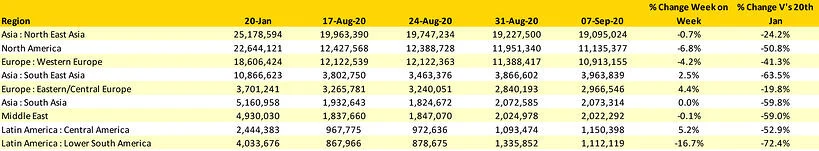
Weekly capacity in North America has fallen by 6.8% week on week as airlines grapple with their network structures ahead of any possible extension of the CARES Act. Announcements from all of the US majors in the last few weeks have been well documented but the reality of the act expiring at the end of the month has really brought into sharp focus the issues to be faced. Just ask any airline employee in the United Sates.
Western Europe has also seen a near half a million cut in capacity (475k) week on week as the latest round of travel restrictions and the lack of any corporate demand are stifling any recovery. Whilst there seems to be gathering momentum for changes in policy and travel protocols, we remain some distance from creating the necessary traveller confidence.
And finally, the much-anticipated recovery of capacity in Lower South America has not materialised as travel restrictions have in many cases been extended out until the end of September at the earliest. With two of the largest based carriers in Latin America in Chapter 11 and having to dramatically restructure their networks to secure the necessary approvals it seems like a long journey to recovery for Latin America.
Table 1 – Scheduled Airline Capacity by Region, 20th Jan – 13th September 2020 by Region
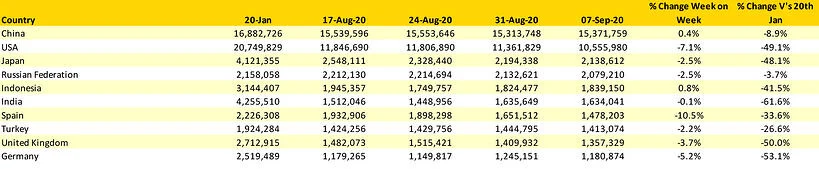
China’s position as the largest market continues to strengthen as a 7% reduction in US capacity works its way through the data; 45% larger than the US market China remains at near 90% of its pre Covid-19 levels. However, the Russian Federation is the largest major market closest to January levels with just a 3.7% shortfall in capacity.
Spain is this week’s largest losers in the “top of the pops” chart with a 10.5% cut in capacity this week. The United Kingdom and Germany also report cuts in capacity and both markets are now at or below 50% of their January capacity levels.
Table 2 - Top 10 Counties Markets
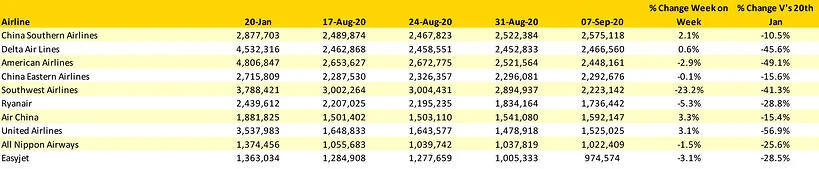
The capacity cuts in the United States are all around Southwest Airlines; for many weeks the world’s largest airline, a capacity cut of some 670,000 seats in one week is amongst the most dramatic cuts we have seen since April in the whole Covid-19 crisis. Continuing the theme of low-cost airline capacity cutbacks both Ryanair and easyJet shaved some more capacity from their networks.
Table 3 - Scheduled Capacity Top 10 Airlines
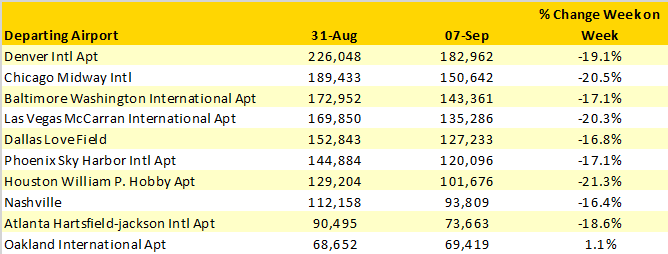
A slightly deeper look at the capacity cuts from Southwest this week indicates that nearly all of their major hubs have been affected with between 21% and 16% being the range for most airports. There is however one notable exception, Oakland International Airport where capacity has only been cut by 1% week on week; there may be more capacity to be cut but at the moment it looks like Oakland has fared well.
Amongst those Southwest Airlines airports with the biggest losses are Washington Reagan and Hartfort Bradley who are both down 60% in one week and in the case of Washington that equates to around 16,000 seats. Equally, there are a few winners in the Southwest shuffle, Long Beach sees a 78% growth as part of a strategic network switch and Midland International has a 9% growth. All of which highlights that there are always winners and losers in the airline’s networks.
Table 4 - Southwest Airlines Capacity Cuts, W/C 31st August V’s 7th Sept 2020
Last week we noted that the next six weeks will define the winter season for the airline industry and its now “one down and five to go” but not much has changed although there are some signs of things moving. Consultation around the winter slot usage and the 80:20 requirement appears to have made some progress; media pressure is growing on various governments to sharpen their blunt instruments and get travel moving once again.
Despite those hopefully positive developments the loss of 15 million extra seats by the end of September continues to place real pressure on airlines around the globe and many are now at that point where deeper and harder cuts may be required to survive. We can only hope that things do pick up but if as our leaders keep telling us and “we follow the data” then this winter looks increasingly awful.
Although only time will really tell.
To learn more about the data behind this article and what OAG has to offer, visit https://www.oag.com/.


Sign up to receive our stories in your inbox.
Data is changing the speed of business. Investors, Corporations, and Governments are buying new, differentiated data to gain visibility make better decisions. Don't fall behind. Let us help.


Sign up to receive our stories in your inbox.
Data is changing the speed of business. Investors, Corporations, and Governments are buying new, differentiated data to gain visibility make better decisions. Don't fall behind. Let us help.