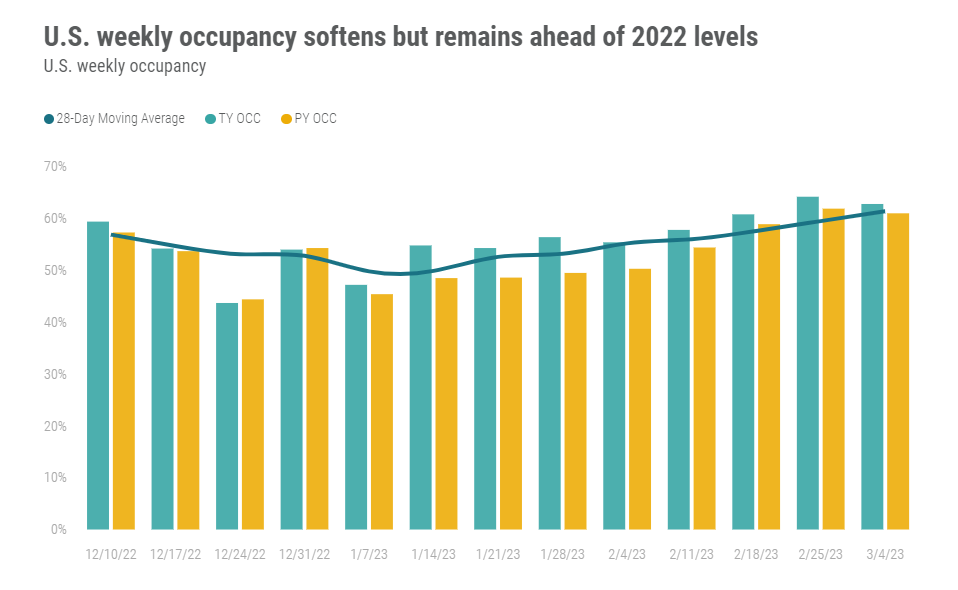
U.S. Performance
Hotel occupancy came in at 62.8%, which was down from an elevated 64.2% the week prior (Presidents’ Day holiday) but higher than all other weeks in 2023 and 3.0% above the 2022 comparable. Average daily rate (ADR) was lower week over week as well but up 8.9% year over year (YoY) to US$151. As a result, revenue per available room (RevPAR) gained 12.1% YoY to US$95. As the 2022 Omicron calendar comparison fades, hotel performance is resembling a more normal pattern as evidenced by improving occupancy in major markets and growing group demand.
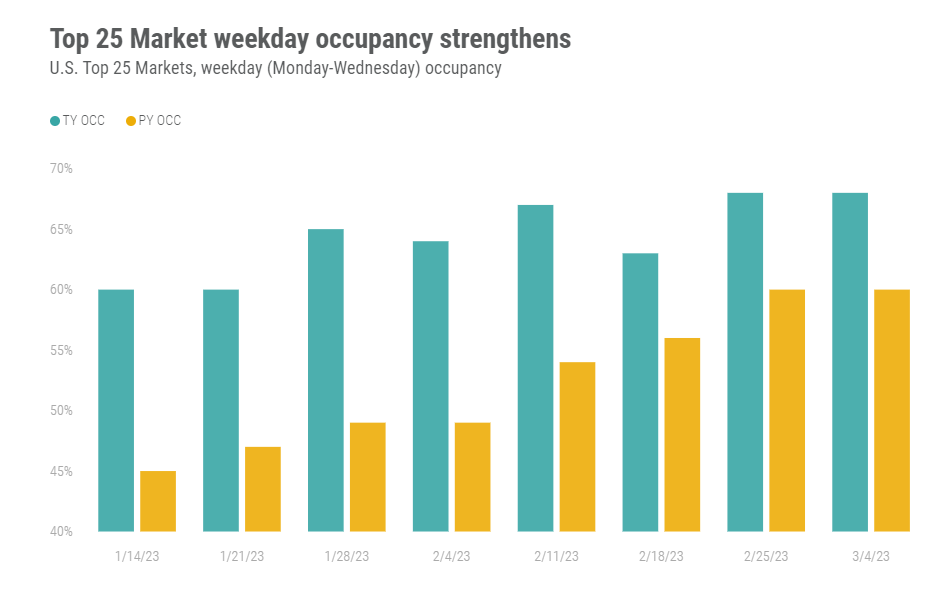
One indication of a return to normal patterns is seen in the strong performance in the Top 25 Markets, which still have ground to make up from pandemic losses. The Top 25 led the week’s YoY growth in occupancy, up 5.3 percentage points (ppts) to 69.1%, while the rest of the country at 59.5% was basically flat (-0.2 ppt).
Cool weather Top 25 Markets, which tend to be more business-oriented in March and less attractive to leisure travelers, such as Boston, Denver, Detroit, New York City and Washington, D.C., were the top performers in terms of YoY occupancy increases. Some of the warmer markets, like Miami, New Orleans, and Orlando, experienced slight YoY occupancy declines although their overall occupancy levels remained among the highest in the country due to continued strong leisure demand.
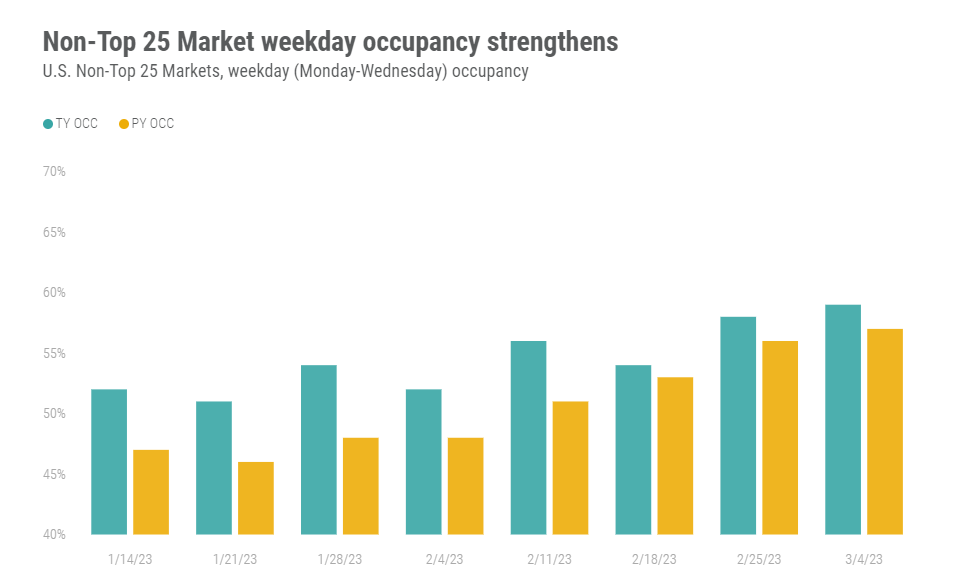
Non-Top 25 Markets recorded an ADR increase of 5.2%, which combined with a slight occupancy decline (-0.2 ppt), netted a RevPAR increase of 4.9%. Non-Top 25 Markets seeing the greatest year-over-year increases were Lexington, Hartford, Michigan South and Bergen/Passaic—also cooler weather markets.
Evidence of growth in business travel
A day of week review shows weekday (Monday-Wednesday) occupancy driving the growth in the Top 25 Markets, with occupancy increasing 8.1 ppts and keeping pace with a similar increase seen the previous week. This increase was greater than the 5.3 ppt increase seen overall, pointing to increasing strength for weekdays. Weekday occupancy also increased outside the Top 25 Markets and, while at a lower rate (+1.5 ppt), was still an increase when compared to the overall decline in occupancy for the non-Top 25 Markets.
This improved weekday performance for both Top 25 Markets and Non-top 25 Markets is continued evidence of the growth in business travel.
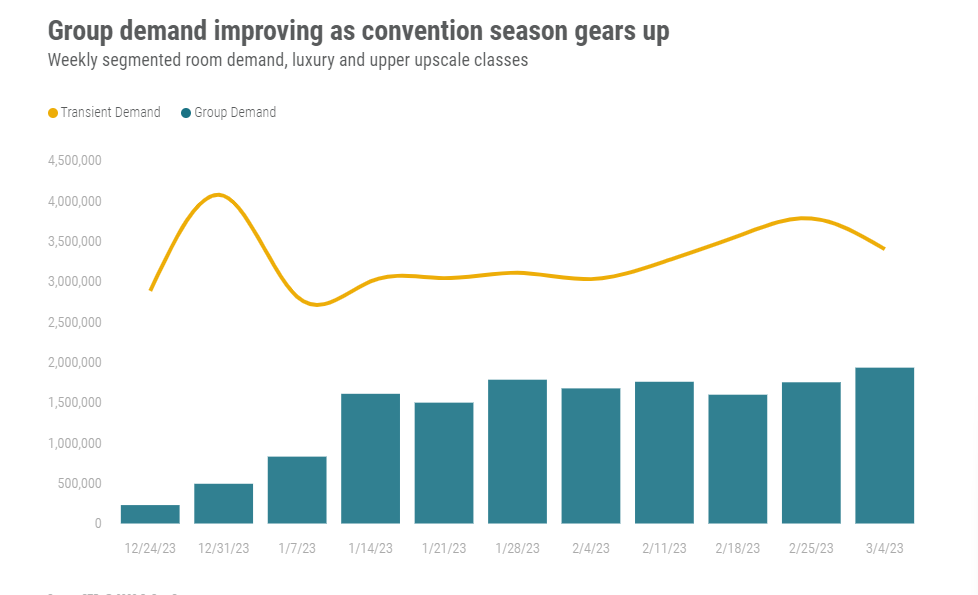
Group demand marching onward
Further supporting the return to normal is the return of group demand. Group demand reached almost 2 million rooms sold, up 10% from the prior week and closing in on the 2.3 million rooms sold at the height of the conference/convention season in fall 2022. Given that the season is just getting started, this group demand growth bodes well for a strong spring for group business. The Top 25 Markets seeing the greatest YoY group demand increase are also cool weather cities, with Denver, Minneapolis, Philadelphia, St. Louis, and Washington, DC landing at the top of the list. The non-Top 25 Markets seeing the greatest weekly increase in group room demand were Salt Lake City, Oklahoma City and San Jose/Santa Cruz.
Global Performance
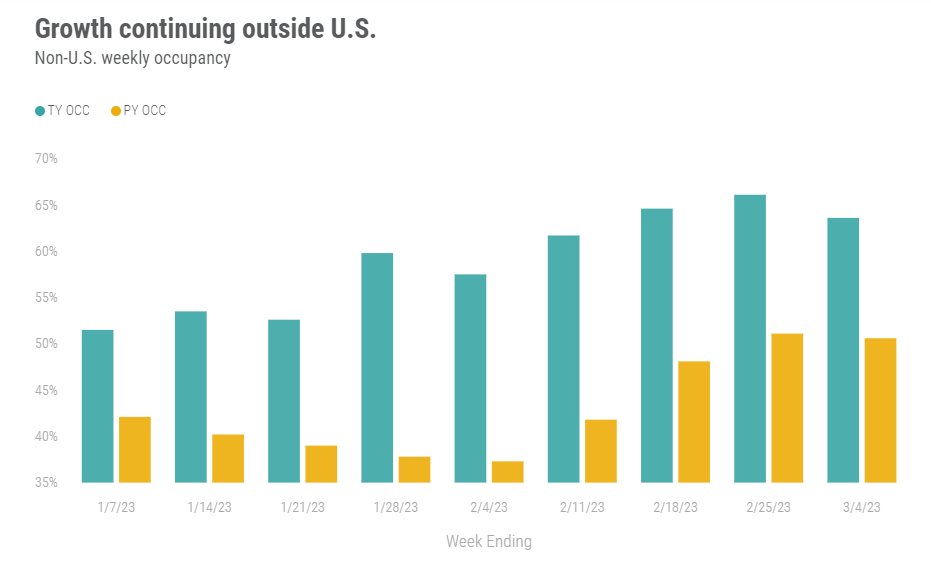
Global hotel occupancy (excluding the U.S.) continued to strengthen against last year’s Omicron comps. The most recent week did show a seasonal decrease (-3.1 ppts) compared to the prior week, dropping to 63.8%. However, that level was still well above last year’s occupancy. On an annual basis, the recent matched week’s results increased 13.0ppts YoY. ADR increased 11.3% YoY to US$129 with RevPAR up 40% YoY to US$82.
Barbados had the highest occupancy of any country and continued to show robust winter seasonal weekly occupancy of 86.8%, with the past week marking the country’s 11th week among the last 16 that exceeded 85% occupancy. The United Arab Emirates dropped to a global second-best position (86.2%) from the previous week’s top spot but still managed to score its sixth best weekly occupancy during the COVID-era.
Occupancy was also comparatively strong in Puerto Rico (82.0%), Guam (82.0%) and Bangladesh (80.2%). Overall, the Middle East (77.7%) and Caribbean (75.2%) had the highest occupancy of all subcontinents.
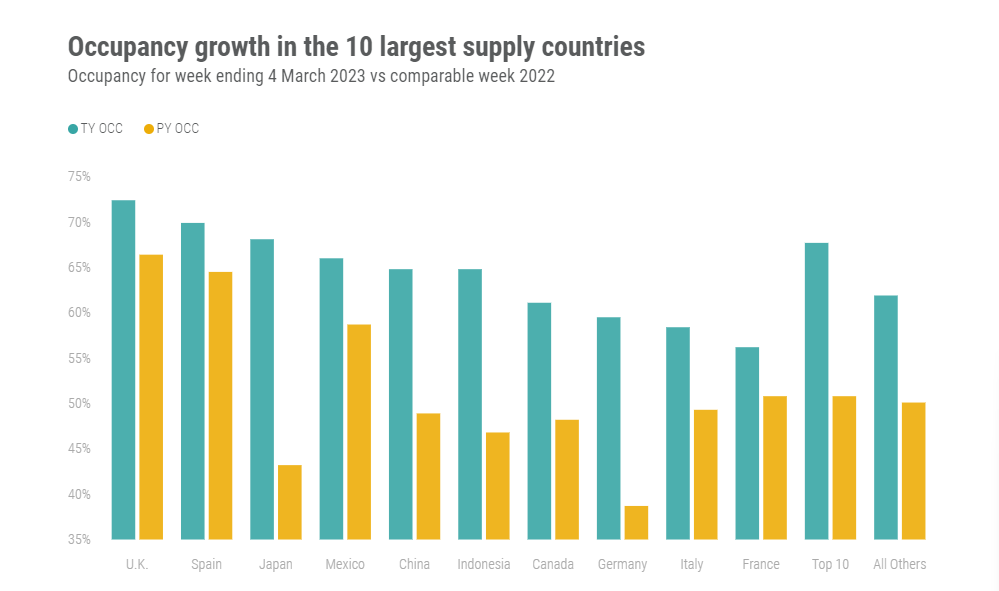
Among the 10 largest countries by hotel supply, the United Kingdom reported the highest weekly occupancy (72.4%) followed by Spain (69.9%) and Japan (68.1%). Most large markets except for Germany (+2.4ppts) experienced some expected seasonal slowing in occupancy, with the largest week-over-week declines in Italy (-9.0ppts) and Japan (-6.8ppts). In aggregate, the top 10 countries registered a year-over-year occupancy gain of 13.7ppts to 64.7%. Top 10 ADR increased 11.2% YoY to US$119, and RevPAR grew 41.5% to US$77.
Final thoughts
The U.S. hotel industry is now past the Omicron comparable of 2022 and appears to be finishing the first quarter of 2023 with slow but steady growth. The continued return of the Top 25 U.S. Markets and strengthening of most global markets, which during the pandemic suffered the most, is an encouraging sign of a return to normalcy. Additionally, leisure travel does not appear to be letting up, and as the industry moves into spring break season, leisure travel should continue to be robust.
Looking ahead
Occupancy and ADR in the U.S. is predicted to pick up for the next week as we enter the spring break season. Globally, strong growth is expected to continue with increasing demand across most countries, most notably China. Asian countries are currently reaping the benefit of China’s reopening, which should eventually spread to more distant countries. RevPAR growth outside the U.S. will likely show strong double-digit increases for the foreseeable future.
To learn more about the data behind this article and what STR has to offer, visit https://str.com/.


Sign up to receive our stories in your inbox.
Data is changing the speed of business. Investors, Corporations, and Governments are buying new, differentiated data to gain visibility make better decisions. Don't fall behind. Let us help.


Sign up to receive our stories in your inbox.
Data is changing the speed of business. Investors, Corporations, and Governments are buying new, differentiated data to gain visibility make better decisions. Don't fall behind. Let us help.